Short trade SOLUSD daily chart 1/5/22This assumes support level will act as resistance in upcoming weeks. DYOR.
stop loss 188
target profit A 154.14
target profit B 131.51
target profit C 102.98
sol bulls need price to stay above 148
Stoploss

DREAMS QUEST Wedge Breakout 1043% potential (Mobile Version)Hello traders,
DISSECTING A FALLING WEDGE TRADE
THE STRUCTURE
Todays technical analysis is on DREAMS QUEST. This coin seems to be consolidating in a falling wedge pattern which I have seen many times play out very well for the Kucoin bangers that get listed. What you want to look for on a falling wedge pattern is 3 touches on both the bottom support trend and 3 touches on the top resistance trend. This will be the formation of the bullish consolidation falling wedge pattern as saw in the chart.
The key indicators of a bullish falling wedge parttern are a wide mouth at the beginning of the pattern and bullish price heading up to the top of the pattern. Then an ABC corrective wave during a bearish down trend that consolidates tightly at the end of the pattern. A lot of times you will be able to use a fib tool from the bottom of the recent to the top of the beginning of the wedge and see that the bottom of the wedge generally bounces off of the 50% Fibonacci level indicating the price action may have exhausted the bearish market participants.
THE STOP LOSS
There is nothing more important in trading than risk management and protecting your capital. No matter how good of a pattern you see or how promising a trade set up is, the market could always have some bearish news that completely destroys your position. Thus, if you’re going to trade, USE A STOP LOSS!! Ok, for this particular pattern, placing your stop loss is pretty simple, I have a general rule of thumb to place my stop loss 3% below the last swing low of the falling wedge prior to the breakout. Which this will be placed after your entry which we will go over next but, I have listed it in this tutorial first as it is more important than your entry! Your initial stop loss is at .06295¢
THE ENTRY
Your entry will be upon the breakout of the top of the wedge located in area #1 or upon retest of the breakout areas in box #2 shown on the chart. Upon breakout of the top of the falling wedge pattern, in the box labeled #1 this being your initial breakout area, you’re going to want to see a CLEAR bullish candle on the daily come above the trend line and be in the #1 buy box before entry to confirm that breakout. The entry for this trade is between .08718¢ and .09880¢
KEY NOTE and always a rule of thumb here is patience, your entry will come. Make sure you have a clear closed candle outside of the pattern before you think about opening a trade as there are very often false breakouts and it’s better to have a slightly less favorable entry than to have an entry that will end up getting you stopped out before the trade even starts.
Last but not least, another KEY NOTE to look for when placing your entry is to make sure you watch for a spike or increase in volume upon breakout. This is a solid indication that the selling pressure has been exhausted and the market participants are turning bullish, adding more quality to your trade. ALWAYS LOOK FOR THIS INDICATOR FOR OPTIMAL TRADE RESULTS.
THE ALLOCATION
I generally enter with 25%-50% of my allocation I have set aside for this trade at this point. When you’re actively trading it is important to keep your allocation low as when you have a large amount of your capital in a specific trade the hardest parts about trading start affecting you and coming into play. That is the psychology of the trade. The more money you have in any given trade will draw bigger fear and bigger ego if you have a loss or a win. Both are equally bad in trading and will cause you to lose money. So when I say I allocate 25%-50% of the funds I have for this specific trade you have to keep in mind that you should not be using more than 3% of your total account in any particular trade this, my 25%-50% is actually .75%-1.5% of my total account. This makes it easier to just let the trade ride and to follow my plan regardless if I am correct or wrong about my trade, it’s is a calculated loss with a small amount of capital allowing me to have a higher chance of having a smaller drawdown on my overall capital if the market gets bearish on me while I’m in a few longs. So, getting to the other half of my allocation. Generally a consolidation like this will have a very bullish breakout that will pop a hot few candles out of the pattern and generally head to the .618-.5 fib measured from the top to the bottom of the full falling wedge pattern. At this point I take a small amount of profit. About 50% of my current position. This will leave me with .375%- .75% of my capital still in the trade and a small amount of profit that I made from the initial breakout on the side. Now here comes the most important attribute you need to be a good trader, PATIENCE !!! After my small win, I am looking to enter back into this trade at the official retest of the breakout of the pattern. This generally comes shortly after the first target is hit. Again, patience is imperative to your success as a trader. Wait it out until you have a clear candle back at the entry point before you add your second half of your position.
PATIENCE IS KEY BUT, ALARMS HELP!
Have I mentioned that patience is an important attribute you must have to be a successful trader? Not enough? Ok, we’ll it is! I do know that all of our time is very precious and dear so, I have a small remedy to help with allocations your time so you’re not just starting at your charts… USE ALARMS!! TradingView had everything that you need to be successful, it is your responsibility to learn it so you can earn it! I generally first set an alarm at the entry point of my trade set up that I have identified as well as where I’d expect the stop loss to be. #1, so I can be reminded that the trade has either entered my first entry zone, or to let me know that the trade I have identified may not be what I thought it was and to re assess the situation or find a new trade. Again, patience! So, after my entry alarm goes off and I start my initial position, I then set my stop loss and assure my alarm is set a few pips above my stop loss so I can be alerted before it hits as well as well as an alarm at my first target and one more at my entry point. This way I can be alerted that my first take profit was hit and if the price action comes back down to retest I have an alarm there as well to place my second position along with my profit from the first target TP allocated to the whole trade. At this time I double check that my stop loss is a market stop for my total position and that I have an alarm set up for it that sends a text to my phone just in case!
After this I gage my take profit targets and place alarms on all of them as well.
SETTING YOUR TAKE PROFIT TARGETS
This is what we are here for, the profit right? So it’s important that you have take profit targets (TP TARGETS) on your chart as you need to plan the points you’d like to exit your trade. The first target I find is the total and final take profit of the pattern, which can be determined by measuring the distance between point A and point B which can be found at the beginning of the mouth of the falling wedge as shown in the diagram above on the top of the chart. Once you have the distance measured between points A and B you can then ad this measurement on top of the first area of the breakout candle on the bottom of the falling wedge pattern as soon as the price action shows you where it is breaking out. KEY NOTE is to always make sure you’re being conservative and by this I mean, when placing the distance from A to B on C to D, it is important that you don’t try and get it perfectly to the full measure meant on C To D. What I do is shave off a few % from the total measurement so I can allow for margin of error with my target. Minimum of 3%. Now that I have my final target set up at .99704¢ I then take a Fibonacci tool and run it from the top of the pattern to the bottom of the pattern and place TP targets at both the .5 Fib and the .618 Fib lines. I find that this is the easiest way to get quick targets on a falling wedge pattern that the price action generally will react to while heading to the final target. The .5 Fib is at .34509¢ TP target #2 and the .618 Fib TP target #1 is at .23311¢.
Congrats, you’re almost done with your trading plan! Now to the best part!
GETTING PAID!!
Everyone’s favorite part about trading! Ok, now that you have entered the quality trade, have your risk management set up and are ready to get into some profits here we can set a plan for taking some of those beautiful profits. Now being that we have 3 target areas here I generally have 3 separate take profit %’s that I set up along the way by lieu of limit sell orders for the first two TP targets. My take profit target allocation strategy is generally the 33.3% take profit strategy at every target. So for the first two targets, I will set limit sell orders for 33.3% and a 33.4% of my allocation adding up to 66.7% after the first two targets are hit. This way I am already in profit just in case something goes wrong along the way. KEY NOTE it is always smart to take profit, as if you don’t you’re just an investor without a plan and you’re never profitable until you take profit, so congrats, at this point you’re a profitable trader! Yaaayy!! Ok, so for the final take profit I set a market order as a lot of times when the final take profit comes about the price action can quickly get up to this area and we don’t want to be stuck looking for someone to take the coins off of our hands, we want to get them sold and go celebrate our win by looking for our next trade so we can compound these gains amirite??
So awesome, we have a W on the board so we’re done right? No, there’s another tip you should know in trading to assure profits and apply better risk management strategies. What is this you ask?
KEEPING AS MUCH PROFIT AS YOU CAN
How do we do this? Simple, after your first two take profits hit, which you will be reminded on your cell phone via text messge because you, ya sly devil, you set up alarms on your TP targets and now are going to head over to your exchange and move your stop loss up aren’t ya? Of course you are! Where are you moving it to? Why not make that right at your entry point so not only are we assuring we don’t lose any money on this trade at all, but, we are in fact in profit from 3 separate TP targets that we cashed in on!! NOOOOYCE!! So now that we are deciding on what color Lambo we want, we can assure we still have some bank roll by tossing that stop loss up from .06295¢ to the entry of the trade at .10416¢
Ok, you have it all set up, I wish you the best and make sure you’re doing your own research as I am not a financial advisor nor is this financial advice. Before we end, here is some key note reviews and the signal targets for the original trade below.
KEY NOTE AND TAKEAWAYS
#1: Patience is key to any successful trader success.
#2: Allocation should always be a fraction of your total account
#3: Be sure to identify the structure based on the rules above.
#4: Wait for a CLEAR breakout by looking for a daily candle close above the resistance trend line on the top of the falling wedge
#5:The retest happens after the breakout
#6: Not the 6th most important but, ALWAYS USE A STOP LOSS!!
#7: ALARMS make life easy!
#8: You have to take profit to be profitable! SO TAKE SOME OFTEN!
Entry: Between .08718¢ and .09880¢
Stop loss: .06295¢
TP1: .23311¢
TP2: .34509¢
Final TP3: .99704¢
P.S. it’s always important to know the fundamentals on a coin, so with that said, below are some stats, coin info and a link to the coins website so you can further research it during your DD.
FUNDAMENTALS
Dreams Quest Coin Price & Market Data
Dreams Quest price today is $0.090157396598 with a 24-hour trading volume of $8,589,048. DREAMS price is up 31.4% in the last 24 hours. It has a circulating supply of 0 DREAMS coins and a total supply of 186 Million. If you are looking to buy or sell Dreams Quest, KuCoin is currently the most active exchange.
Dreams Quest is building the first-ever metaverse-based economy, a self-sustaining DreamsVerse where people will be able to participate in the decentralised play-to-earn RPG game using dynamic NFTs. Unknown factors will affect character attributes in-game, and post-game outcomes will dynamically change the NFT card attributes and write them on the blockchain (the ethereal scribes) to show game history for each card.
Website: dreams.quest

LUNA continuation of the mid-term downtrend SHORTHello everyone.
Introducing LUNA to the USD.
After a sharp drop from 27/12, Luna drew a bearish flag and tested it from the bottom, which shows a continuation of the downward trend in the medium-term.
The convergence of the trend line, 0.5 Fibonacci and a similar percentage decrease act as a magnet in the designated place of my takeprofit
Cryptocurrency after the $ 100 rally, need a breath. Personally, I'm selling a LUNA with a marked stop loss of $ 90 and a takeprofit of $ 73
This is not an investment advice, but my personal analysis.
Comment and like
Greetings.

The Art of Setting a Stop LossAs a trader, the most crucial responsibility you have is to manage and preserve your trading capital. You're out of the game if you lose all of your trading money; there's no way to make up the difference. If you make pips, you must be allowed to retain them instead of returning them to the market. But, let's be honest, it's not going to happen. The market will always do what it wants and go in the direction it wants. Every day brings a new set of challenges, and practically anything from geopolitics to unexpected economic data releases to speculations about central bank policy may swing currency markets one way or the other quicker than you can clap your fingers. This is exactly why you need to use appropriate stop losses in your trades. Generally speaking, there are 4 main SL types you can encounter on the market: volatility stop, chart stop, percentage stop and time stop.
Let's begin with the most fundamental sort of stop loss: the percentage-based stop loss. The percentage-based stop employs a portion of the trader's money that is predefined. For instance, a trader's willingness to risk "3% of the account" on a deal. The percentage risk varies depending on the trader. More active traders risk up to 5-6% of their account, while less aggressive traders often risk around 1% every trade (that’s what we do as well).
Important rule of thumb here is: Always set your stop loss based on the market or your system's criteria, not on how much money you want to lose. This means that observe and learn each pair you trade. 20 pips SL on EURUSD, might be not enough on a GBPJPY trade. Some pairs make 120 pips move a day, while others average at 60. Oh, and don’t you forget about the pip value difference.
Based on what the charts are suggesting is a more rational technique to identify stops. One thing we can notice in price movement is that there are times when prices don't seem to be able to push or break through particular levels. When these levels of support or resistance are retested, they can sometimes prevent the market from moving upward again. Setting stops above and beyond these levels of support and resistance makes sense since if the market trades beyond these levels, it's logical to assume that a break of that region will attract more traders to play the break, pushing your position further against you.
Important rule of thumb here is: Set your stop losses couple pips over under the major key points, so you don’t get affected by the market noise.
More uncommon way of setting a stop loss is based on volatility (which is already considered in percentage stop loss). Volatility, to put it simply, is the amount a market might potentially fluctuate in a given length of time. Knowing how much a currency pair tends to change might help you establish the right stop loss levels and prevent getting pulled out of a trade prematurely due to market swings.
Important rule of thumb here is: Study your ways to determine daily volatilities as they do change. Two common ways of doing so is through Average True Range (ATR) and Bollinger Bands.
Stops established based on a preset time in a transaction are known as time stops. It might be a specified time (open limit time of hours, days, weeks, etc.), only trading during specific trading sessions, the market's open or active hours, or something else entirely. Set a deadline and get rid of the dead weight so money can accomplish what it's supposed to.
Important rule of thumb here is: The time stops ultimately come down to what type of trader you are. So before, you start setting time limits you should understand whether you’re intraday, swing, long-term trader.
Conclusion: We often draw a line between good traders and “The BEST”. What makes a difference in this case? Good trader uses a certain type of stop loss. “THE BEST” traders use a combination of all. An example would be looking at a EURUSD pair. We do our technicals, we have a predetermined percentage in our mind, we have a predetermined time in our mind, and we’ve considered the volatility of the mentioned pair. For instance, we set our Stop Losses close to key zones determined by price action, we wouldn’t risk more than 1% on a single trade, we’re swing traders, so we wouldn’t keep the trade over the weekend and lastly we’ve traded enough to know the average volatilities for each pair.
Hope you found time to read this all as this will have a tremendous impact on your trading journey. All the best in 2022, family!

USD/JPYAfter 30 pips of moving the position towards our target, the market returned with a news reaction and the position stopped.
Of course, an experienced trader will never lose a profitable position
We hope you have benefited from this analysis, at least do not lose :)

UPDATE: CRO UP 470% after bull signal - What Next?Please Like or Follow if you enjoyed this content.
UPDATE: The price jumped 470+% after the bullish Supertrend Ninja signal in Oct 2021. And 275% in July 2021. The Supertrend Ninja also predicted the heavy drops of April 2021 and Dec 2021.
The price is ranging, which is visible from the sideways movement. RSI is in a range as well. Although CRO got a bullish signal from my indicator Supertrend Ninja. Right now the price is in the middle of two grey blocks. Supports and Resistances are highlighted as grey blocks. Next support around 0.48 USDT. Next resistance around 0.68 USDT.
Profits can be taken at each grey block. Supports and resistances are drawn using the indicator 'Yo Show Me Some Support - and Resistances'. Pun intended.
Thank you for reading.
Namasté 🙏
What Indicators Do I Use:
In the chart I am using my Supertrend Ninja indicator, which is a trend-following indicator (Green and red vertical line with arrows).
When the background of the candlestick closes green (vertical line) with an upwards pointing pink arrow. It indicates a possible bullish (up)trend.
With each trade proper risk management is essential. Either by using my script Trailing Stoploss Bottom Activation indicator, visible as grey dots below the candles. Which sends an alert, when current price goes below the previous candle low. Or using my Heikin Ashi Trailing Stoploss Activation, the indicator below with green and red blocks. Or third option, exit when the Supertrend Ninja indicator displays a vertical red line with a downwards pointing black arrow. Remember, the first stop(loss) is always the cheapest stop.
Disclaimer: Ideas are for entertainment purposes only. Not financial advice. Your own due diligence is highly advised before entering trades. Past performance is no guarantee of future returns.

IP | Falling Wedge Reversal| MFI Divergence | Elliott 4th Wave?IP | Thailand SET Market | Price Action Trading | Elliott Wave Tracing
Chart Pattern: entering Falling Wedge Reversal Pattern
Price Action: Downtrend area of consolidation
Entry Position: Buy on BREAKOUT of FALLING WEDGE
Indicator:
> MFI - Money Flow Divergence - Banker accumulation phase
> RSI - Sideway up below 50
> MACD - Golden cross below baseline 0
Trust SYSTEM & INDICATOR | Never panic trade
Trade affordable RISK | Ratio 3:1
Always respect STOP-LOSS
Good Luck

UPDATE: DOT UP 700% after bull signal - 300% more to come?Please Like or Follow if you enjoyed this content.
UPDATE: The price jumped 700+% after the bullish Supertrend Ninja signal. The Supertrend Ninja also predicted the drops of April 2021, May 2021 and Nov 2021. Using fibs. Price can go at least another 300% up, if this is the bottom. Although the Supertrend Ninja hasn't given a bull signal as of yet.
Supports and Resistances are highlighted as grey blocks. Next resistance around 39 USDT. Profits can be taken at each grey block. Supports and resistances are drawn using the indicator 'Yo Show Me Some Support - and Resistances'. Pun intended.
In the chart I am using the Supertrend Ninja indicator, which is a trend-following indicator (Green and red vertical line with arrows).
When the background of the candlestick closes green (vertical line) with an upwards pointing pink arrow. It indicates a possible bullish (up)trend.
With each trade proper risk management is essential. Either by using my script Trailing Stoploss Bottom Activation indicator, visible as grey dots below the candles. Which sends an alert, when current price goes below the previous candle low. Or using my Heikin Ashi Trailing Stoploss Activation, the indicator below with green and red blocks. Or third option, exit when the Supertrend Ninja indicator displays a vertical red line with a downwards pointing black arrow. Remember, the first stop(loss) is always the cheapest stop.
Thank you for reading.
Namasté
Disclaimer: Ideas are for entertainment purposes only. Not financial advice. Your own due diligence is highly advised before entering trades. Past performance is no guarantee of future returns.

UPDATE: Unicorn UP 908% after bull signal - now 25% correction?Please Like or Follow if you enjoyed this content.
UPDATE: The price jumped 908+% after the bullish Supertrend Ninja signal. Second 49% and third time 61%. The Supertrend Ninja predicted the drops of May 2021, July 2021 and Nov 2021. And is giving another potential drop signal 2 days ago.
Supports and Resistances are highlighted as grey blocks. Next support around 14 USDT. Which means a potential drop of 25%. Profits can be taken at each grey block (if shorting). Supports and resistances are drawn using the indicator 'Yo Show Me Some Support - and Resistances'. Pun intended.
In the chart I am using the Supertrend Ninja indicator, which is a trend-following indicator (Green and red vertical line with arrows).
When the background of the candlestick closes green (vertical line) with an upwards pointing pink arrow. It indicates a possible bullish (up)trend.
With each trade proper risk management is essential. Either by using my script Trailing Stoploss Bottom Activation indicator, visible as grey dots below the candles. Which sends an alert, when current price goes below the previous candle low. Or using my Heikin Ashi Trailing Stoploss Activation, the indicator below with green and red blocks. Or third option, exit when the Supertrend Ninja indicator displays a vertical red line with a downwards pointing black arrow. Remember, the first stop(loss) is always the cheapest stop.
Thank you for reading.
Namasté
Disclaimer: Ideas are for entertainment purposes only. Not financial advice. Your own due diligence is highly advised before entering trades. Past performance is no guarantee of future returns.

UPDATE: ETH UP 436% after bullish signal - 220% more to come?Please Like or Follow if you enjoyed this content.
UPDATE: The price jumped 436+% after the bullish Supertrend Ninja signal. Second time 134%. Third time 80%. Using fibs, are we in for another 220%? Target at 11300 USDT, if this is the bottom.
2022 hasn't shown a bullish signal yet for the Supertrend Ninja. Only a matter of time. Supports and Resistances are highlighted as grey blocks. Profits can be taken at each grey block.
In the chart I am using the Supertrend Ninja indicator, which is a trend-following indicator (Green and red vertical line with arrows).
When the background of the candlestick closes green (vertical line) with an upwards pointing pink arrow. It indicates a possible bullish (up)trend.
With each trade proper risk management is essential. Either by using my script Trailing Stoploss Bottom Activation indicator, visible as grey dots below the candles. Which sends an alert, when current price goes below the previous candle low. Or using my Heikin Ashi Trailing Stoploss Activation, the indicator below with green and red blocks. Or third option, exit when the Supertrend Ninja indicator displays a vertical red line with a downwards pointing black arrow. Remember, the first stop(loss) is always the cheapest stop.
Thank you for reading.
Namasté
Disclaimer: Ideas are for entertainment purposes only. Not financial advice. Your own due diligence is highly advised before entering trades. Past performance is no guarantee of future returns.

BTCUSD Price can easily pump if market respect last supports As we said before we expect a range market or even local pump here for bitcoin if the last support zone like 40K remains valid because below this support market can dump hard.
now as we can see price is near local support of 46K$ and if it remains valid we can expect a rise here like green arrows.
Notice: Strong support above 40K$ now is 44K that also mentioned on the chart so that is a good entry point too.
DISCLAIMER: ((trade based on your own decision ))
<>
💎 HAPPY NEW YEAR 💎

Bitcoin broke up falling wedge, Support: $45k-$42k, Target: $51k🚀🚀🚀🚀🚀 Bitcoin broke up falling wedge, Support: $45k-$42k, Target: $51k 🚀🚀🚀🚀🚀
Pattern: Falling wedge.
Status: Confirmed.
Entry: $46k-$45k.
Stop Loss: $42k.
Target: $51k.
☝️ 100% AI-generated TA. No humans. DYOR before trading!

UPDATE: LUNA UP 50% after bullish signal Please Like or Follow if you enjoyed this content.
UPDATE: The price jumped 50+% after bullish Supertrend Ninja signal. Combining this with the indicator Heikin Ashi Trailing Stoploss activition proves to be worth it again.
In the chart I am using the Supertrend Ninja indicator, which is a trend-following indicator (Green and red vertical line with arrows).
When the background of the candlestick closes green (vertical line) with an upwards pointing pink arrow. It indicates a possible bullish (up)trend.
With each trade proper risk management is essential. Either by using my script Trailing Stoploss Bottom Activation indicator, visible as grey dots below the candles. Which sends an alert, when current price goes below the previous candle low. Or using my Heikin Ashi Trailing Stoploss Activation, the indicator below with green and red blocks. Or third option, exit when the Supertrend Ninja indicator displays a vertical red line with a downwards pointing black arrow. Remember, the first stop(loss) is always the cheapest stop.
Thank you for reading.
Namasté
Disclaimer: Ideas are for entertainment purposes only. Not financial advice. Your own due diligence is highly advised before entering trades. Past performance is no guarantee of future returns.

Matic Trade Update. Time to Raise your Stop Loss. Matic has shown strong momentum gaining another 8% today breaking down her the resistance trend line we pointed out in yesterday’s video. Now the price has gone up a distance equal to the distance between the entry price and the stop loss price. The rule is, but when this happens, you raise your stop loss to the entry price. Now if the trade reverses and starts going against you, then at least you break even. Your new stop loss will exit you with no gain and no loss.
So, raise your stop loss to about $2.7 or where you entered. Cheers.

UPDATE: Rose UP 20% after bullish signal Please LIKE or FOLLOW if you like this idea.
UPDATE: The price jumped 20+% after bullish Supertrend Ninja signal.
In the chart I am using the Supertrend Ninja indicator, which is a trend-following indicator (Green and red vertical line with arrows).
When the background of the candlestick closes green (vertical line) with an upwards pointing pink arrow. It indicates a possible bullish (up)trend.
The Supertrend Ninja indicator formed its 7th bullish signal in 2021.
With each trade proper risk management is essential. Either by using my script Trailing Stoploss Bottom Activation indicator, visible as grey dots below the candles. Which sends an alert, when current price goes below the previous candle low. Or using my Heikin Ashi Trailing Stoploss Activation, the indicator below with green and red blocks. Or third option, exit when the Supertrend Ninja indicator displays a vertical red line with a downwards pointing black arrow. Remember, the first stop(loss) is always the cheapest stop.
Thank you for reading.
Namasté
Disclaimer: Ideas are for entertainment purposes only. Not financial advice. Your own due diligence is highly advised before entering trades. Past performance is no guarantee of future returns.


Analysis SHIB/USDT on 12H chart + Support and ResistancesPlease LIKE or FOLLOW if you like this idea.
RSI is moving towards 60, which is a bullish signal. Breaking RSI 70 is usually where it gets interesting. The Heikin Ashi indicator is also showing green blocks (indicator below). Which confirms we're in an uptrend.
Supports and resistances are drawn in grey blocks. Currently we are finding resistance from the Ichimoku Cloud. Moving above the cloud and finding support above 4500 is where it will be interesting.
In the chart I am using the Supertrend Ninja indicator, which is a trend-following indicator (Green and red vertical line with arrows).
When the background of the candlestick closes green (vertical line) with an upwards pointing pink arrow. It indicates a possible bullish (up)trend.
With each trade proper risk management is essential. Either I use my script Trailing Stoploss Bottom Activation indicator, visible as orange dots below the candles. Which sends an alert, when current price goes below the previous candle low. Or using my Heikin Ashi Trailing Stoploss Activation, the indicator below with green and red blocks. Or third option, exit when the Supertrend Ninja indicator displays a vertical red line with a downwards pointing black arrow. Remember, the first stop(loss) is always the cheapest stop.
Thank you for reading.
Namasté
Disclaimer: Ideas are for entertainment purposes only. Not financial advice. Your own due diligence is highly advised before entering trades. Past performance is no guarantee of future returns.

ROSE/USDT starting to look bullish.Please LIKE or FOLLOW if you like this idea.
RSI is moving towards 60, which is a bullish signal. The Heikin Ashi indicator is also showing green blocks (indicator below). Which also confirms we're in a possible uptrend.
In the chart I am using the Supertrend Ninja indicator, which is a trend-following indicator (Green and red vertical line with arrows).
When the background of the candlestick closes green (vertical line) with an upwards pointing pink arrow. It indicates a possible bullish (up)trend.
The Supertrend Ninja indicator is forming its 7th bullish signal in 2021.
With each trade proper risk management is essential. Either by using my script Trailing Stoploss Bottom Activation indicator, visible as orange dots below the candles. Which sends an alert, when current price goes below the previous candle low. Or using my Heikin Ashi Trailing Stoploss Activation, the indicator below with green and red blocks. Or third option, exit when the Supertrend Ninja indicator displays a vertical red line with a downwards pointing black arrow. Remember, the first stop(loss) is always the cheapest stop.
Thank you for reading.
Namasté
Disclaimer: Ideas are for entertainment purposes only. Not financial advice. Your own due diligence is highly advised before entering trades. Past performance is no guarantee of future returns.

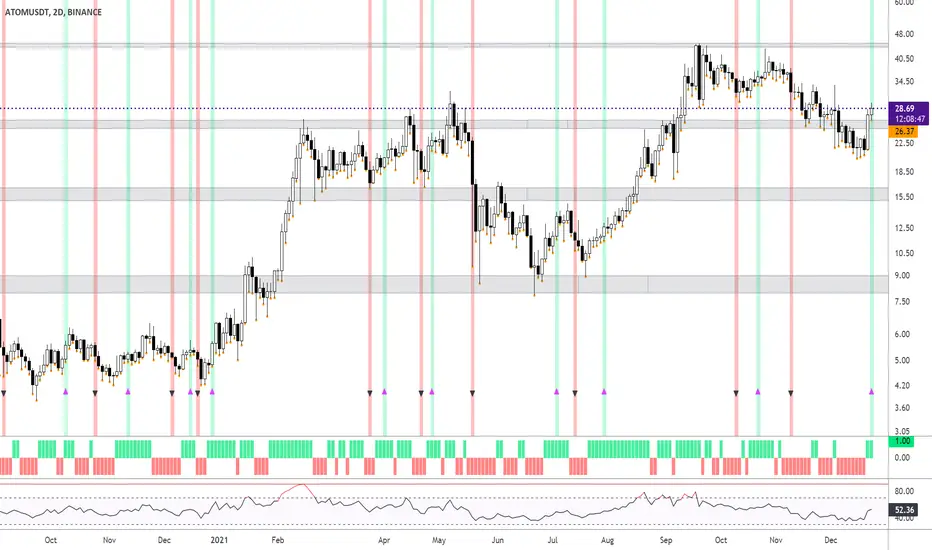
Analysis ATOM/USDT on 2Days chartPlease LIKE or FOLLOW if you like this idea.
RSI is above 50, which indicates a possible upmarket. The Heikin Ashi indicator is also showing green blocks (indicator below). Which also confirms we're most likely looking at a possible uptrend.
In the chart I am using the Supertrend Ninja indicator, which is a trend-following indicator (Green and red vertical line with arrows).
When the background of the candlestick closes green (vertical line) with an upwards pointing pink arrow. It indicates a possible bullish (up)trend.
The Supertrend Ninja indicator is forming its 7th bullish signal in 2021.
Supports and resistances are displayed in grey. With price finding support.
With each trade proper risk management is essential. Either by using my script Trailing Stoploss Bottom Activation indicator, visible as orange dots below the candles. Which sends an alert, when current price goes below the previous candle low. Or using my Heikin Ashi Trailing Stoploss Activation, the indicator below with green and red blocks. Or third option, exit when the Supertrend Ninja indicator displays a vertical red line with a downwards pointing black arrow. Remember, the first stop(loss) is always the cheapest stop.
Thank you for reading.
Namasté
Disclaimer: Ideas are for entertainment purposes only. Not financial advice. Your own due diligence is highly advised before entering trades. Past performance is no guarantee of future returns.
Analysis VET/USDT on Daily chartRSI is slowly moving towards 50, which indicates a possible upmarket. The Heikin Ashi indicator is also showing green blocks (indicator below). Which also confirms we're most likely looking at a possible uptrend.
In the chart I am using the Supertrend Ninja indicator, which is a trend-following indicator (Green and red vertical line with arrows).
When the background of the candlestick closes green (vertical line) with an upwards pointing pink arrow. It indicates a possible bullish (up)trend.
The Supertrend Ninja indicator is forming its 9th bullish signal for the 1 day chart in 2021. Six out of 9 signals, the price indeed went higher with a Monster Trend on March 2021.
Supports and resistances are displayed in grey. With below the price a strong support.
With each trade I make, proper risk management is essential. Either by using the Trailing Stoploss Bottom Activation indicator, visible as orange dots below the candles. Which sends an alert, when current price goes below the previous candle low. Or using the Heikin Ashi Trailing Stoploss Activation, the indicator below with green and red blocks. Or third option, exit when the Supertrend Ninja indicator displays a vertical red line with a downwards pointing black arrow. Remember, the first stop(loss) is always the cheapest stop.
Thank you for reading.
Namasté
Disclaimer: Ideas are for entertainment purposes only. Not financial advice. Your own due diligence is highly advised before entering trades.
Past performance is no guarantee of future returns.

How to detect a trend and trail an uptrend? How do I detect an uptrend?
In the chart BNB/USDT I am using the Supertrend Ninja indicator, which is a trend-following indicator (Green and red vertical line with arrows).
When the background of the candlestick closes green with an upwards pointing pink arrow. It indicates a possible bullish (up)trend.
The Supertrend Ninja indicator gave only 6 bullish signals for the 2 day chart in 2021. And 2 bullish signal in 2020. Which in my opinion makes each bullish signal very reliable.
It warned about the March 2020 and May 2021 (possible) corrections (big purple down arrows). And also the big uptrend of Dec 2020 (big blue up arrow).
How do I trail an uptrend?
With each trade I make, proper risk management is essential. Either by using the Trailing Stoploss Bottom Activation indicator, visible as orange dots below the candles. Which sends an alert, when current price goes below the previous candle low. Or using the Heikin Ashi Trailing Stoploss Activation, the indicator below with green and red blocks. Remember, the first stop(loss) is always the cheapest stop. Using one of these, or both offers me the possibility to ride bigger parts of the trend. Whichever triggers an alert first.
(For completeness, the grey blocks are supports and resistances)
Thank you for reading.
Namasté
Disclaimer: Ideas are for entertainment purposes only. Not financial advice. Your own due diligence is highly advised before entering trades.
Past performance is no guarantee of future returns.

Analysis EGLD/USDT on 2Days chartI was asked to chart EGLD /USDT. And how the Supertrend Ninja indicator performed on it since the listing.
Currently price is bouncing between support and resistance (2 grey blocks). Which makes/made EGLD ideal for a gridbot.
RSI is slowly moving towards 44, which means it is still in a range (displayed in the RSI as a yellow block). Right now as things stand it's not so interesting for trend traders. On the other hand volume is going down, which means a big move is likely to happen very soon. Before making any trades. I'll be waiting for confirmation from the Supertrend Ninja indicator showing some bullishness first. Ideally I would like to see some more green blocks on the Heikin Ashi indicator below as well.
In the chart I am using the Supertrend Ninja indicator, which is a trend-following indicator (Green and red vertical line with arrows).
When the background of the candlestick closes green with an upwards pointing pink arrow. It indicates a possible bullish (up)trend.
The Supertrend Ninja indicator gave only 4 bullish signals for the 2 day chart in 2021. And 1 bullish signal in 2020. Which in my opinion makes each bullish signal very reliable.
With each trade I make, proper risk management is essential. Either by using the Trailing Stoploss Bottom Activation indicator, visible as orange dots below the candles. Which sends an alert, when current price goes below the previous candle low. Or using the Heikin Ashi Trailing Stoploss Activation, the indicator below with green and red blocks. Remember, the first stop(loss) is always the cheapest stop.
Thank you for reading.
Namasté
Disclaimer: Ideas are for entertainment purposes only. Not financial advice. Your own due diligence is highly advised before entering trades.
Past performance is no guarantee of future returns.

SHIB/USDT bounced on support. Bullish?In the chart I am using the Supertrend Ninja indicator, which is a trend-following indicator.
When the background of the candlestick closes green with an upwards pointing pink arrow. It indicates a possible bullish (up)trend. I expect a signal within few days.
Price bounced on support (grey block). Which is a good sign.
The Supertrend Ninja indicator gave only 3 bullish signals for the 2 day chart in 2021. Including the monstertrend on 30th Sept. Entering on the blue arrow, and exit on the red down arrow (using Trailing Stoploss Bottom Activation indicator) made a whopping 250%. The Trailing Stoploss Bottom Activation, visible as orange dots below the candles. Sends an alert, when current price goes below the previous candle low (red horizontal line). This stoploss sell alert (using Tradingview webhook) worked great in combination with a bot. This happened on 14th Oct.
Heikin Ashi is showing green blocks in the indicator below as well. Which means an uptrend is likely. Also RSI is slowly moving towards 50, which is a bullish signal. SHIB looks done correcting. I'll be waiting for confirmation from the Supertrend Ninja indicator. Before entering any trades.
Namasté
Disclaimer: Ideas are for entertainment purposes only. Not financial advice. Your own due diligence is highly advised before entering trades.
Past performance is no guarantee of future returns.
