RSI overbought, pullback can be expectedRSI overbought --> 76
pullback is expected
entry price around 42, lower then current price for assurance
stop loss 45
take profit: 34 and 28
Stoploss

going long, RSI highly overboughtentry 4.85--> above current price for assurance
stop loss: 4.06
take profit: 6.90 and then also 10.70

How to set the RIGHT Stop loss!Hey hey traders!!
Setting the "right" stop loss is a vital skill, yet for many traders... its a random act. This video will help you find stcutrue in setting the right stop loss, a stop loss that has the best chance of not being hit and allowing your trade to workout!
For us that comes down to basics:
1. Use the ATR value
2. Enter only via the fibs (definite entry)
and by following this process we have achieved great things so far, even increased our win ration by a solid 12% in February (since we added it)
If you have questions, feel free to ask!
All the best and good luck trading!

DJI: Kill zone ahead - scary stuff! It's a kill zone. But note carefully there are losses here.
You can't win in this business unless you're prepared to lose! I would welcome arguments on that one.
The chart shows that the rebellion of price looks powerful but on the squeeze momentum assessment it isn't that powerful. Price movements tend to scare new traders. Well, okay - if you can't take the loss stay out.
In this position I cannot predict that price will fall nor can I predict that price will bust up and through the kill zone.
All I can do is take a loss - an affordable one. There is a natural bias for winning positions. Hence seemingly unlikely positions tend not to be shown.
When price moves north it is natural to think it will continue moving north. But what if the trend picture is showing probability for the south at the same time. Scary stuff!
Disclaimers : This is not advice or encouragement to trade securities on live accounts. Chart positions shown are not suggestions. No predictions and no guarantees supplied or implied. Heavy losses can be expected if trading live accounts. Any previous advantageous performance shown in other scenarios, is not indicative of future performance. If you make decisions based on opinion expressed here or on my profile and you lose your money, kindly sue yourself.

CHALLENGE: AUDJPY - PLACE YOUR BETSAhoy! There is money to be made and lost here! 🤦♂️😂
I'm short with with an affordable loss. Others may wish to go long with an affordable loss.
It's not about how right you are but how much you limit your loss if you're wrong.
This is a nice one for new traders to experiment with on a paper trading account. 👊
Trading is a strange activity i.e. you can't make money unless you're prepared to lose. 😟
Disclaimers : This is not advice or encouragement to trade securities on live accounts. Chart positions shown are not suggestions. No predictions and no guarantees supplied or implied. Heavy losses can be expected if trading live accounts. Any previous advantageous performance shown in other scenarios, is not indicative of future performance. If you make decisions based on opinion expressed here or on my profile and you lose your money, kindly sue yourself.

Entry Pricce ETH/USDT If u want Trade at 2 week period u can use this price for entry
manage ur risk
good luck

Entry Pricce BTC/USDT If u want Trade at 2 week period u can use this price for entry
manage ur risk
good luck

Is there stop loss hunting in trading ? How to deal with it ?Hello everyone:
Today I want to discuss a common discussion about new and experienced traders.
“Is there stop loss hunting in trading?”
Many wonder, since they can all recall the moment where price just hits their SL on a trade, and then the market quickly turns around towards their desired profit direction.
I want to dig deeper into this and explain it with different viewpoints, from a technical and psychological view.
The vision I am trying to provide is that, thinking about is there stop loss from the brokers won't help you to get better in trading.
It's a mindset thing we need to understand. For example, whether there is or isn't a stop loss hunting, it's nothing you or I can change or control. It is what it is.
However, if you understand this, then it's about adjusting your plan, strategies and trading style to these types of volatility moves and come up with the correct mindset to work around it.
Technical part:
More often, people set their SL and see their trades get taken out just a few pips above before reversing the opposite way.
Dig deeper into this. Is it a fake breakout, is it just being impatient and jumping the gun?
Is there LTF continuation/reversal correction that gives you bias to enter a long/short ?
Is your analysis aligned with the higher time frames ?
Many factors on why a trade is at a loss, no need to jump right into a conclusion that it's the broker who is stop hunting you.
This is why we always look for confirmation and confluence when we enter trades.
Just because the price breaks the support and resistance line people often use, it's not an automatic buy or sell.
Same goes with trend lines and other indicators people use.
We need to confirm it with price action. After an impulse phrase, was there a continuation correction phrase? If not, then it doesn't justify a buy entry.
This is also why we backtest so we see these types of price action often, and acknowledge what we need to do in order to work our ways around it.
Psychological part:
When traders take a loss in this way, hitting the SL and reverse, this creates a negative emotion in them.
They often get frustrated and upset, hence in human nature, we tend to blame others.
But take a step back and understand this:
The market can do whatever it wants to do.
Most beginner and newcomer traders think the market MUST follow their strategies and style. If it doesn't, then something is wrong with the market, the brokers, their mentor/coach, their strategies...etc.
This negative mindset needs to change.
First of all no strategies and style will promise you 100% strike rate and profit.
Any strategies you take will incur a loss, it's how you deal and manage it that will show you as a consistent or inconsistent trader.
Second, if you have experienced several losses due to the “Stop hunt” in your own mind, then instead of blaming the brokers or the markets, start looking into your trading plan and management.
Are you experiencing FOMO ? Are you over leverage trading, and revenge trading ? Are you taking into consideration your risk management ? Entry, SL/TP, how much to risk ? Is it consistent with your plan ?
These are the things you can control, rather than external factors which you can not. Adjust yourself.
Third, remove your negative emotion from your losses. Take it as a learning curve and experiences earned.
Then the next time you enter a trade, you will remember the lessons that were taught to you by the market.
This is why we journal our trades so we can look back at them and understand what we did.
I hope these few pointers will help some of you to get back on the positive direction of trading.
No need to think and get upset if there is a stop hunting of your trades. Instead, use that towards your advantages.
If you consistently see a false breakout and reverse, then come up with a strategy and plan to capture that reversal move.
No need to blame the market or the broker, that is something you can not control. Jumping brokers to brothers simply won't help you to eliminate that psychological mindset of a stop hunting.
I will put below several other educational videos on the topic we discussed today.
As always, any questions, comments or feedback welcome to let me know :)
Trading Plan:
Risk Management:
Trading Psychology:
FOMO:
Revenge Trading:
Over Leverage:

CRYPTO DAY TRADING STRATEGYCRYPTO DAY TRADING STRATEGY
1. Choose Coin with High Volatility & Liquidity
2. Use MFI Indicator on 5m or 15m chart
3. Wait for MFI to reach 100 Twice
4. Buy next 100 MFI & that candle closes bullish
5. Stop Loss below Low of Current Day
6. TP during first 60 minutes of trade


STOP LOSS MISTAKES THAT EVERY NEW TRADER DOES !1. Using Position Size Instead Of Technical Analysis To Determine Stoploss
Don't let your lot size determine your SL value. It should be the other way around. If you pick your entry using technical analysis, then you should do the same for your Stop loss.
2. Placing Stop loss Exactly On Support Or Resistance Levels
3. Placing Stop loss Depending On the Market Moves
4. Placing Very Tight Stop loss On Trades
If the stop loss is too far away, this may reduce your risk to reward ratio. If your stop loss is so close to entry, you will be stopped out easily.
5. Placing Stop loss Too Wide.
Always place stops where analysis is invalid.

Set your Stop-Loss, we're on a run to somewhere...Long position remains.
Confirmed, we are on a 4 day+ run.
XLM broke above our gold resistance line of $.40, which was the .702 Fib. BUT not only did it break above that, it also broke above the .786 Fib, which to me indicates that we are going to be on a slow climb to...possibly...a new high.
I'm setting my short position for the .786 FIB on the previous cycle.
Most importantly, because we are in a bull cycle, I'm placing my short position at 5% +/-. Just in case we break higher, I won't lose too much in my trading bag.
Please advise for further clarification.
Happy trading my friends.
NOT FINANCIAL ADVICE

Stop-Loss idea if you enter ETH soon. Long and ShortHere are 2 different stop-loss that could be used for Long or Short if you plan to enter a position soon.
ATR Stop-loss
Long = 1,610
Short = 1,873
High/low Stop-loss
Long = 1,408
Short = 1,760
I did not include the Pivot Stop-loss as Eth is currently breaking out of it.
Values are picked from our Stoploss Picker script
Whatever you do, always use a stop-loss when you trade!

Stop-Loss idea if you enter BTC soon. Long and ShortHere are 3 different stop-loss that could be used for Long or Short if you plan to enter a position soon.
ATR Stop-loss
Long = 36.007
Short = 39,913
High/low Stop-loss
Long = 34,333
Short = 38,708
Pivot Point Stop-loss
Long = 32,171
Short = 38,708
Values are picked from our Stoploss Picker script
Whatever you do, always use a stop-loss when you trade!

Stoploss EducationOne of strong topics i want to write about it for long time ago
TYPES OF STOPLOSS 🛑 :
MANUAL AND AUTOMATIC
FIRST / Manual Stoploss :
Trader wait for the candels to close below support for exit not just hit it !
Example for manual stoploss :
Most common using 15min - 1H - 4H - 1D - 1W candels closing below support area ..it can also used in alot of timeframes
Advantages Of Manual Stoploss :
– The best for investors and long term traders
– Best in spot and small leverage trading
– Coins didnt moved yet and still in accumulation phase
–Avoid manipulation by market makers ...alot of times market makers will try to hit stoploss by wick or flash drop then price get recover fast after,,
This move is very common in certain areas and push the weak hands outside of market by loss
SECOND / Automatic Stoploss :
Trader set Automatic stoploss in exchanges
Advantages Of Automatic Stoploss :
– Good for short term traders (fast food)
– Best in high leverage trading
– Coin pumped high in short time you follow your position by keep moving your stoploss continously
–good in high volatile coins
(example in these days : doge - xrp 😁)
For myself most of times i use the first one manual stoploss
What about you ...what do you prefer ?


AUDJPYConfluences:
- Strong support and resistance zone
- Looking to short with a target at the support line
- Lastly, remember the TREND is your FRIEND until it ends!
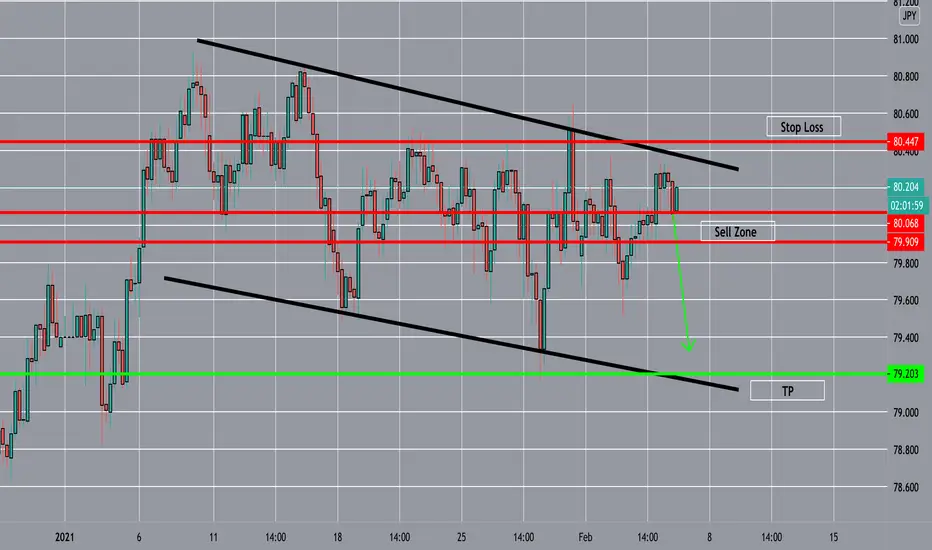
Chart PatternsSAVE THIS!This Educational Chart Pattern will help you everyday to see where the market can change direction,and when to place your order.
Where to place your entry,Tp and stop loss.
And before placing a order you need confirmation.
Please give a LIKE & COMMENT if you find this usefule!

long On BTCUSD If we break the open of the last High volume candle we get out of our long. Trade safe my friends!

I LOST 70% OF MY CAPITAL WITH THE SAME MISTAKE => OVERTRADINGHello Traders,
today I want show you a point of my live, that I constantly overlooked. I want sensitize you for it and also make me so a reminder for the future!
1. OVERTRADING
It's the truth: In the past I lost 70% of my capital with overtrading. If you find yourself there then I would be sensitize you to rethink your approach of trading.
On the chart above you can see how I take at the beginning all rules what I learned before:
Only 1% of my capital I choose for risk with using StoppLoss
Support and Resistance are STOPPLOSS and TAKEPROFIT, depence on trading direction
I choose a Takeprofit more then 2 times of my risk
=> I lost the most time with this rules
But the rules are not the problem!
The problem was my overtrading. I see only "ONE" signal to take action => then it overcomes to reaction buy, no no, sell... dame, better buy and so on => always if I was in loss I tried to rethink my trade 24/7 hours in front of the screen.
2. SUPPORT AND RESISTANCE: THE WORST ENTRY POINTS EVER, BUT GOOD STOPLOSS AND TAKEPROFIT AREAS
Another thing is, that support and resistance areas are good reverse moments. Every greedy trader like I used to be, try to catch the early trade to make more money than anyone can imagine. Then back to reality: you get stopped. The market takes your money and you don't realize why!
On this moment, you have your own opinion of the market and this your mistake to believe you are right. You hadn't wait enough!
3. BE PATIENCE - TRADE LATE AND RIGHT THEN EARLY AND WRONG (MULTIPLE)
The headline above in point 3. is since my realizing the importast rule. Trade late and right!
Because the other thing of trading you can: the right risk, the winning opportunity.
Sometimes it helps to look in deeper timeframes, to get enough win-risk-ratio.
Hopefully it helps you!
Kind regards
NXT2017

BITCOIN: Possible 2H trend resumptionThe chart focuses on the 2H ATR trend line. Bitcoin was in a 2H uptrend. The trend weakened and corrected in a 2H pattern. Now it seems to be resuming.
The position is ripe for a short with a reasonable stop-loss, at your own risk. If you cannot take the loss, do not enter!
This is a true trend following setup. No targets are possible. Stops are somewhere above the ATR line.
Disclaimers : This is not advice or encouragement to trade securities on live accounts. Chart positions shown are not suggestions. No predictions and no guarantees supplied or implied. Heavy losses can be expected if trading live accounts. Any previous advantageous performance shown in other scenarios, is not indicative of future performance. If you make decisions based on opinion expressed here or on my profile and you lose your money, kindly sue yourself.


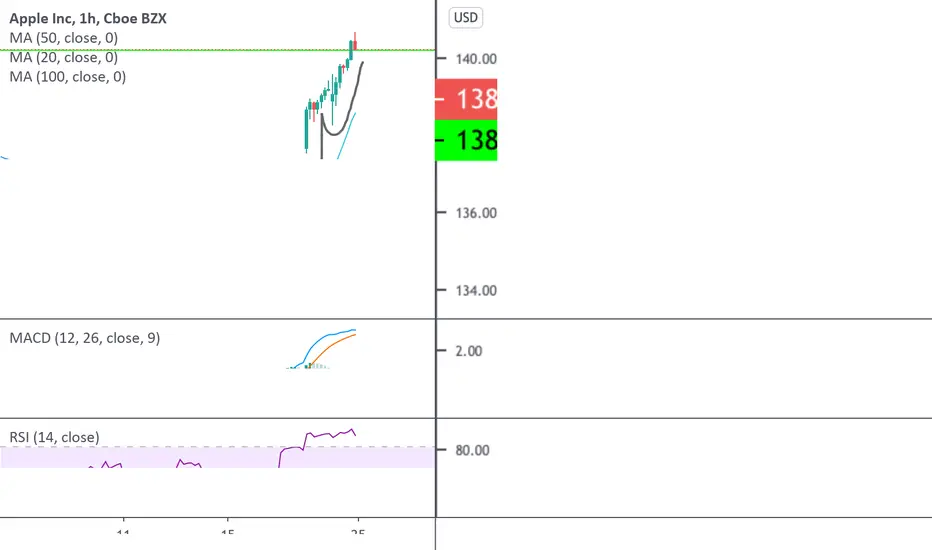
AAPL will break-out on earnings; cup & handleA cup and handle formation has formed. Apple is due for a break-out. Not only is the cup-&-handle forming, but the stock has already contended with it's most recent high. More often than not, a stock will blast through previous resistance if it has already been tested and rejected once; as Apple has.
Go long AAPL. Earnings will make it pop.
Stop loss: $125.00
Buy under: $140.00
Sell half after it hits $155
With the new turmoil at IBM and Intel, the M1 chip is even more significant now than ever; especially with most automakers having backorders for their semiconductor chips needed for a car. Even though Apple does not specialize in this if they can execute better than the generational chip companies, then they will most likely be the first choice for any other chip project based on AAPL's superiority & reliability.
The stock should easily reach $150, and most likely carry on once the momentum traders tag along. I see a final selling price target of roughly $175. It should hit major resistance if it blows past $150/160.