A simple setup.SETUP:
When you have a good setup, signal bars aren't that important.
In this picture, you see BTCUSD is in an uptrend: higher highs and higher lows. price is in a channel. when it hits the bottom of the channel, you can buy even with a weak signal bar. (I say weak because it has a relatively long up tail. tails on top of candle mean bears are forcing a selling pressure.)
STOP LOSS:
So, where do you put your stop loss? Remember, stop loss is placed at a level that if the price reaches that level your analysis will be invalid.
What's our reason for buying? an UPTREND.
What's the characteristic of an uptrend? higher highs and higher lows.
When price discredit your reason? when it descends below the last low. then you'll have a lower low and the price is either starting a downtrend or a trading range.
Thank you for reading this. Write your opinion in the comments.
Stoploss

ETHEREUM will FALL from resistance!
ETHUSD is treading along the rising resistance
Once it hits horizontal resistance too,
It will fall
Sell from resistance!
Like, comment and subscribe to boost your trading!
See other ideas below too!

YFII We Have OpeningI Think We have an Opening on YFII due to BTC.D and our wonderful ALT Party..
Buy At: 1700 - 1750
Target 1 At: 2240
Target 2 At: 2419
Target 3 At: 2648
Stop-Loss At: 1555
This is My idea.. What do you think??

ALT Party Coming?BTC.D Daily charts reached to top as I told you on other idea linked below..
If TODAYS's candle closes below 64.7 that means the rejection price action for the bull move on BTC.D and I'll open positions on Strong Alt-Coins..
Something really important that you shouldn't forget on these important US elections.. that the market is under the influence of strong fundamental news.. So I strongly recommend you if you want to open positions even on Bitcoin or ALTs.. Please consider your STOP-LOSS close to where you open your position.. this will protect you from fundamental news that will suddenly dump the price..
This is my idea.. What do you think..

EURUSD on strong resistance. Will start falling. Swing short.
EURUSD is reaching supply zone where many will be closing longs and opening shorts
So the price will start falling
Sell where the price reaches resistance line
Like, comment and subscribe to grow as a trader!
See fresh ideas below too!

RISK 2 REWARD ratio is the key I know almost every trader has asked themselves these questions:
How come I keep losing?!
WHY?!
Why do I keep getting stopped out?!
Why is it taking so long? !
Is it even possible?! !!!!!!!!!!!!!!!!!!!!!!!!!!!!!!!
Today I have some good news for you maybe you already know this maybe you don't, but this is for those folks who do not know the power of a good Risk to Reward ratio.
Let me tell something real quick you do not have a 80% winning rate not 70% I am going to say not even a 50% winning rate to be profitable ( Hold ON A MINUTE man HOLD the bus man... serious) dead serious.
With a risk to reward ratio of 1:2.5 you only need to win 30% of your trades to be profitable ( see below )
SAY YOU execute 10 trades and you only win 3 so essentially 30%
LOST:7 WON:3
Total loss: Total profit:
7 * 1 = 7 3 *2.5 = 7.5
Total profit - Total loss = +0.5
Now even though 0.5 is not a lot at least it's not a loss.
But there are a few things extra to keep in mind :
1) Your risk to reward has to stay the same for the period of the 10 trades
2) Your lot size needs to stay the same
3) AND as possible try to keep the amount of pips the same for your ratio because it does not help if you win 3 trades and you decided to set one of your positions SL as 100 pips and its TP as 250 pips and the rest of the positions SL as 20 pips and TP as 50 pips. If you lose the the big trade and hit the SL of a 100 pips its gonna through everything out of wack. So be sure to try and keep everything as consistent as possible and it will be a matter of time before you see profits.
Trade with H

It's not a bird. It's not a plane! It's a channel.
Nobody really knows for sure why channels develop. There are loads of theories. I'm not interested.
A channel is usually discovered late, obviously because the channel is evolving and then you see it. Unbelievable as it is, it is there.
So what do you do. Well, I don't give advice. What I do is understand that there may be limited opportunity to exploit. I say limited because when late in the game, price can break up out of the channel or down out of the channel. That means that if price approaches either end of the channel, it is a critical time.
All one can do is take the loss! It's called a stop loss.
Channels also do strange things like break out and then go madly the other way. If everybody had a magic formula how to work them, everybody would be zillionaires. It ain' t happening!
But there is still money to be made by following microtrends. That's where you follow small trends from 3 min to 15 min. These can take days to play out.
For newcomers it's not a good idea to work blindly in a channel. Find other indicators to assist.
Experience is also an important thing. As I always say blowing up 10 Tradingview paper trading accounts is far better than blowing up one live account. Get the safe experience almost totally for FREE!

Probabilities on USTECHSeasoned traders will know the influence USTECH has on world stock indices and several forex pairs.
I'm seeing something that I did not quite expect. I stick my neck out. But note that this market is not a true market. How? It is well known that it is artificially inflated by the influence of a powerful body called the FED. If you don't know the FED, stop trading now.
I show two paths based on 'theory of curves' and what I would normally expect. I am there to be proved wrong by the markets - all the time.
Newbies focus on being right, and how right they are. Seasoned traders embrace being wrong, and limiting how wrong they are. Yep - that's a very big difference.
So - we'll have to wait and see what happens next. No choice.

Entry Strategies using Support & Resistance ZonesBrief video tutorial discussing entry strategies using support and resistance zones. How I produce support & Resistance zones can be learnt from the live stream recording HERE
With any trading indicator, it is vitally important to have a sensible entry strategy with entry, stop loss and enough risk to reward to the next support or resistance zone. It is also as important not to fudge your entry and stop to give a decent risk to reward. Frame your charts first with Support & resistance zone, put on your stop and your entry. Then the last thing to do is put on your risk to reward. I cover this in this video and show you how to use the Fibonacci extension tool to work out your risk to reward

$JLG:ASX - Johns Lyng Group - New Highs Through ResistanceJohn Lyng is an old favourite in the building industry. Now it is through that resistance area, could have a bit of momentum behind it looking at some of the other indicators.
Nice couple of breaks on the bollinger with volume. Could be worth a watch.

Demo: SuperTrail - 5 minute candle and 5% trail on a 1500% stockCouple of people have asked if they can use the SuperTrail indicator to day trade and the answer is yes so figured I'd make this video showing how it would work on a smaller time frame on a more volatile stock.

PM8:ASX - PENSANA RARE EARTHS - Up 580% YTDPensana is looking to become the world’s newest and first sustainable supplier of critical magnet metal rare earths. With backing from the Angola government and pressure around the world to find sources outside of China for rare earth minerals, Pensana could be worth a watch.
About Pensana Rare Earths Plc
Pensana is a rapidly growing sustainable resources company with shares trading on the London Stock Exchange’s Main Market for listed securities (PRE:LSE) and on the Australian Stock Exchange (PM8:ASX).
Pensana is looking to bring online the world’s first major rare earth mine for over a decade at a time of burgeoning demand for critical magnet metals from electric vehicles and offshore wind turbines. It is looking to develop its Longonjo project, one of the world’s largest magnet metal rare earth deposits, located in infrastructure rich Angola, as a major new sustainable supply of rare earths critical to a range of industries and technologies that are vital to the green economy and to supporting the global Energy Transition to a lower carbon future.
As the Angolan government continues to diversify its economy away from oil and gas and diamonds and to develop its agriculture, tourism and mining sectors, Longonjo is the flagship mining project and is receiving strong support both within the community and from government at all levels. The Company has ongoing consultation with the local community and elected authorities and is working closely with them to ensure that the benefits of the project in terms of training, jobs and broad community support meet the aspirations of as many stakeholders as possible. As the Company continues on its path to building one of the world’s lowest carbon footprint mines it also strives to be a trusted partner for its employees, stakeholders and the communities where it operates.
The Pensana team is particularly passionate about developing young Angolan professionals, especially women in STEM, engaging responsibly with the environment and broad social engagement with the local community. Across the Company, at every level, the Pensana team is committed to sustainable value creation and to the advancement of the UN Sustainable Development Goals. The project is being planned to the highest ESG standards and the Company is conducting a detailed assessment of the appropriate international ESG standards, initiatives and reporting frameworks to adopt to ensure the Company remains best in class as the project moves into the development phase.
With Presidential approval for the mining licence and strong financial backing from FSDEA the Angolan Sovereign Wealth Fund which now holds a 23% stake in the company, Pensana is in a strong position to bring the project online as the world’s first sustainable supplier of critical magnet metal rare earths.
Source: Pensana Corporate News


USTECH: Can you take the loss?Nobody except me talks openly about losses. So here I go again: can you take the loss?
USTECH is at a nice position. You absolutely cannot 'know' what it will do. All gurus who make predictions are wrong. They cannot and do not own the future. I never make predicitions.
It's either the loss is affordable, in order to gain or it isn't.
The markets are there to surprise us and make fools of us. The main thing we can control is how stupid the markets aim to make us out to be.
Disclaimers : This is not advice or encouragement to trade securities. Chart positions shown are not suggestions. No predictions and no guarantees supplied or implied. Heavy losses can be expected. Any previous advantageous performance shown in other scenarios, is not indicative of future performance. If you make decisions based on opinion expressed here or on my profile and you lose your money, kindly sue yourself.

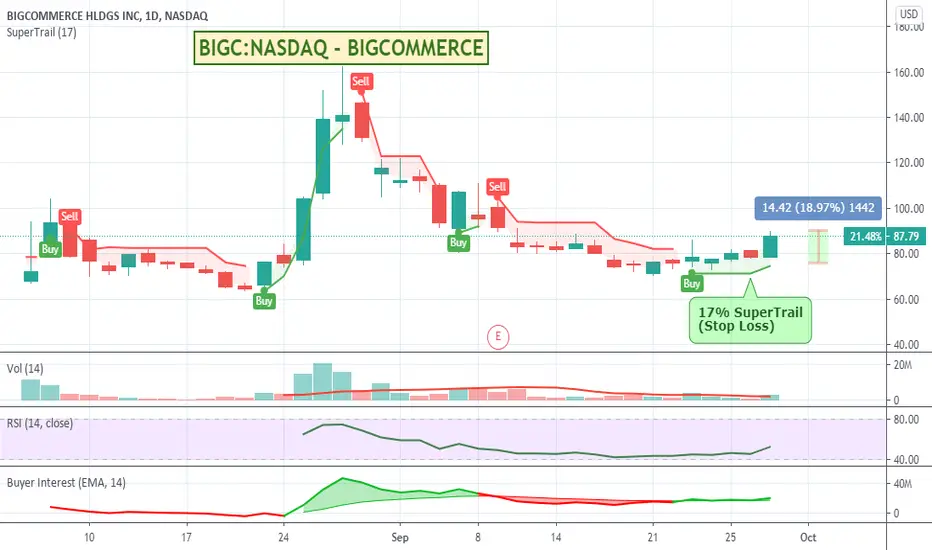
BIGC:NASDAQ - BIGCOMMERCE - Rallying off the bottom ?Biocommerce's time on the exchange has been very underwhelming especially when you compare it to Shopify and its meteoric rise. It has started to make a move off the bottom so could be worth a watch.
AUDJPY (8H): Opportunity for a controlled lossYep - nobody likes to hear about losses. But there is no way to gain in the markets without taking the risk of loss. Can you afford it? If not leave it alone.
See:
1 - zone of congestion.
2 - near fib 50%
3 - near ATR on 8h.
Disclaimers : This is not advice or encouragement to trade securities. Chart positions shown are not suggestions. No predictions and no guarantees supplied or implied. Heavy losses can be expected. Any previous advantageous performance shown in other scenarios, is not indicative of future performance. If you make decisions based on opinion expressed here or on my profile and you lose your money, kindly sue yourself.

Always use Stop loss to control RiskHi guys today will be showing you how helpful a stop loss is
Stop loss are design to be you ultimate last defence if your trade will not work.
Also it controls your emotions and your money to stop them bleeding
Stoploss is a very important tool for us traders to either preserve our capital or have a gain in the market
ALWAYS EXPECT FOR THE WORST TO COME ESPECIALLY IN THIS MARKET
happy trading and keep improving traders
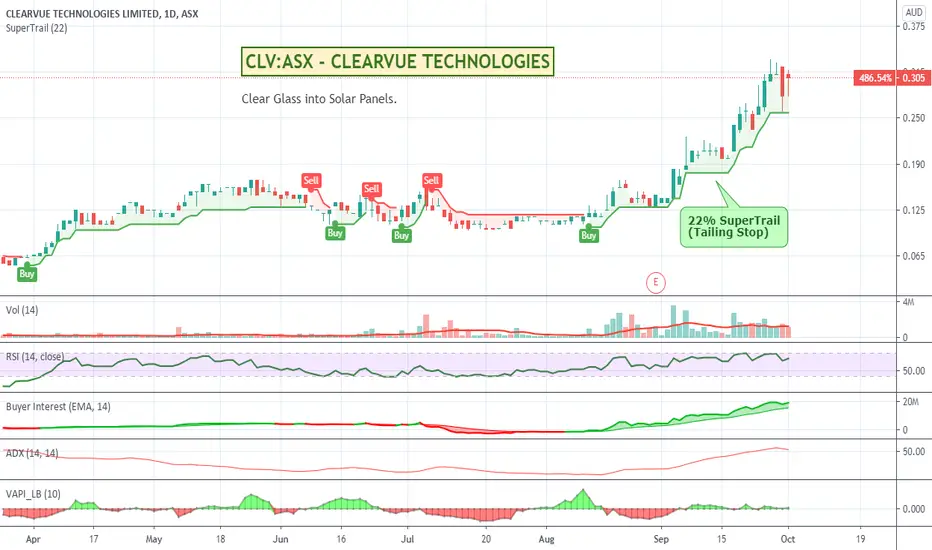
CLV:ASX - CLEARVUE TECHNOLOGIES - Glass into Solar PanelsI like the idea that ClearVue Technologies produces clear glass that generates electricity as well as that they are happy to grow their business through licencing and royalty payments (I've been watching too much of Kevin O'Leary aka Mr Wonderful on Shark Tank). Looking at all the sky scrapers and buildings in modern cities you know at some stage they will all become giant solar arrays. Up just under 500% since their March lows, but still a long way way from their previous all time highs I like the idea. They just need some more sales on the board. Could be worth a watch.
PFT:ASX - PURE FOODS TASMANIA - 500% run last 3 monthsPure Foods Tasmania produces and wholesales pate and smoked salmon & trout fish products. The stock has had a nice and steady rise in price over the last 3 months. Worth a watch.

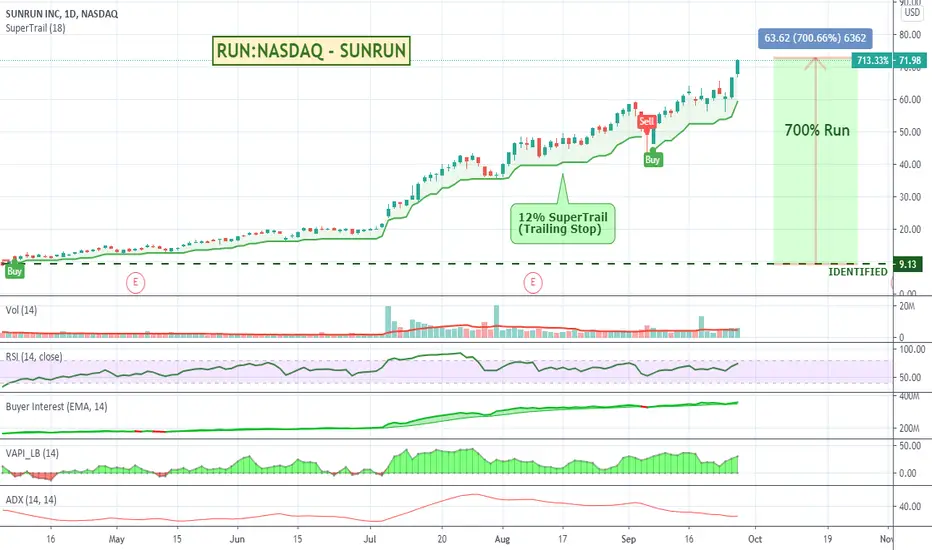
RUN:NASDAQ - SUNRUN - Residential Solar with a 700% run so farSunRun is one of the leading residential solar, battery storage, and energy services company in the United States and their stock has been on a nice and steady run since the March lows up around some 700%. I will probably wait for a bit of a pullback before an entry, but certainly worth a watch.


ACER:NASDAQ - ACER THERAPEUTICS - Bolly Breakout.ACER had a nice move overnight on the back of a few days of rallying. Still around 70% to get back to old highs so has some good wiggle room above current levels. Could be worth a look.
