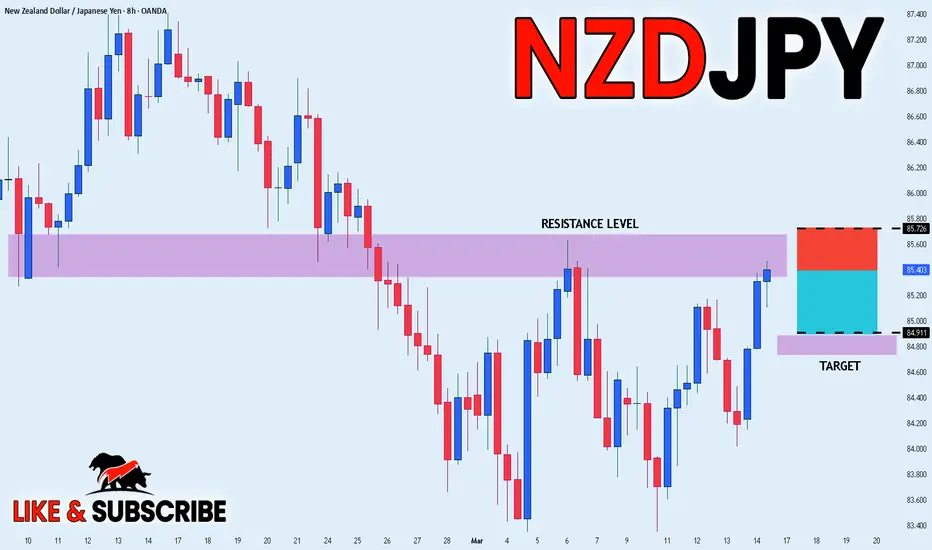
NZD_JPY SHORT SIGNAL|
✅EUR_USD has been growing recently
And the pair seems locally overbought
So as the pair is approaching a horizontal resistance of 85.6800
We can enter a short trade
At 85.3890 with the Target of 84.9110
And the Stop Loss of 85.7260
Just above the resistance
SHORT🔥
✅Like and subscribe to never miss a new idea!✅
Stoploss
GBP-USD Bearish Breakout! Sell Limit!
Hello,Traders!
GBP-USD was trading in an
Uptrend and the pair was locally
Overbought so as we are seeing
A bearish breakout we are
Locally bearish biased
And we can set a Sell Limit
Order at 1.8649 with the
Target being 1.8465
And the Stop Loss at 1.8773
Slightly above the local high
Sell!
Comment and subscribe to help us grow!
Check out other forecasts below too!
Disclosure: I am part of Trade Nation's Influencer program and receive a monthly fee for using their TradingView charts in my analysis.

BNB/USDT 1DHello everyone, let's look at the 1D BNB chart to USDT, in this situation we can see how the price moves in the local triangle in which we approach the moment we leave and try to take the direction of further movement.
However, let's start by defining goals for the near future the price must face:
T1 = $ 595
T2 = $ 649
Т3 = 690 $.
T4 = $ 738
Let's go to Stop-Loss now in case of further declines on the market:
SL1 = $ 562
SL2 = $ 527
SL3 = = $ 474
SL4 = 436 $
Looking at the MACD indicator, you can see the traffic in the downward trend, but here you can see an attempt to change the direction and after

GBPUSD Week 11 Swing Zone/LevelsLast week marked the first losing week of the year.
With a strong upward trend, a price pullback is expected.
By using tight stop losses and effective trade management, we keep losses small while aiming for larger gains. To achieve this, the stop loss is moved to break even once the price gains 20 pips.
a or b? Only price can tell

Behind the Buy&Sell Strategy: What It Is and How It WorksWhat is a Buy&Sell Strategy?
A Buy&Sell trading strategy involves buying and selling financial instruments with the goal of profiting from short- or medium-term price fluctuations. Traders who adopt this strategy typically take long positions, aiming for upward profit opportunities. This strategy involves opening only one trade at a time, unlike more complex strategies that may use multiple orders, hedging, or simultaneous long and short positions. Its management is simple, making it suitable for less experienced traders or those who prefer a more controlled approach.
Typical Structure of a Buy&Sell Strategy
A Buy&Sell strategy consists of two key elements:
1) Entry Condition
Entry conditions can be single or multiple, involving the use of one or more technical indicators such as RSI, SMA, EMA, Stochastic, Supertrend, etc.
Classic examples include:
Moving average crossover
Resistance breakout
Entry on RSI oversold conditions
Bullish MACD crossover
Retracement to the 50% or 61.8% Fibonacci levels
Candlestick pattern signals
2) Exit Condition
The most common exit management methods for a long trade in a Buy&Sell strategy fall into three categories:
Take Profit & Stop Loss
Exit based on opposite entry conditions
Percentage on equity
Practical Example of a Buy&Sell Strategy
Entry Condition: Bearish RSI crossover below the 30 level (RSI oversold entry).
Exit Conditions: Take profit, stop loss, or percentage-based exit on the opening price.

ETC/USDT 1D chart reviewHello everyone, let's look at the 1D chart etc to USDT, in this situation we can see how the price moves in a slight side trend in which you can see the output sideways from the downward trend line.
However, let's start by defining goals for the near future the price must face:
T1 = 22.25 $
T2 = = $ 25.63
Т3 = 28.48 $
T4 = 31.06 $
Let's go to Stop-Loss now in case of further declines on the market:
SL1 = 19.04 $
However, you can still see a strong support zone that strongly maintains the price from a larger decline zone from $ 17.11 to $ 15.82.
Looking at the RSI indicator, you can see a return to the center of the range despite slight price movements on the chart, however, there is still room for a potential new growth movement.

How to Spot a Reversal Before It Happens (Before Your SL Hits)You know the feeling. You’re confidently riding a winning trend, high on the euphoria of green candles, when—BAM—the market flips faster than a politician in an election year. Your once-perfect trade is now a humiliating red mess, and your stop loss is the only thing standing between you and financial pain.
But what if you could see that reversal coming before it smacks you in the face? What if, instead of watching your profits evaporate, you could exit like a pro—or better yet, flip your position and ride the reversal in the other direction?
Reversals don’t happen out of thin air. The signs are always there—you just have to know where to look. In this idea, we break down how to spot reversals before they happen.
😉 Price Action: The Market’s Way of Dropping Hints
Markets don’t just change direction because they feel like it. Reversals happen when sentiment shifts—when buyers and sellers agree, sometimes all at once, that the current trend has run its course.
The first clue? Price action itself.
Look for hesitation. A strong uptrend should be making higher highs and higher lows. A downtrend should be carving out lower lows and lower highs. But what happens when that rhythm starts breaking?
A higher high forms, but the next low dips below the previous one? Warning sign.
Price approaches a key resistance level, but momentum stalls, and candles start looking indecisive? Caution flag.
A massive engulfing candle wipes out the last three sessions? Somebody just hit the eject button.
Before markets reverse, they throw up some red flags first—and depending on your time frame, these red flags can give you a heads up so you can prepare for what’s coming.
🔑 Divergence: When Your Indicators Are Screaming "Lies!"
Indicators might be lagging, but they’re not useless—especially when they start disagreeing with price.
This is where divergence comes in. If the price is making new highs, but your favorite momentum indicator (RSI, MACD, Stochastic—you name it) isn’t? That’s a major warning sign.
Bearish Divergence: Price makes a higher high, but RSI or MACD makes a lower high. Translation? The momentum behind the move is fizzling out.
Bullish Divergence: Price makes a lower low, but RSI or MACD makes a higher low. Translation? Sellers are losing their grip, and a bounce might be coming.
Divergences don’t mean immediate reversals, but they do suggest that something’s off. And when the market starts whispering, it’s best to listen before it starts shouting.
📍 Volume: Who’s Actually Driving the Move?
A trend without volume is like a car running on fumes—it’s only a matter of time before it stalls.
One of the clearest signs of a potential reversal is a divergence between price and volume.
If price is pushing higher, but volume is drying up? Buyers are getting exhausted.
If price is tanking, but selling volume isn’t increasing? The bears might be running out of steam.
If a major support or resistance level gets tested with huge volume and a violent rejection? That’s not a coincidence—it’s a battle, and one side is losing.
Reversals tend to be violent because traders are caught off guard. Watching the volume can help you avoid being one of them.
📊 Key Levels: Where the Market Loves to Reverse
Price doesn’t move in a vacuum. There are levels where reversals love to happen.
Support and Resistance: The most obvious, yet most ignored. When price approaches a level that’s been historically respected, pay attention.
Fibonacci Retracements: Markets are weirdly obsessed with 38.2%, 50%, and 61.8% retracement levels. If a trend starts stalling near these zones, don’t ignore it.
Psychological Numbers: Round numbers (like 1.2000 in Forex , $500 in stocks , or $120,000 in Bitcoin BITSTAMP:BTCUSD act like magnets. The more traders fixate on them, the more likely they become reversal points.
Smart money isn’t chasing prices randomly. They’re watching these levels—and if you’re not, you might consider doing it.
🚨 Candlestick Warnings: When the Market Paints a Picture
Candlesticks aren’t just pretty chart elements that give you a sense of thrill—they tell stories. Some of them hint at “reversal.”
Doji: The ultimate indecision candle. If one pops up after a strong trend, the market is questioning itself.
Engulfing Candles: A single candle that completely erases the previous one? That’s power shifting sides.
Pin Bars (Hammer/Inverted Hammer, Shooting Star): Long wicks show rejection. When they appear at key levels, reversals often follow.
Candlestick patterns alone aren’t enough, but when they show up alongside other reversal signals, they’re hard to ignore.
📰 The News Factor: When Fundamentals Crash the Party
Technical traders like to pretend breaking news doesn’t matter—until it does.
Earnings reports , economic data , interest rate decisions ECONOMICS:USINTR —these events can turn a strong trend into a dumpster fire instantly.
A stock making all-time highs right before earnings? Tread carefully.
A currency pair trending up before an inflation report? One bad number, and it’s lights out.
A crypto rally before a major regulation announcement? That could end badly.
Reversals don’t always come from charts alone. Sometimes, they come from the real world. And the market rarely gives second chances.
✨ The Reversal Cheat Sheet: When Everything Aligns
A single signal doesn’t guarantee a reversal. But when multiple factors line up? That’s when you need to take action.
If you see:
✅ Divergence on indicators
✅ Volume drying up or spiking at a key level
✅ A major support/resistance level getting tested
✅ Reversal candlestick patterns forming
✅ News lurking in the background
Then congratulations—you’ve likely spotted a reversal before your stop loss takes the hit.
✍ Conclusion: Stay Ahead, Not Behind
Catching reversals before they happen isn’t magic—it’s just about knowing where to look. Price action, volume, key levels, indicators, and even the news all leave clues. The problem? Most traders only see them after their account takes the hit.
Don’t be most traders. Pay attention, recognize the signs, and act before the market flips the script on you.
Because the best time to spot a reversal? Before it happens.
Do you use any of these strategies to spot reversals in your trading? What’s the last time you did it and what were you trading—forex, crypto, stocks or something else? Let us know in the comments!

Will SOL start growing now that Trump has announced the reserve?Hi everyone, let's look at the 1D SOL to USD chart, in this situation we can see how the price is moving in an ascending channel where it is currently struggling to stay in the lower part of the channel.
Let's start by defining the targets for the near future that the price has to face:
T1 = 172.96 USD
T2 = 202.57 USD
Т3 = 223.84 USD
Т4 = 250.58 USD
Now let's move on to the stop-loss in case the market continues to fall:
SL1 = 139.90 USD
SL2 = 114.89 USD
SL3 = 94.76 USD
SL4 = 74.35 USD
It is worth looking at the MACD indicator where we can see how low we have gone much lower than during the previous declines, which could potentially indicate that the price will try to go up if the ongoing bullish trend is maintained.

Effective inefficiencyStop-Loss. This combination of words sounds like a magic spell for impatient investors. It's really challenging to watch your account get smaller and smaller. That's why people came up with this magic amulet. Go to the market, don't be afraid, just put it on. Let your profits run, but limit your losses - place a Stop-Loss order.
Its design is simple: when the paper loss reaches the amount agreed upon with you in advance, your position will be closed. The paper loss will become real. And here I have a question: “ Does this invention stop the loss? ” It seems that on the contrary - you take it with you. Then it is not a Stop-Loss, but a Take-Loss. This will be more honest, but let's continue with the classic name.
Another thing that always bothered me was that everyone has their own Stop-Loss. For example, if a company shows a loss, I can find out about it from the reports. Its meaning is the same for everyone and does not depend on those who look at it. With Stop-Loss, it's different. As many people as there are Stop-Losses. There is a lot of subjectivity in it.
For adherents of fundamental analysis, all this looks very strange. I cannot agree that I spent time researching a company, became convinced of the strength of its business, and then simply quoted a price at which I would lock in my loss. I don't think Benjamin Graham would approve either. He knew better than anyone that the market loved to show off its madness when it came to stock prices. So Stop-Loss is part of this madness?
Not quite so. There are many strategies that do not rely on fundamental analysis. They live by their own principles, where Stop-Loss plays a key role. Based on its size relative to the expected profit, these strategies can be divided into three types.
Stop-Loss is approximately equal to the expected profit size
This includes high-frequency strategies of traders who make numerous trades during the day. These can be manual or automated operations. Here we are talking about the advantages that a trader seeks to gain, thanks to modern technical means, complex calculations or simply intuition. In such strategies, it is critical to have favorable commission conditions so as not to give up all the profits to maintaining the infrastructure. The size of profit and loss per trade is approximately equal and insignificant in relation to the size of the account. The main expectation of a trader is to make more positive trades than negative ones.
Stop-Loss is several times less than the expected profit
The second type includes strategies based on technical analysis. The number of transactions here is significantly less than in the strategies of the first type. The idea is to open an interesting position that will show enough profit to cover several losses. This could be trading using chart patterns, wave analysis, candlestick analysis. You can also add buyers of classic options here.
Stop-Loss is an order of magnitude greater than the expected profit
The third type includes arbitrage strategies, selling volatility. The idea behind such strategies is to generate a constant, close to fixed, income due to statistically stable patterns or extreme price differences. But there is also a downside to the coin - a significant Stop-Loss size. If the system breaks down, the resulting loss can cover all the earned profit at once. It's like a deposit in a dodgy bank - the interest rate is great, but there's also a risk of bankruptcy.
Reflecting on these three groups, I formulated the following postulate: “ In an efficient market, the most efficient strategies will show a zero financial result with a pre-determined profit to loss ratio ”.
Let's take this postulate apart piece by piece. What does efficient market mean? It is a stock market where most participants instantly receive information about the assets in question and immediately decide to place, cancel or modify their order. In other words, in such a market, there is no lag between the appearance of information and the reaction to it. It should be said that thanks to the development of telecommunications and information technologies, modern stock markets have significantly improved their efficiency and continue to do so.
What is an effective strategy ? This is a strategy that does not bring losses.
Profit to loss ratio is the result of profitable trades divided by the result of losing trades in the chosen strategy, considering commissions.
So, according to the postulate, one can know in advance what this ratio will be for the most effective strategy in an effective market. In this case, the financial result for any such strategy will be zero.
The formula for calculating the profit to loss ratio according to the postulate:
Profit : Loss ratio = %L / (100% - %L)
Where %L is the percentage of losing trades in the strategy.
Below is a graph of the different ratios of the most efficient strategy in an efficient market.
For example, if your strategy has 60% losing trades, then with a profit to loss ratio of 1.5:1, your financial result will be zero. In this example, to start making money, you need to either reduce the percentage of losing trades (<60%) with a ratio of 1.5:1, or increase the ratio (>1.5), while maintaining the percentage of losing trades (60%). With such improvements, your point will be below the orange line - this is the inefficient market space. In this zone, it is not about your strategy becoming more efficient, you have simply found inefficiencies in the market itself.
Any point above the efficient market line is an inefficient strategy . It is the opposite of an effective strategy, meaning it results in an overall loss. Moreover, an inefficient strategy in an efficient market makes the market itself inefficient , which creates profitable opportunities for efficient strategies in an inefficient market. It sounds complicated, but these words contain an important meaning - if someone loses, then someone will definitely find.
Thus, there is an efficient market line, a zone of efficient strategies in an inefficient market, and a zone of inefficient strategies. In reality, if we mark a point on this chart at a certain time interval, we will get rather a cloud of points, which can be located anywhere and, for example, cross the efficient market line and both zones at the same time. This is due to the constant changes that occur in the market. It is an entity that evolves together with all participants. What was effective suddenly becomes ineffective and vice versa.
For this reason, I formulated another postulate: “ Any market participant strives for the effectiveness of his strategy, and the market strives for its own effectiveness, and when this is achieved, the financial result of the strategy will become zero ”.
In other words, the efficient market line has a strong gravity that, like a magnet, attracts everything that is above and below it. However, I doubt that absolute efficiency will be achieved in the near future. This requires that all market participants have equally fast access to information and respond to it effectively. Moreover, many traders and investors, including myself, have a strong interest in the market being inefficient. Just like we want gravity to be strong enough that we don't fly off into space from our couches, but gentle enough that we can visit the refrigerator. This limits or delays the transfer of information to each other.
Returning to the topic of Stop-Loss, one should pay attention to another pattern that follows from the postulates of market efficiency. Below, on the graph (red line), you can see how much the loss to profit ratio changes depending on the percentage of losing trades in the strategy.
For me, the values located on the red line are the mathematical expectation associated with the size of the loss in an effective strategy in an effective market. In other words, those who have a small percentage of losing trades in their strategy should be on guard. The potential loss in such strategies can be several times higher than the accumulated profit. In the case of strategies with a high percentage of losing trades, most of the risk has already been realized, so the potential loss relative to the profit is small.
As for my attitude towards Stop-Loss, I do not use it in my stock market investing strategy. That is, I don’t know in advance at what price I will close the position. This is because I treat buying shares as participating in a business. I cannot accept that when crazy Mr. Market knocks on my door and offers a strange price, I will immediately sell him my shares. Rather, I would ask myself, “ How efficient is the market right now and should I buy more shares at this price? ” My decision to sell should be motivated not only by the price but also by the fundamental reasons for the decline.
For me, the main criterion for closing a position is the company's profitability - a metric that is the same for everyone who looks at it. If a business stops being profitable, that's a red flag. In this case, the time the company has been in a loss-making state and the size of the losses are considered. Even a great company can have a bad quarter for one reason or another.
In my opinion, the main work with risks should take place before the company gets into the portfolio, and not after the position is opened. Often it doesn't even involve fundamental business analysis. Here are four things I'm talking about:
- Diversification. Distribution of investments among many companies.
- Gradually gaining position. Buying stocks within a range of prices, rather than at one desired price.
- Prioritization of sectors. For me, sectors of stable consumer demand always have a higher priority than others.
- No leverage.
I propose to examine the last point separately. The thing is that the broker who lends you money is absolutely right to be afraid that you won’t pay it back. For this reason, each time he calculates how much his loan is secured by your money and the current value of the shares (that is, the value that is currently on the market). Once this collateral is not enough, you will receive a so-called margin call . This is a requirement to fund an account to secure a loan. If you fail to do this, part of your position will be forcibly closed. Unfortunately, no one will listen to the excuse that this company is making a profit and the market is insane. The broker will simply give you a Stop-Loss. Therefore, leverage, by its definition, cannot be used in my investment strategy.
In conclusion of this article, I would like to say that the market, as a social phenomenon, contains a great paradox. On the one hand, we have a natural desire for it to be ineffective, on the other hand, we are all working on its effectiveness. It turns out that the income we take from the market is payment for this work. At the same time, our loss can be represented as the salary that we personally pay to other market participants for their efficiency. I don't know about you, but this understanding seems beautiful to me.

BTC/USDT 1D chart reviewHello everyone, let's look at the 1D BTC chart for USDT, in this situation we can see how the price moves in the local channel of the downward tendu in which we currently see a strong reflection and a quick return price around the upper border of the channel. However, let's start by defining goals for the near future the price must face:
T1 = 94020 $
T2 = 97698 $
Т3 = 102865 $
T4 = 109520 $
Let's go to Stop-Loss now in case of further declines on the market:
SL1 = 91130 $
SL2 = 88503 $
SL3 = 84723 $
SL4 = 81673 $
Looking at the MacD indicator, you can see that despite S

XRP/USDT 8H chartHello everyone, let's look at the 8H XRP chart to USDT, in this situation we can see how the price moves in a local inheritance trend much lower than the trend line itself.
However, let's start by defining goals for the near future the price must face:
T1 = $ 2.29
T2 = $ 2.39
Т3 = 2.50 $.
T4 = $ 2.65
Let's go to Stop-Loss now in case of further declines on the market:
SL1 = $ 2.14
SL2 = $ 2
SL3 = 1.77
Looking at the RSI indicator, we see
As we bounced again from the lower limit of the range, similarly to the MacD indicator with we go down and lower which in the coming time can end the correction.

Will BTC end the current correction at -24%? 1D ChartHello everyone, let's look at the 1D BTC to USDT chart, in this situation we can see how the price came out of the downtrend channel to the top, which gave a dynamic price increase, and then a new channel was created, this time an uptrend from which we could see an exit from the bottom. In a situation where the exit from the channel confirmed the decrease by the height of the channel, we could see another price decrease.
Let's start by defining the targets for the near future that the price must face:
T1 = 90088 USD
T2 = 95448 USD
Т3 = 103291 USD
Т4 = zone from 109435 USD to 115187 USD
Now let's move on to the stop-loss in case the market continues to fall:
SL1 = 79108 USD
SL2 = 72179 USD
SL3 = 61983 USD
When we look at the RSI indicator and the STOCH indicator, we can see that the energy is very much depleted and we are at the lower limit of the range, where previously we could often see a change in the price direction after such a situation.

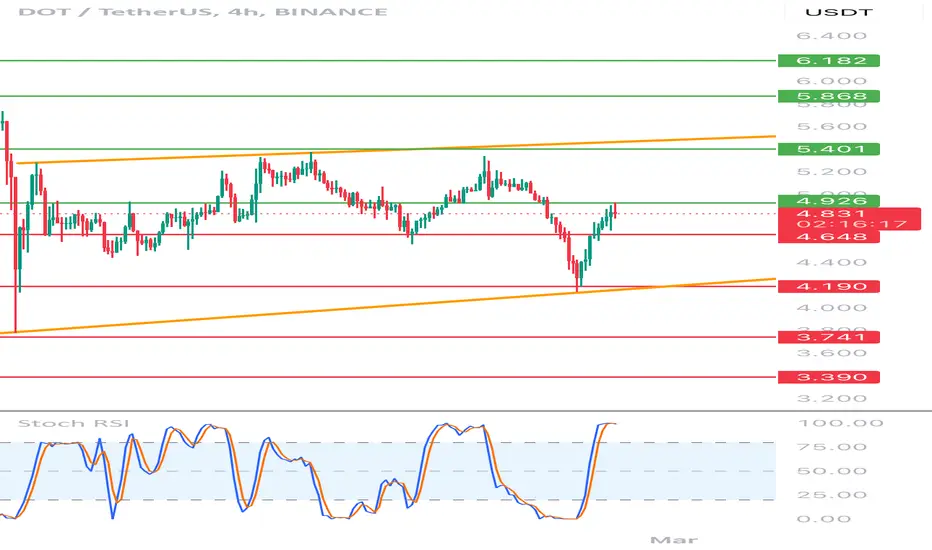
DOT/USDT 4H chart reviewHello everyone, let's look at the 4H Dot chart to USDT, in this situation we can see how the price moves in the local growth trend channel. However, let's start by defining goals for the near future the price must face:
T1 = $ 4.93
T2 = $ 5.40
Т3 = $ 5.87
T4 = $ 6.18
Let's go to Stop-Loss now in case of further declines on the market:
SL1 = 4.65 $
SL2 = 4.19 $
SL3 = $ 3,74
SL4 = $ 3.39
Looking at the RSI indicator, you can see the traffic above the upper limit of the range in the place where the price relief could be observed earlier.
BTC/USDT 1h chart reviewHello everyone, let's look at the 1H BTC chart to USDT, in this situation we can see how the price moves in the downward trend, the reflection from the downward trend line was currently visible. However, let's start by defining goals for the near future the price must face:
T1 = 94661 $
T2 = 95162 $
Т3 = 95521 $
T4 = 95969 $
T5 = 97241 $
Let's go to Stop-Loss now in case of further declines on the market:
SL1 = 93804 $
SL2 = 93279 $
SL3 = 92421 $
Looking at the RSI indicator, we see
How we stay below the lower range of the range, which may potentially indicate the end of the current relaxation.

LTC/USDTHello everyone, let's look at the 4H LTC chart to USDT, in this situation we can see how the price moves in the local high -ranking channel in which we quickly saw the return to the lower border of the channel. However, let's start by defining goals for the near future the price must face:
T1 = $ 129
T2 = $ 132
Т3 = $ 138
Let's go to Stop-Loss now in case of further declines on the market:
SL1 = $ 125
SL2 = $ 121
SL3 = $ 118
SL4 = $ 114
Looking at the RSI indicator, we see
As we entered the lower part of the range again, which may indicate a new growth movement, but here you can see the city so that any correction deepens.

XRP/USDT 1D chart reviewHello everyone, let's look at the 1D XRP chart to USDT, in this situation we can see how the price moves under the downward trend line, but we can see some price stabilization, which can affect the potential change of trend.
However, let's start by defining goals for the near future the price must face:
T1 = $ 2.57
T2 = $ 2.39
Т3 = 2.15 $
T4 = 1.76 $
Let's go to Stop-Loss now in case of further declines on the market:
SL1 = $ 2.77
SL2 = $ 3.07
SL3 = 3.40 $
The MacD indicator shows how we are still in the downward trend, but here you can see some stabilization, which may indicate an attempt to return to the upward trend.

LINK/USDT 1W chart ReviewHello everyone, let's look at the 1W link to USDT, in this situation we can see how the price moves under the downward trend line, but we can see some price stabilization, which can affect the potential change of trend. However, let's start by defining goals for the near future the price must face:
T1 = 19.20 $
T2 = = $ 21.67
Т3 = $ 25
T4 = $ 27.65
Let's go to Stop-Loss now in case of further declines on the market:
SL1 = $ 16.82
SL2 = $ 14.90
SL3 = 12.73 $
Looking at the RSI indicator, we see the descent below the lower limit of the range, which may also indicate

Adverse excursion: a key concept for risk managementAs a professional trader, I can tell you about the adverse excursion and its crucial importance in the world of trading.
Adverse excursion: a key concept for risk management
Adverse excursion refers to the unfavorable movement of the price of an asset after a position is opened. More precisely, it is the difference between the entry price and the worst point the price reaches before the position becomes profitable again or is closed.
Maximum Adverse Excursion (MAE)
The concept of Maximum Adverse Excursion (MAE), developed by John Sweeney, is particularly useful. It measures the maximum floating loss suffered by a position before it turns in your favor or is closed. The MAE is a powerful statistical tool for analyzing drawdowns in an open position.
Trading Efficiency
Using MAE has several benefits for traders:
Optimizing Stop-Loss: By analyzing MAE over a series of trades, the optimal level for placing stop-loss orders can be statistically determined.
Evaluating Trading Systems: MAE helps evaluate the performance of trading systems and identify areas for improvement.
Refining Risk Management Strategies: By understanding the maximum adverse moves, traders can refine their strategies to better preserve their capital.
Improving Trading Efficiency: MAE analysis can help improve decision-making and execute trades with greater accuracy and confidence.
Practical Application
To effectively use the concept of adverse excursion, it is crucial to collect data on a large number of trades. For example, if you observe a series of MAEs like this: 15, 23, 18, 16, 0, 11, 31, 17, 8, 0, 19, 26, 0, 38, 22, you can deduce valuable information about the behavior of your trades and adjust your stop-loss levels accordingly.
In conclusion, the adverse excursion and especially the MAE are powerful tools for any serious trader. They allow to optimize risk management, improve the performance of strategies and make more informed decisions. As they say in the trade, "who controls his risks, controls his profits".
_______
Using the Maximum Adverse Excursion (MAE) has several significant advantages over traditional stop-loss placement methods:
Data-driven optimization
The MAE allows for a more precise and data-driven approach to stop-loss placement:
Statistical analysis: By examining the distribution of the MAE over a large number of trades, the optimal level for placing stop-loss orders can be statistically determined.
Performance visualization: The graphical representation of the MAE provides a clear overview of trade performance, allowing the most effective stop-loss levels to be visually identified.
Balancing protection and performance
The MAE helps to find an optimal balance between capital protection and trading performance:
Retention of winning trades: The stop-loss can be placed to retain 75-85% of winning trades, thus avoiding prematurely cutting potentially profitable positions.
Elimination of large losses: At the same time, this approach eliminates trades that suffer large losses, thus protecting capital.
Adaptation to the specific strategy
The MAE adapts to the unique characteristics of each trading strategy:
Customization: Unlike generic methods, the MAE takes into account the specific behavior of the trades of a given strategy.
Flexibility: This approach can be applied to a variety of strategies, whether short-term trading, swing trading, or long-term positions3.
Improved risk management
Using the MAE contributes to better overall risk management:
Deep understanding: The MAE provides a more nuanced understanding of how trades evolve, allowing for better risk assessment.
Reduced stress: By having a solid basis for placing stop-losses, traders can reduce the stress associated with real-time decision-making.
Complementarity with other tools
The MAE can be used in conjunction with other techniques:
Combination with the MFE: The analysis of the Maximum Favorable Excursion (MFE) in parallel can help to optimize not only the stop-losses, but also the profit-taking.
Cross-validation: The results obtained by the MAE analysis can be compared with those of traditional parameter optimization methods for greater confidence in the strategy.

FTM/USD 8H possible correction?Hello everyone, let's look at the 8H FTM to USDT chart, in this situation we can see how the price has broken out of the local downtrend line, which it is currently moving above.
Let's start by defining the targets for the near future that the price must face:
T1 = $0.75
T2 = $0.86
Т3 = $1.02
Т4 = $1.19
Now let's move on to the stop-loss in case the market continues to fall:
SL1 = $0.60
SL2 = $0.49
SL3 = $0.42
SL4 = $0.32
It is worth looking at the RSI indicator, which shows how strongly we have broken out of the upper limit of the range, moreover, here we can see how we have touched the level of 81, at which price rebounds were previously visible.

BTC/USDT 1D Chart Reviev/Are we approaching a new upward moveme?Hello everyone, let's look at the 1D BTC to USDT chart, in this situation we can see how the price is locally below the downtrend line and currently following the downtrend we are approaching the main uptrend line which is a strong support for the price.
Let's start by defining the targets for the near future that the price has to face:
T1 = 98948USD
T2 = 101357USD
Т3 = 103727USD
Т4 = 107100USD
Now let's move on to the stop-loss in case the market continues to fall:
Currently we can see how the price is holding in a strong support zone from the level of $94450 to the level of $92683, however if we exit this zone below it it is worth considering a stoploss at these levels.
SL1 = 89791USD
SL2 = 85213USD
It is worth paying attention to the RSI indicator where we can see a break of the support line, which gives a strong reaction, and we can see how we are approaching the lower limit of the range, and what is more, we can see that currently we are lower on the indicator, but the price remains at a similar level or even slightly higher, which can positively affect the potential price rebound, giving a greater increase.

ETC/USDT 1H Chart ReviewHi everyone, let's look at the 1h ETC to USDT chart, in this situation we can see how the price has fallen below the uptrend line, and what's more we can see the first attempt to return above the trend line, however we can see the place that rejected the price.
Let's start by defining the targets for the near future that the price has to face:
T1 = 20.79 USD
T2 = 21.09 USD
Т3 = 21.60 USD
Т4 = 21.95 USD
Now let's move on to the stop-loss in case the market continues to fall:
SL1 = 20.19 USD
SL2 = 19.73 USD
SL3 = 19.26 USD
SL4 = 18.90 USD
On the Stoch RSI indicator we can see how the energy is decreasing and staying in the lower part of the range, keeping the price from a bigger drop for now.

SOL/USDT 4H Chart ReviewHello everyone, let's look at the 4H SOL to USDT chart, in this situation we can see how the price has moved sideways from the downtrend line, while currently we see movement in the triangle marked with blue lines, in which we are also approaching the exit, and therefore the price should take the direction of movement.
Let's start by defining the goals for the near future that the price must face:
T1 = 206 USD
T2 = 224 USD
Т3 = 239 USD
Т4 = 255 USD
Now let's move on to the stop-loss in case the market continues to fall:
SL1 = 192 USD
SL2 = 174 USD
SL3 = 160 USD
SL4 = 146 USD
When we look at the RSI indicator, we can see how energy is approaching the lower limit of the range and here we can see that we often had descents significantly below the lower range, but we are approaching the zone where we could previously observe price rebounds.

Is BTC approaching its upcoming price increases?Hello everyone, let's look at the 1D BTC to USDT chart, in this situation we can see how the price is moving in the local uptrend channel, as you can see we are holding at the lower border of the channel which may indicate that we are close to the return of the price growth.
What's more, on the RSI indicator we can see how we are moving below the lower border which may also indicate the upcoming growth.
Let's start by defining the targets for the near future that the price has to face:
T1 = 98944 USD
T2 = 101432 USD
Т3 = 103769 USD
Т4 = 107237 USD
Now let's move on to the stop-loss in case the market continues to fall:
SL1 = 94233 USD
SL2 = 90048 USD
SL3 = 84997 USD
