KNC/BTC - major pump incoming?!KNC/BTC looks to be setting up for an explosion. Not a bad idea to long here with s/l below the bottom blue line. Moon target seems probable.
Target 1: 0.00008250
Target 2 (moon target): 0.00013100
Blue triangle indicates the current range.
Green box is buy.
Red box is sell.
Blue line indicates major resistance.
This is a log chart.
Stoploss

EURJPY 4H LONG TRADEThe YEN pairs are all setting up for this same move.
EURJPY has a large space to work with and a good Macd to help with the stop
Long Trade
Buy Stop @ 124.97
Buy Take Profit near the 50 sma @ 125.67
If Macd drops below Red signal line close trade
SL @ 124.25
Wath Macd for Bullish confirmation

USDCAD Long EntryOANDA:USDCAD
1D LongPosition; Entry Strategy on 4H Chart
If price breaks through the orange DTL1:
Option A:
Not Respecting previous Area of RES 1.34671 and moving straight to next RES at 1.36644 (stronger correction could follow at 1.36644 Level than in Option B)
Option B:
Respecting the 1.34671 RES, Correcting into previous Structure, which is also the Fib 50 / 61.80 Area and the making a move to the upside.
Also SMA 50 / 100 / 200 on the 1D and 4H Chart look good for a stable move to the Upside.
ENTRY for Both Options could be 1.34676 with a SL at 1.33543.
Possible TP 1.36669, or you ride that Upmove.

EURNZD Short Candlestick goal! 3/1Here we have GBPNZD where I personally feel it could trend downwards, due to the previous candlestick confirmation thats why we have a very short SL!!

BTC / USD Bitstamp: Time is cyclical? Nothing new?BITSTAMP:BTCUSD I previously published an idea in which I reviewed the BTCUSD chart on a 1 week timeframe. In this idea, I came to the idea that we will move below $ 3000, which I still think about. Today, I will publish a new idea with a shorter timeframe. It seems to me that BTCUSD repeats its own movement and we should expect a fall, as indicated by some indicators and patterns.
On the 9th of January a doji reversal candle was formed. Today (March 19) we are witnessing the formation of a hammer reversal candle. I also noted on the chart a false break through of MA, which should signal an upward move, but unfortunately, it is false and we have to break down the next few days. Among other things, I attached the Stoch RSI indicator, which also signals overbought and the next downward movement.
I do not provide financial advice, I just publish my thoughts, nothing more. If you are trading, do not forget to use a stop order. Good luck!

EURUSD: Interesting moves scattered aroundEURUSD has presented different opportunities and conflicting signals. 'Everybody' wants to know which way it is going. This is the wrong question.
In this screencast I show different opportunities relative to trends on different time frames. Where price is going, depends heavily on which time frame trend you're stalking - and whether you'r willing to take a controlled loss on that time frame (alias stop-loss). As I do not work with a 'predictions' model, I simply cannot predict where price is going or any targets.
My personal bias was for price on 1D time frame to move south. But now the evidence on the charts confront me. It is also probable that a lower time frame trend could eventually move the bigger time frames north. This is how big trend get reversed - it just makes sense.
The way I see it is that all traders exploit trends - by some methodology. The trick - which is not easy - is controlling loss, extracting the money and running like hell! :)
To be clear this post is not a recommendation to take any particular position.


Cindicator Support and ResistanceSupport: .00000313
Resistance: .00000350
Stop: .00000309
Take Profit:
1) .00000327
2) .00000338
3) .00000343

EUR.JPY (S) - Thursday, 14 February 2019 / -0.5%Thursday, 14 February 2019 EUR.JPY (S) -0.5%
A textbook trade opportunity that provided 7 positive confluence factors, in addition to a healthy 2.5:1 reward comparative to risk.\u2028\u2028
Drawdown as a financial trader is inevitable, it requires immense amounts of strategically designed mental strength to trust your strategy.\u2028
How you deal with these emotional demons moving forward will determine your future success. #Transparency

Paddy Power Betfair (PPB) Short PPB's investors haven't had much to laugh about this year, not even their comical television adds could cheer them up, i'm sorry to say that from the looks of the daily chart the stock could be in for some more pain soon. After a tremendous run in may the stock has seen a lot of downside until finally finding support at the 6000 level currently the price is having it's third attempt to break the support. In the run up to the last two tests of support the stock has put in lower highers which suggests that the sellers are fully in control of the stock, the last two trading days of last week posted bearish inside days suggesting some indecision in the stock indicating a potential move this week. I am inclined to go short in the name with a stop order at 5999 below support and a stop loss placed at the high of the day prior to the break out from the support. If you enjoyed this idea give me a follow there will be more to come and if you hated it please let me also, happy trading.
Joe
LSE:PPB


NZDJPY LongWe seem to be pretty clear above a nice supply zone. Buy and let it ride to 77.050. Conservative investors can attempt a pull back buy @ 76. Set stop loss @ 75.25. You should be receiving a 1.25 - 1.35r


Place your bets gentlemen! Which way will it go?I think if you look at this chart on its own... Keep in mind this is the 1 hr chart. It looks about as neutral as neutral can be. Could go up as easy as it could go down.
At a glance I would say this is going to drop to 22 rather then go to 36. But who cares right. We have held since 200 so FUCK IT!....
NO. I'm done. I'm not loosing another dollar.
STOP
LOOK AT THE DAILY!
ITS OVER. GET OUT. I have buy orders at $4.09 and 13.25 on LTC. If you have profit. Take it and WAIT a few months. LOOK AT ALL THE SELL ORDERS RIGHT THIS SECOND ON COINBASE. 6322LTC ON THE ASK! NO JOKE. You might see this a few hours later but right now there is a 6322 sell order at the current price on LTC and its been there for a while.
Live to fight another day. FFS that was a huge loss! OVER20 club I guess.
Please like and subscribe :)


MACD TREND FOLLOWING STRATEGYEURUSD 30M CHART
This strategy is a setup for a Long continuation trade
(Rules for A Buy Trade)
Step #1: Wait for the MACD lines to develop a higher high followed by a lower high swing point.
This is an unorthodox approach to technical analysis. But, we at Trading Strategy Guides.com are different. We don’t mind doing uncomfortable things if that’s what it takes to succeed in this business.
The first rule of thumb to recognize a swing high on the MACD indicator is to look at the price chart if the respective currency pair is doing a swing high the same as the MACD indicator does. A higher high is the highest swing price point on a chart and must be higher than all previous swing high points. While a lower high happens when the swing point is lower than the previous swing high point.
Step #2: Connect the MACD line swing points that you have identified in Step #1 with a trendline
This step is quite simple, right?
At this point, we really ignored the histogram because much of the information contained by the histogram is already showing up by the moving averages. Look at the price action now and compare it to our MACD trendline we drew early. We can clearly notice that the MACD contains the price action much better and reflects the trend much clear.
But, at this point, we’re still not done with the MACD indicator, which brings us to the critical part of our MACD Trend Following Strategy.
Step #3: Wait for the MACD line to break above the trendline. (Entry at the market price as soon as the MACD line breaks above)
When the MACD line (the blue line) crosses the signal line (the orange line) it’s an early signal that a bullish trend might start. However, if trading would be that easy we would all be millionaires, right? And that’s the reason why our MACD Trend Following Strategy is so unique. We’re not only waiting for the MACD moving averages to cross over but we also have our other criteria for the price action to break aka the trend line we drew early.
This is a clever way to filter out the false signals, but you have to be equipped with the right mindset and have patience until all the piece of the puzzle come together. If you were to trade just based on the MACD crossover over time you’ll lose money because that’s not a reliable strategy. But if you use the MACD indicator along with other cafeterias such what this strategy tells you to do, you will find great trade entries on a consistent basis.
Step #4: Use Protective Stop Loss Order. (Place the SL below the most recent swing low)
Now, that you already know how to enter a trade at this point you have to learn how to manage risk and where to place the SL. After all, a trader is basically a risk manager.
You want to place your stop loss below the most recent low, like in the figure below. But make sure you add a buffer of 5-10 pips away from the low, to protect yourself from possible false breakouts.
Did you notice?
The MACD Trend Following Strategy triggered the buy signal right at the start of a new trend and what is most important the timing is more than perfection. We bought EUR/USD the same day the bullish trend started.
Now, what this has to do with the SL?
Basically, a good entry price means a smaller stop loss and ultimately it means you’ll lose a lot less comparing it with the profit potential, so a positive risk to reward ratio.
Step #5: You determine your Take Profit or when the MACD crossover happens in the opposite direction of our entry
Knowing when to take profit is as important as knowing when to enter a trade. However, we want to make sure we don’t use the same trading technique as for our entry order. When the MACD line (the blue line) crosses the signal line (the orange line) we want to close the position and take full profits.
Before taking profits, it’s important to wait for the candle close – either the 4h or the daily candle – depending on the time frame you trade so you make sure the MACD crossover actually happens.
Note** The above was an example of a buy trade using the MACD Trend Following Strategy. Use the exact same rules – but in reverse – for a sell trade.

Huge 3,652% profit on TronMassive profit on Tron using my own Stop Loss strategy!
This is on regular chart, the profit was massive at 3,652%, win rate 70%, 6.4 profit factor. From 10,000$ to 365,245$.

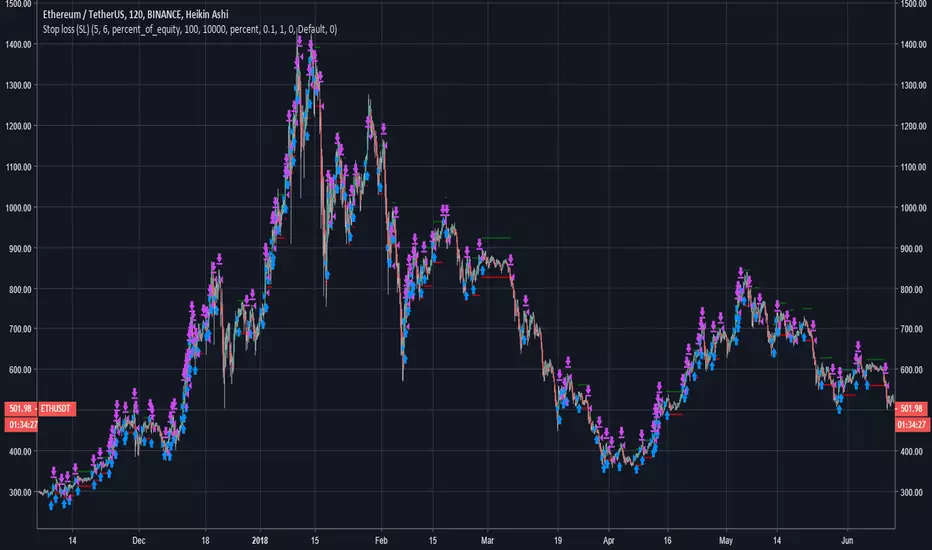
6,532% Profit for Ethereum using Heikin Ashi and Stop LossCrazy profit 6,532% , 66% profitable, 2x profit factor. Beats buy and hold using my Stop Loss strategy :)
Note this uses Heikin Ashi chart so the chart prices used by strategy is different from actual bars.
Bitcoin trade strategy (90% profit)Using my Stop Loss strategy (SL) for Bitcoin, daily timeframe. Results:
Profit = 90%
Win rate = 55%
Profit factor = 1.8

Ethereum Stop Loss strategyTrading strategy for Ethereum:
Profit = 250%
Profit win rate = 60%
Profit factor =2.2

2 BTC to 20 BTC Trading Challenge - Day 24 (0.39 BTC)Disclaimer: If you are primarily interested in copying other people’s trades then this is not for you. However, if you are willing to put in the work that it takes to learn how to trade for yourself then you have found the right place! Nevertheless please be advised that you can give 10 people a profitable trading strategy and only 1-2 of them will be able to succeed long term. If you fall into the majority that tries and fails then I assume no responsibility for your losses. What you do with your $ is your business, what I do with my $ is my business.
Click here for my Comprehensive Trading Strategy | Click here for my Comprehensive Trading Process | Click here to learn about the 2 BTC' to 20 BTC' Trading Challenge
I am currently in Las Vegas for the Unconfiscatable Conference and I didn’t have intentions of making another update until returning home. However the stop loss on my USD:TRY long was triggered and because of that I felt the need to make another post.
I had high hopes for that trade. I was expecting it claw out of it’s unrealized loss and go onto makeup for a large portion of the deficit that I got myself into with the string of losses that started this challenge.
That position easily could have netted me 1+ BTC over the coming weeks / months. Instead it broke down $5.25, triggered my stop and capitalized on a loss of 0.3425 BTC.
That puts me into a deep hole and it will make it very difficult to complete this challenge on time. Now the challenge will be to get back to breakeven in the next three months. If I can do that then I believe it is still possible to complete the original goal of +1,000% in less than 6 months.
A big part of the motivation for starting this challenge is to inspire others who have gotten completely rekt throughout this bear market and what better way to do that then to get completely rekt myself?!
If it wasn’t for this challenge I would likely take a few weeks off and deposit another ~ 1.5 BTC. Instead I am going to roll up my sleeves, decrease my risk and get back to work.
Open Positions
Short: XAUUSD
* STOP ORDER TRIGGERED on 1/18/19 to short 0.05 lots
Price: $1,284.73
Stop: $1,297.26
Projected Risk: 0.97%
Leverage: 100X
Exposure: 0.05 lots
Margin: 0.016 BTC
Unrealized PnL: +0.004 BTC
Long: USDCAD
*1/17/19 Stop order entered to open long primarily due to recent golden cross with 50 and 200 W MA’s. Daily signaled 50% entry due to P > S MA (5%) + Bullish M MA (30%) + BS (15%)
Price: $1.33032
Stop: $1.3149
Risk: 1.15% / 0.07 BTC
Leverage: 100X
Exposure: 0.21 lots
Margin: 0.057 BTC
Unrealized PnL: -0.002 BTC
Closed Positions
Long: USDTRY
Enter: $5.55804
Exposure: $16,000
Leverage: 100:1
PnL: -0.3425 BTC
ROI: -7.81%
Watchtower
.
BTC
Notes: Expecting gap in volume profile to get filled before final capitulation takes up to the $1.4K - $1K range. Backwardation spread is up to 4% which is primary reason why I am bullish.
XRPBTC
Notes: Appears to be breaking down symm triangle & rolling over D L MA following DC. Backwardation is the only reason I am holding onto long. Trying to re enter weekly cloud which is on verge of bullish kumo twist.
ETHUSD:
Patterns: 5 month bear channel | Daily chart starting to look like h&s
Notes: First weekly buy signal since April 2018. Weekly higher low? Lifetime POC = $212 (in confluence with W L MA & 200 D MA)
LTCUSD:
Patterns: 7 month bear channel with potential recent bull trap. If TL resistance holds then should get a h&s w abbreviated right shoulder.

Comprehensive Trading Strategy - ConsensioDisclaimer: If you are primarily interested in copying other people’s trades then this is not for you. However, if you are willing to put in the work that it takes to learn how to trade for yourself then you have found the right place! Nevertheless please be advised that you can give 10 people a profitable trading strategy and only 1-2 of them will be able to succeed long term. If you fall into the majority that tries and fails then I assume no responsibility for your losses. What you do with your $ is your business, what I do with my $ is my business.
Identify Time Horizon
First and most important is identifying the time frame that you want to trade. I primarily trade the daily chart using Tyler Jenks’ Consensio. It was designed to capture long term trends. If followed it will ensure that you do not miss out on a trend and it will also get you out before it fully reverses.
“We want 90% of the cookie” -Tyler Jenks
There will be times when we cost ourselves a small amount of opportunity but that will be peanuts in comparison to the larger trends that will be captured.
Even though it was designed for higher time frames (TFs), specifically the weekly, it can still be used on smaller TFs based on your understanding and time availability. Decisions need to be made each time a candle closes, therefore you need to be available, or out of all positions, every time that happens.
I trade the daily chart because I know that I will be available every day for the candle close. I also like to trade the stock market, commodities, and FOREX as well as crypto because the daily closes are staggered throughout the afternoon and it gives me time to manage my positions.
If you prefer to day trade then this strategy can be used for the 1m - 1h candles. However it doesn’t seem to be too conducive to anything above 1h, if trading 24/7 markets.
For example: if trading the 4h then will not have enough time for position to develop before going to bed.
Regardless of what TF you select you can zoom out to determine longer term trends, however you should only use one TF for making decisions.
For example: I trade the daily chart and will zoom out to the weekly when I am looking for major reversals. However, if the price is signaling entries on the weekly then that is irrelevant because I make decisions based on the daily chart.
Identify Trend
“The purest form of Consensio is three Moving Averages without the price” -Tyler Jenks
Once you know what time frame you are going to trade then you need a reliable way to identify the trend. I have found Consensio to be the single most powerful tool for recognizing trends (as well as signaling entries, exits and reversals).
It is a system that seems very simple on the surface and potentially even unoriginal. However the deeper you dig the more you will uncover.
To start you need to go to the source directly:
Consensio - A New Trading System
Deep Dive Into Consensio
The notes that I have on it span well over 100 pages and I couldn’t possibly sum that all up in this post. Nevertheless I will attempt to cover the most important parts of the puzzle.
Important: Watch the videos above or else below will not make sense.
I have four subcategories for trending markets that are somewhat similar to Elliott Waves.
1) Short, medium and long term trend all in alignment. For bull trend: price > Short MA > Medium MA > Long MA (Strong trend)
2) Minor Correction (Small pullback moves against overall trend)
3) Major Correction (ABC type of correction that forms lower high but finds support at major boundary levels - Long MA, horizontal or trend line)
4) Potential Reversal (Price closes below long term MA and starts turning it over)
The moving averages should be dialed in to your specific time frame to help identify each subcategory above. When the asset is in a strong trend you want to see the Short Term MA act as support / resistance. A close above / below the Short Term MA indicates a minor correction. When there is a minor correction you want the Medium Term MA to act as support / resistance. A close above / below the Medium Term MA indicates a major correction taking place. When there is a major correction that doesn’t quite reverse the trend then you want the Long Term MA to act as support / resistance. A close above or below the Long Term MA indicates a potential reversal. If in a strong trend then expect price to quickly react from the Long Term MA and continue the trend.
For example: in a bull market the long term MA should act as strong support / provide a strong bounce. If it doesn't and the price closes below it instead then that is an indication that the bull market is getting exhausted.
When the Long Term MA starts to show signs of a reversal then I will add a Longer Term MA (default is 200) and / or I will zoom out to the weekly chart. This really helps me to understand if it is just a major correction within a market that is still trending or if a full on reversal is to be expected.
Being able to distinguish major corrections from reversals is the hardest part about consistently beating the market in the long run. Once you are comfortable with that then it mainly comes down to patience, discipline and diligence in regards to acting on signals and managing risk.
Entry & Exit Signals
5% when Price crosses Short Term MA (default is 4)
10% when Price crosses Medium Term MA (default is 9)
15% when Short Term MA crosses Medium Term MA
20% when Medium Term MA turns over (if it was trending down, then watch for it to turn up)
25% Price cross Long Term MA & Long Term MA flattens / turns over
25% Golden Cross with the Medium Term MA & Long Term MA
If multiple happens at once then sum the %’s.
For Example: P close < S & M MA then enter 15% .
If I am not in position then price crossing MA’s would trigger entries. If I am in a position then it would trigger exits. In rare cases I will flip my position by exiting a short and immediately entering a long, or vice-versa.
Entries and exits are done as soon as possible after the candle closes. I trade the daily chart so I will wait for the daily candle to close before making decisions and then I will try to make sure I get filled within 30 minutes (will take a market order if necessary). If you try to front run the candle close then you will make more mistakes than it is worth. It is very important to only make decisions after the candle closes. Everything else is noise and you cannot make decisions based on noise.
I may pass on signals if it would enter me against a longer term trend.
For Example: Price closes above Short Term and Medium Term MA’s and they cross over in a bullish manner. 30% - 50% long entry signaled. May choose to pass if Long Term MA is bearish.
I can completely pass on this entry in favor of waiting for a short if the price is below the Long Term MA and the Long Term MA is in a strong bear trend. In this case I will expect Long Term MA to act as strong resistance and will wait for price to close back below shorter term MA’s to trigger a short entry.
It takes time to reverse a trend. In the above example the Long Term MA is in a strong bear trend while price appears to be rallying through it after 50% long entry is signaled. I would pass on long entries and be very confident that the price isn’t going to blow right through my Long Term MA (due to the downward angle).
It very well might reverse the trend, however that will take time. If the price is above a Long Term MA that is angled down then the MA will act as a magnet for the price until it flattens / turns over.
Passing on the first long entries that are signaled does not mean that I will pass up on it all together, it just means that I think it is too early / risky. I would strongly prefer to wait for a golden cross with the Long Term MA flattened, or angled up, to go ahead and fully enter. In the example above I would wait for a pullback to the Long Term MA. If it supports above and gets a golden cross with the Medium Term MA then I would be much more inclined to take that entry.
It is very important to understand the difference between opportunity cost vs capitalizing on a loss. As traders we need to be completely comfortable with missing out on opportunity and extremely diligent about avoiding / minimizing losses. Therefore it is okay to pass on possible entries that are less than ideal however it is not okay to pass up on exits that feel similar.
Stop Losses & Risk Management
I determine my position size and leverage based on the amount of risk that I would be assuming. If an entry is triggered then I will use the Parabolic SAR or the Bill Williams Fractal to determine my risk.
If SAR is too tight then I will use the Fractal. I use the medium and long term MA’s to determine what is or is not too tight. Prefer stop to be above long term MA but has to be above medium MA.
I am trading Consensio, and it does not allow for stop losses in this manner. Instead it demands that you hold onto a position through the candle close and that you scale out in pieces (see above 'Entries & Exits'). This is best in 99%+ of the time.
However that really limits the leverage that can be used. If trading the daily chart 3X - 5X would be the absolute max. I tend to prefer 5X - 10X leverage for a number of reasons:
-Minimizes exchange risk
-Can minimize slippage
-Still gives me plenty of flexibility to place stop above prior Fractal / SAR
Below shows an example entry triggered and my thought process for where to place the stop along with a risk / leverage calculation.
Once I understand the risk, then I can calculate the position size. You should always think of risk as the amount you stand to lose opposed to exposure amount. I do not care about the exposure amount. I care about how much I stand to lose... how much I am risking. I care about controlling my downside and limiting it to less than 2% of my trading capital.
In the above example the risk is 7.10% and the max leverage is 14.08%. I never use the max leverage because getting liquidating comes with significantly higher fees. In this case I would use 10X or less leverage and I would make sure to set a market stop loss below the liquidation price.
If you get liquidated then it will likely be a ~22% fee. If you take a market stop before the liquidation triggers then it will be a ~2% fee.
I currently like to cap my risk at $500 per trade. $500 (USD I wish to risk) / 0.071 (calculated risk based on wick above Fractal) = $7,042 (exposure)
$7,042 is my maximum exposure. With 10X leverage $704.20 is the most I will need for margin. Once I understand my position size, leverage and margin requirements then the position size can be easily calculated based on the Entry & Exit Signals above.
Trailing Stop Losses
I consider myself 100% entered when I have $500 at risk. If the price moves in my favor then I will trail the stop loss. If I trail it to the point where it is at break even, or better, then I will not consider myself fully entered anymore.
Even though I still have the full original exposure, I am no longer assuming any risk and the latter is all that matters to me. Therefore I would feel comfortable adding to my exposure up until the point where I am risking another $500.
In the example above we get a great entry before a strong trend starts (also happened to follow descending triangle breakdown which provided great confirmation). The price quickly moves in our favor to the point where the stop is adjusted to break even, or very close to it.
With no risk I do not consider myself to be fully exposed anymore and I feel comfortable adding to my position up to an amount that would risk $500. Need to be very careful with this because adding to a profitable position after a big move can completely ruin your trade.
I will use the TD’ Sequential , RSI and Average Directional Index to confirm that the trend still has room to go. I will also check horizontals and trends to make sure I’m not selling support / buying resistance. In the example above I would really like adding because all of the above are in my favor.
This can be thought of as manual unbalancing which is the opposite of how most people approach allocating capital.
Automatic rebalancing will sell the most profitable positions and add to the lesser profitable positions in order to keep the same allocation percentages.
For example: if allocations are 50% Apple and 50% Amazon then Amazon outperforms. It will be something like 45% Apple and 55% Amazon. Rebalancing would sell Amazon and buy Apple so that it is 50:50 again.
I have always thought that is completely backwards. I want to allocate my capital to the best performing assets. If I am in a position that is really moving in my favor then I am thinking about adding to it. I would never take away from a more profitable position to add to a lesser profitable one just for the sake of balancing my portfolio.
Conclusion
What is outlined above is enough to ensure that you do not miss out on a trend and it also ensures that you will get out before it fully reverses. Don’t take me word for it, go do some backtesting yourself. That is when the power of Consensio will really come to life.
When trying out a new strategy I always recommend to start with an extremely small amount of money that is > $0 and I also recommend zooming in.
I think that it is very important to have some skin in the game so that you feel the pain and pleasure of losing and winning. However I think that is should be very nominal. If you have a $10,000 trading roll then I would take $100 and trade the 3m chart. Focus on learning the intricacies and making sound decisions. Also focus on ROI and how long it takes to generate 10%, 50% or 100%+ returns opposed the dollar amount being returned.
Regardless of what time frame you decide to trade I would always start with a very small TF. The reason is that the daily / weekly charts could take years to teach what the 3m and 5m charts can teach in days.
The decision making process should be exactly the same regardless of the TF. There are a ton of variables and intricate situations that you can put yourself into by trading small TF’s. Thinking your way through these situations is how you internalize and gain confidence in the trading system as well as the decision making process.
Facing these situations before you have significant money on the line is what I consider batting practice.
“We don't rise to the level of our expectations, we fall to the level of our training.” -Archilochos
After a couple weeks of trading the shorter TF’s I felt comfortable putting significant money to work on the Daily chart. However, I consider myself a fast learner and that process could take longer for others.

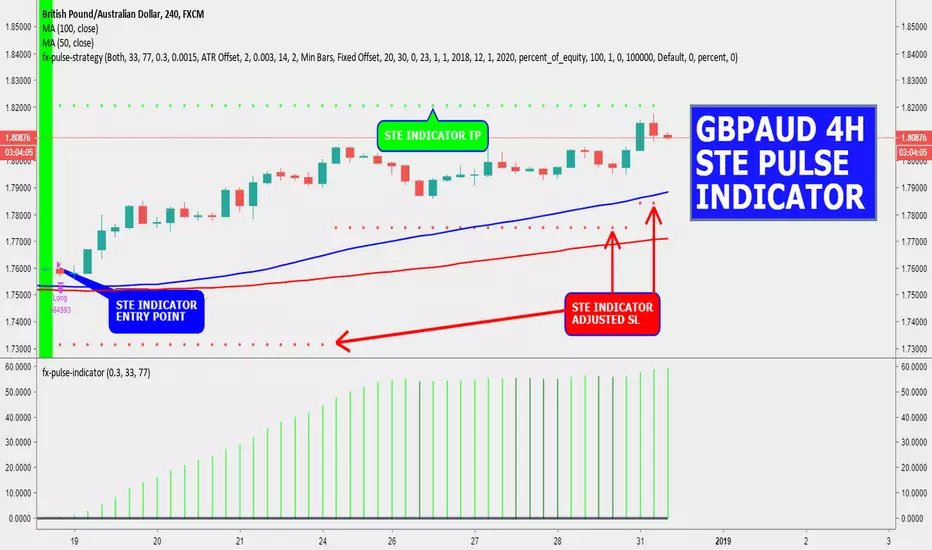
GBPAUD 4H STE PULSE INDICATOR STRATEGYSTE PULSE INDICATOR FOUND A LONG TRADE
STE PULSE INDICATOR FOUND ENTRY POINT - SL - TP
STE PULSE INDICATOR ADJUSTED SL AS PRICE CONTINUED TO RISE
PM me if you have any questions I can help you with concerning this strategy indicator