STORJUSDT 1W Analysis STORJ ~ 1W Analysis
#STORJ This is the closest support for now. Buy if you still have confidence in this coin with a short term target of at least 20%+ from this support.
Storj

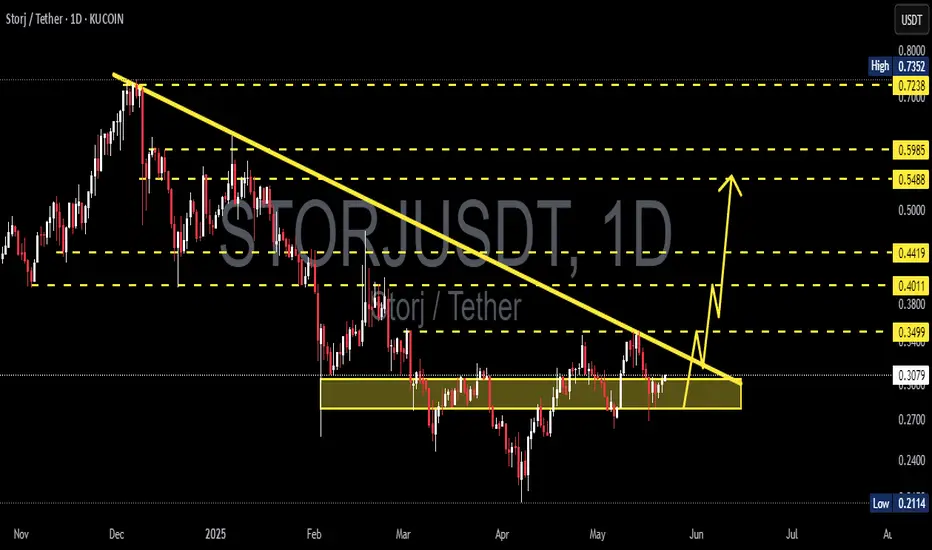
STORJUSDT 1D AnalysisSTORJ ~ 1D Analysis
#STORJ Buy gradually from here if you still have confidence in this coin with a short term target of at least 10%++
#STORJ/USDT#STORJ
The price is moving within a descending channel on the 1-hour frame, adhering well to it, and is on its way to breaking it strongly upwards and retesting it.
We are seeing a bounce from the lower boundary of the descending channel, which is support at 0.3060.
We have a downtrend on the RSI indicator that is about to break and retest, supporting the upward trend.
We are looking for stability above the 100 moving average.
Entry price: 0.3090
First target: 0.3125
Second target: 0.3170
Third target: 0.3231

Storj —Strong Move Ahead (Easy 100-200% Profits Potential)The inverted triangles depict the bottom. After Storj moved above the 3-Feb low and broke the downtrend we entered bullish territory.
The chart was bullish when the bottom hit 7-April and we can predict a recovery, but this is only a prediction. When the action moves decisively above support, and growth starts to happen above support, then the bullish bias is fully confirmed. This is exactly what is happening here.
» STORJUSDT is trading above support and is ready to grow. This chart shows the potential for a 100-200% move to develop in the coming days. It can start within days and take only a few weeks to fully develop. This will only be the start.
After this initial strong bullish breakout, we will see growth long-term. Higher highs and higher lows. The 2025 Cryptocurrency—Altcoins bull market.
Thank you for reading.
Namaste.

STORJUSDT 1D AnalysisSTORJ ~ 1D Analysis
#STORJ Looks very bullish after successfully penetrating this resistant line.

Storj Breaking out Expecting Solid Bullish Rally Storj Chart Looking Very Good For Midterm, Testing Falling Wedge (Trendline Resistance) Successful Breakout Can Lead Solid Bullish Rally Towards 0.50$ In Coming Days.

STORJUSDT buy/long (1W)STORJ is approaching a strong origin level on the weekly timeframe.
This origin has already been tapped once, but there should still be significant BUY orders remaining in this zone.
A liquidity pool has also been built up. We expect a strong reaction from this area.
We are looking for BUY/LONG positions around the demand zone, especially near the optimized entry.
A weekly candle close below the invalidation level would invalidate this setup.
Do not enter the position without capital management and stop setting
Comment if you have any questions
thank you

STORJ: A Close Support#Storj recently bounced from a key support zone. As long as it holds above $0.195 (strict stop-loss), strong bullish momentum could follow.
Breaking $0.195 is a major red flag and may trigger bearish scenarios.
Passing $0.77 confirms going higher.

STORJUSDT 1WSTORJ ~ 1W Analysis
#STORJ Buy gradually from here with a short -term target of at least 20%+.
reason, this support continues to be maintained so far.

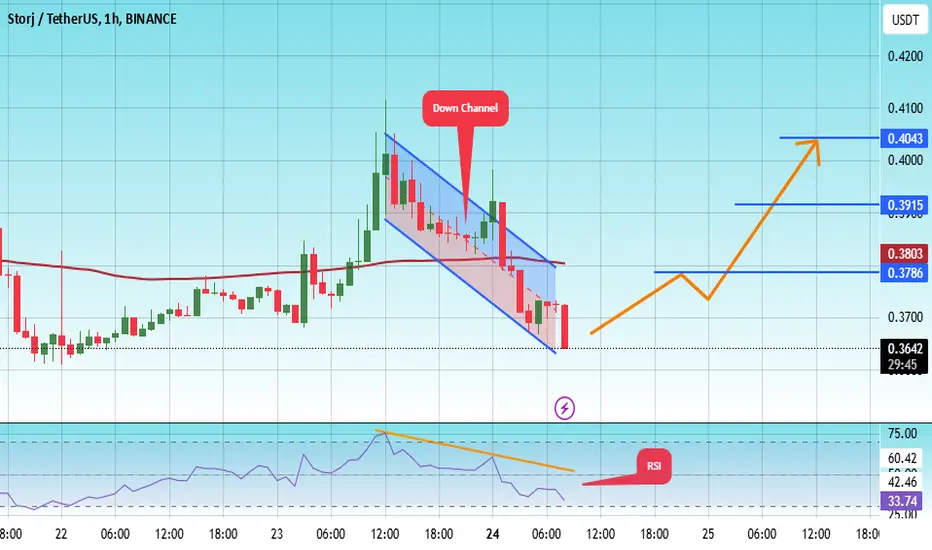
#STORJ/USDT#STORJ
The price is moving in a descending channel on the 1-hour frame and is adhering to it well and is heading to break it strongly upwards and retest it
We have a bounce from the lower limit of the descending channel, this support is at a price of 0.3630
We have a downtrend on the RSI indicator that is about to break and retest, which supports the rise
We have a trend to stabilize above the moving average 100
Entry price 0.3653
First target 0.3786
Second target 0.3915
Third target 0.14043
STORJ ANALYSIS📊 #STORJ Analysis : Update
✅There was a formation of Falling Wedge Pattern on daily chart🧐
#STORJ tried to breakout the pattern but failed to sustain. Also there is an instant resistance zone and if #STORJ breaks the pattern then we could expect around $0.5300 level
👀Current Price: $0.3967
🚀 Target Price: $0.5300
⚡️What to do ?
👀Keep an eye on #STORJ price action and volume. We can trade according to the chart and make some profits⚡️⚡️
#STORJ #Cryptocurrency #TechnicalAnalysis #DYOR

STORJUSDT 1WSTORJ ~ 1W Analysis
#STORJ Buy gradually from here if you still have a Conviction on this Coin with a minimum target of 20%+

STORJ Breakout Loading Is a Bullish Surge on the Horizon?Pattern and Setup
Symmetrical Triangle Formation. A bullish pattern indicating potential upward momentum.
The price is currently consolidating within the triangle, nearing a potential breakout point.
Key Levels and Targets
Trendline Resistance at $0.70 this is a critical breakout level to watch.
Breakout Confirmation above $0.70 could lead to a significant upward move.
Strategy
Wait for a clear breakout with strong volume above $0.70 for a bullish entry.
Upside potential will depend on market conditions and momentum after the breakout.
Risk Management
Consider placing stop-loss levels below the lower trendline or recent support to manage downside risk. Target prices can be adjusted as the breakout unfolds, monitoring resistance zones.
Insights
Symmetrical triangles often indicatecontinuation, and this setup leans bullish. However, always confirm with volume for stronger conviction. Stay alert for false breakouts or a downside breach if momentum fades.

STORJ buy/long setup (12H)It seems that STORJ is forming a Diametric pattern and is currently at the end of wave D.
Buy/long positions can be considered around the green zone.
The targets are marked on the chart. targets: 0.5995 and 0.6733
The analysis will be invalidated if a daily candle closes below the invalidation level.
For risk management, please don't forget stop loss and capital management
Comment if you have any questions
Thank You

STORJUSDT 1WSTORJ ~ 1W
#STORJ If you still have Conviction on this coin,. This support block would be a very good buying place for now,. Buy in stages with a minimum term target of 20%++

Storj can make 74% gains just by reaching this invh&s targetStorj looks very close to completing the right shoulder of this inverse head and shoulders pattern here. 74% gains off one pattern s nothing to sneeze at. *not financial advice*

Storj building a mad moveStorj loves to make a big run, has the look of a coin priming itself for a mega move.

STORJ / USDT Set for a Bullish Breakout! Key Targets in Sight!STORJ/USDT Technical Analysis:
On the 1-hour timeframe, STORJ has confirmed a long trade entry at 0.4484. The bullish momentum is backed by the Risological Dotted Trendline , which signals a strong upward trend. This setup shows potential for a series of target achievements as the price inches closer to critical profit levels.
Trade Summary:
Entry Level: 0.4484
Target Levels:
TP1: 0.4800
TP2: 0.5310
TP3: 0.5820
TP4: 0.6135
Stop Loss: 0.4229
With initial target levels approaching, STORJ’s momentum could bring gains as it heads toward the upper profit marks. Watch for further bullish action!

STORJ-USDT Technical AnalysisThe price of STORJ is in a downtrend and has been trading within a descending channel since March 2024, with the price consistently making lower highs. This downtrend is defined by a descending channel upper trendline that has acted as resistance multiple times and a lower trendline acted as support. Recently, the price has started to push upward, and this upper boundary of the descending channel is being tested again, suggesting a potential test of the downtrend resistance.
Several key support and resistance levels are visible on the chart. The most immediate resistance lies in the descending channel upper boundary, $0.3937 level, with a resistance zone (Green) at $0.4299 - $0.4420 just above. If the price manages to break through here, it could target higher resistance levels, such as $0.4947 the major resistance zone (Pink) at $0.5830 - $0.6110, and so on, all the levels are marked in the chart. These levels have historically seen strong selling pressure.
On the downside, strong support (Purple) at $0.3420 - $0.3501, where the price recently found support and began its current upward movement. Further support zone (Yellow) at $0.3003 - $0.3099 and the ultimate low at $0.2584, which acted as a base for a previous bounce. If the price fails to break resistance, it could retrace to these lower levels.
Overall, STORJ/USDT is at a critical juncture. A break above the downtrend and key resistance zones would indicate a potential shift in momentum to the upside. However, failure to break these levels could result in a continuation of the downtrend, with price retesting key support zones. The next few days will be crucial in determining the future direction of the pair.
Everything is on the chart

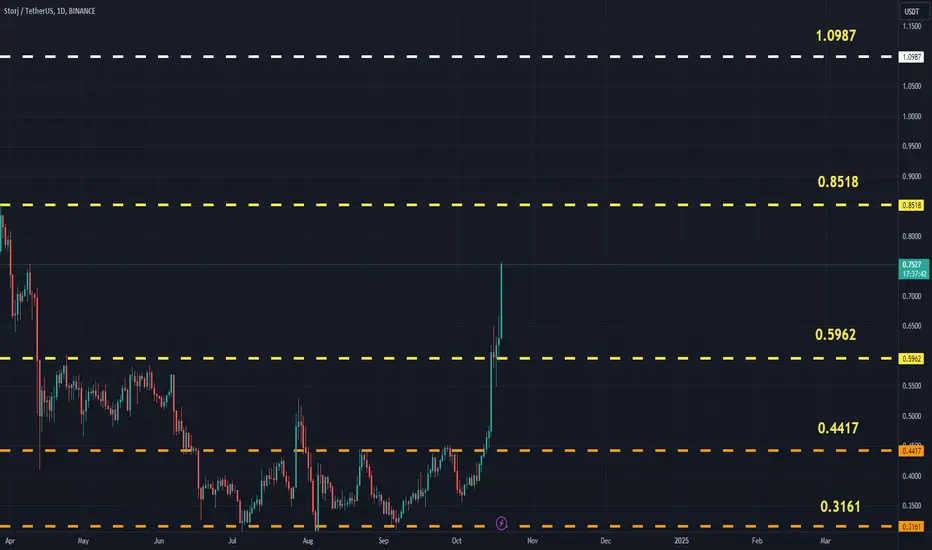
STORJUSDT (Storj) Updated till 19-10-24STORJUSDT (Storj) Daily timeframe range. pushing hard from its local low. not far away from its mid 0.8518 resistance. there are not much of holdup if volume dont drops it can continue. recent support at 0.5962.
#STORJ/USDT#STORJ
The price is moving in a descending channel on the 4-hour frame
And it is sticking to it well
We have a bounce from the lower limit of the descending channel and we are now touching this support at a price of 0.3600
We have a downtrend on the RSI indicator that is about to be broken, which supports the rise
We have a trend to stabilize above the moving average 100
Entry price 0.3940
First target 0.4390
Second target 0.4720
Third target 0.5092

STORJ ANALYSIS (4H)Storj seems to have entered a diametric recently.
We now seem to be in wave F of this diametric.
We are looking for buy/long positions in the green range.
The targets are inserted on the image.
Closing a daily candle below the invalidation level will violate the analysis.
For risk management, please don't forget stop loss and capital management
When we reach the first target, save some profit and then change the stop to entry
Comment if you have any questions
Thank You

STORJ/USDT Breakout Alert: Ready for a Major Move!Hey everyone!
If you're enjoying this analysis, don’t forget to give it a thumbs up and follow for more!
STORJ is looking strong here! It has just broken out of a descending triangle on the 2-day time frame and is showing great potential for an ATH (All-Time High). This could be the perfect opportunity to buy and accumulate on dips for big gains.
Entry range: CMP and accumulate up to $0.42
Targets: 150% - 200% upside 📈
Stop Loss (SL): $0.33
What do you think of STORJ's current price action? Are you seeing a bullish setup? Share your thoughts and analysis in the comments below!
