STORJ/ USDT - SHORT SET-UP 📊 Key Technical Insights
1. Price Structure
Price recently rejected near 0.2550–0.2575 zone (supply/resistance).
Lower highs forming, indicating bearish market structure.
Current price (~0.2444) is just under minor resistance, which may confirm the start of a new leg down.
2. Risk-Reward Ratio
Risk: ~0.0131 (from 0.2444 to 0.2575)
Reward: ~0.0258 (from 0.2444 to 0.2186)
RRR: ~1:2 — Good risk-to-reward ratio.
3. Support Zones
Minor support: 0.2330–0.2300 area — could act as TP1.
Major support (TP2): 0.2186 — aligns with historical price reaction.
4. Candlestick Behavior
Rejection wicks seen near the 0.2550 zone, confirming supply presence.
Recent candles show selling pressure dominating.
---
📉 Trade Plan Summary
Component Level
Sell Entry ~0.2444
Stop Loss 0.2575
TP1 ~0.2300
TP2 (Main) 0.2186
Trend Bearish
---
✅ Confluences Supporting the Short Setup
Double/triple top formation around 0.2570.
Lower highs and bearish market structure.
Price rejected strongly from resistance zone.
Clean support zones below offer logical targets.
---
🚨 Caution
If price breaks and closes above 0.2575 with strength, the bearish setup becomes invalid.
Watch for fakeouts or consolidation between 0.2400–0.2500.
STORJUSDT

STORJUSDT 1W Analysis STORJ ~ 1W Analysis
#STORJ This is the closest support for now. Buy if you still have confidence in this coin with a short term target of at least 20%+ from this support.

STORJUSDT 1D AnalysisSTORJ ~ 1D Analysis
#STORJ Buy gradually from here if you still have confidence in this coin with a short term target of at least 10%++
SOLUSDT UPDATE
Pattern: Falling Wedge Breakout
Current Price: \$173.38
Target Price: \$300
Target % Gain: 105.90%
Technical Analysis: SOL has broken out of a falling wedge pattern on the daily chart, indicating a bullish reversal. Strong momentum and breakout confirmation suggest a potential move towards the \$300 level.
Time Frame: 1D
Risk Management Tip: Always use proper risk management.

#STORJ/USDT#STORJ
The price is moving within a descending channel on the 1-hour frame, adhering well to it, and is on its way to breaking it strongly upwards and retesting it.
We are seeing a bounce from the lower boundary of the descending channel, which is support at 0.3060.
We have a downtrend on the RSI indicator that is about to break and retest, supporting the upward trend.
We are looking for stability above the 100 moving average.
Entry price: 0.3090
First target: 0.3125
Second target: 0.3170
Third target: 0.3231

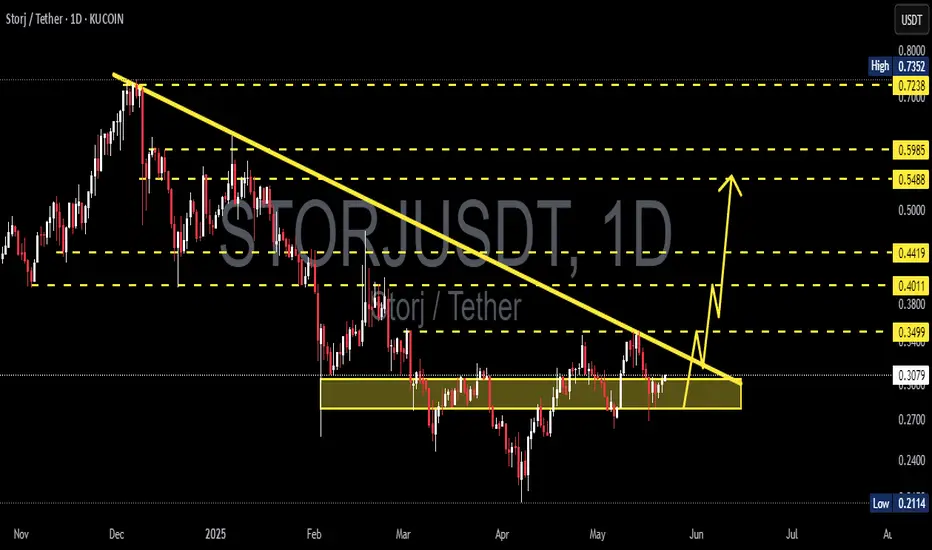
Storj —Strong Move Ahead (Easy 100-200% Profits Potential)The inverted triangles depict the bottom. After Storj moved above the 3-Feb low and broke the downtrend we entered bullish territory.
The chart was bullish when the bottom hit 7-April and we can predict a recovery, but this is only a prediction. When the action moves decisively above support, and growth starts to happen above support, then the bullish bias is fully confirmed. This is exactly what is happening here.
» STORJUSDT is trading above support and is ready to grow. This chart shows the potential for a 100-200% move to develop in the coming days. It can start within days and take only a few weeks to fully develop. This will only be the start.
After this initial strong bullish breakout, we will see growth long-term. Higher highs and higher lows. The 2025 Cryptocurrency—Altcoins bull market.
Thank you for reading.
Namaste.

STORJUSDT 1D AnalysisSTORJ ~ 1D Analysis
#STORJ Looks very bullish after successfully penetrating this resistant line.

Storj Breaking out Expecting Solid Bullish Rally Storj Chart Looking Very Good For Midterm, Testing Falling Wedge (Trendline Resistance) Successful Breakout Can Lead Solid Bullish Rally Towards 0.50$ In Coming Days.

STORJUSDT buy/long (1W)STORJ is approaching a strong origin level on the weekly timeframe.
This origin has already been tapped once, but there should still be significant BUY orders remaining in this zone.
A liquidity pool has also been built up. We expect a strong reaction from this area.
We are looking for BUY/LONG positions around the demand zone, especially near the optimized entry.
A weekly candle close below the invalidation level would invalidate this setup.
Do not enter the position without capital management and stop setting
Comment if you have any questions
thank you

SEIUSDT UPDATESEIUSDT is a cryptocurrency trading at $0.1700, with a target price of $0.4500. This represents a potential gain of over 200%. The technical pattern observed is a Bullish Falling Wedge, indicating a possible trend reversal. This pattern suggests that the downward trend may be coming to an end. A breakout from the wedge could lead to a significant upward movement in price. The Bullish Falling Wedge is a positive indicator, signaling a potential price surge. Investors are showing optimism about SEIUSDT's future performance. The current price may present a buying opportunity. Reaching the target price would result in substantial returns for investors. SEIUSDT is positioned for a potential breakout and significant gains.

TAOUSDT UPDATETAOUSDT is a cryptocurrency trading at $231.9, with a target price of $360.0. This represents a potential gain of over 60%. The technical pattern observed is a Bullish Falling Wedge, indicating a possible trend reversal. This pattern suggests that the downward trend may be coming to an end. A breakout from the wedge could lead to a significant upward movement in price. The Bullish Falling Wedge is a positive indicator, signaling a potential price surge. Investors are showing optimism about TAOUSDT's future performance. The current price may present a buying opportunity. Reaching the target price would result in substantial returns for investors. TAOUSDT is positioned for a potential breakout and significant gains.

UNIUSDT UPDATEUNIUSDT is a cryptocurrency trading at $6.780. Its target price is $10.000, indicating a potential 50%+ gain. The pattern is a Bullish Falling Wedge, a reversal pattern signaling a trend change. This pattern suggests the downward trend may be ending. A breakout from the wedge could lead to a strong upward move. The Bullish Falling Wedge is a positive signal, indicating a potential price surge. Investors are optimistic about UNIUSDT's future performance. The current price may be a buying opportunity. Reaching the target price would result in significant returns. UNIUSDT is poised for a potential breakout and substantial gains.

KDAUSDT UPDATEKDAUSDT is a cryptocurrency trading at $0.4898. Its target price is $0.8000, indicating a potential 90%+ gain. The pattern is a Bullish Falling Wedge, a reversal pattern signaling a trend change. This pattern suggests the downward trend may be ending. A breakout from the wedge could lead to a strong upward move. The Bullish Falling Wedge is a positive signal, indicating a potential price surge. Investors are optimistic about KDAUSDT's future performance. The current price may be a buying opportunity. Reaching the target price would result in significant returns. KDAUSDT is poised for a potential breakout and substantial gains.

DOTUSDT IDEADOTUSDT is a cryptocurrency trading at $4.415. Its target price is $7.500, indicating a potential 70%+ gain. The pattern is a Bullish Falling Wedge, a reversal pattern signaling a trend change. This pattern suggests the downward trend may be ending. A breakout from the wedge could lead to a strong upward move. The Bullish Falling Wedge is a positive signal, indicating a potential price surge. Investors are optimistic about DOTUSDT's future performance. The current price may be a buying opportunity. Reaching the target price would result in significant returns. DOTUSDT is poised for a potential breakout and substantial gains.

METISUSDT UPDATEMETISUSDT is a cryptocurrency trading at $17.57. Its target price is $32.00, indicating a potential 80%+ gain. The pattern is a Bullish Falling Wedge, a reversal pattern signaling a trend change. This pattern suggests the downward trend may be ending. A breakout from the wedge could lead to a strong upward move. The Bullish Falling Wedge is a positive signal, indicating a potential price surge. Investors are optimistic about METISUSDT's future performance. The current price may be a buying opportunity. Reaching the target price would result in significant returns. METISUSDT is poised for a potential breakout and substantial gains.

FIDAUSDT UPDATEFIDAUSDT is a cryptocurrency trading at $0.1094. Its target price is $0.2400, indicating a potential 100%+ gain. The pattern is a Bullish Falling Wedge, a reversal pattern signaling a trend change. This pattern suggests the downward trend may be ending. A breakout from the wedge could lead to a strong upward move. The Bullish Falling Wedge is a positive signal, indicating a potential price surge. Investors are optimistic about FIDAUSDT's future performance. The current price may be a buying opportunity. Reaching the target price would result in significant returns. FIDAUSDT is poised for a potential breakout and substantial gains.

ACAUSDT UPDATEACAUSDT is a cryptocurrency trading at $0.0430. Its target price is $0.0800, indicating a potential 80%+ gain. The pattern is a Bullish Falling Wedge, a reversal pattern signaling a trend change. This pattern suggests the downward trend may be ending. A breakout from the wedge could lead to a strong upward move. The Bullish Falling Wedge is a positive signal, indicating a potential price surge. Investors are optimistic about ACAUSDT's future performance. The current price may be a buying opportunity. Reaching the target price would result in significant returns. ACAUSDT is poised for a potential breakout and substantial gains.

DGBUSDT UPDATEDGBUSDT is a cryptocurrency trading at $0.00926. Its target price is $0.01500, indicating a potential 70%+ gain. The pattern is a Bullish Falling Wedge, a reversal pattern signaling a trend change. This pattern suggests the downward trend may be ending. A breakout from the wedge could lead to a strong upward move. The Bullish Falling Wedge is a positive signal, indicating a potential price surge. Investors are optimistic about DGBUSDT's future performance. The current price may be a buying opportunity. Reaching the target price would result in significant returns. DGBUSDT is poised for a potential breakout and substantial gains.

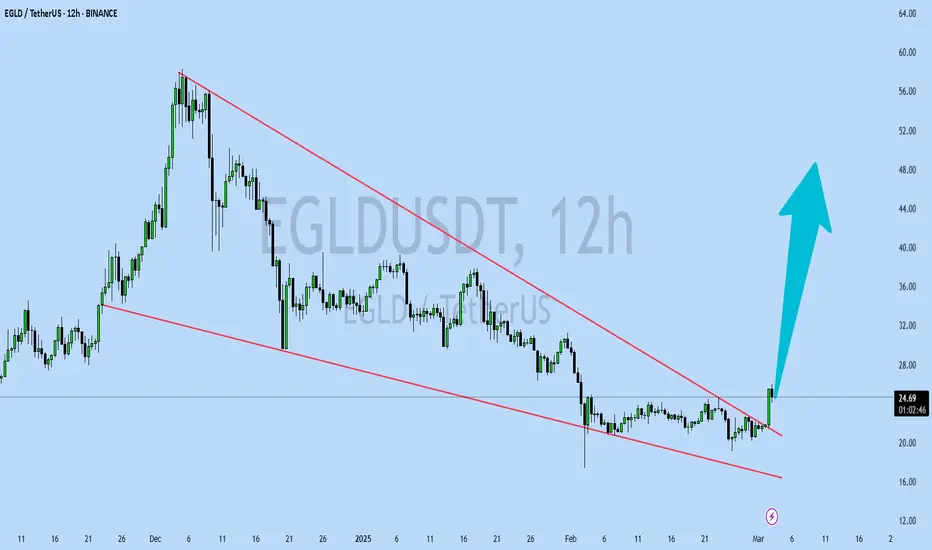
EGLDUSDT UPDATEEGLDUSDT is a cryptocurrency trading at $24.65. Its target price is $48.00, indicating a potential 90%+ gain. The pattern is a Bullish Falling Wedge, a reversal pattern signaling a trend change. This pattern suggests the downward trend may be ending. A breakout from the wedge could lead to a strong upward move. The Bullish Falling Wedge is a positive signal, indicating a potential price surge. Investors are optimistic about EGLDUSDT's future performance. The current price may be a buying opportunity. Reaching the target price would result in significant returns. EGLDUSDT is poised for a potential breakout and substantial gains.
STORJUSDT 1WSTORJ ~ 1W Analysis
#STORJ Buy gradually from here with a short -term target of at least 20%+.
reason, this support continues to be maintained so far.

STXUSDT UPDATESTXUSDT is a cryptocurrency trading at $0.900. Its target price is $1.600, indicating a potential 90%+ gain. The pattern is a Bullish Falling Wedge, a reversal pattern signaling a trend change. This pattern suggests the downward trend may be ending. A breakout from the wedge could lead to a strong upward move. The Bullish Falling Wedge is a positive signal, indicating a potential price surge. Investors are optimistic about STXUSDT's future performance. The current price may be a buying opportunity. Reaching the target price would result in significant returns. STXUSDT is poised for a potential breakout and substantial gains.

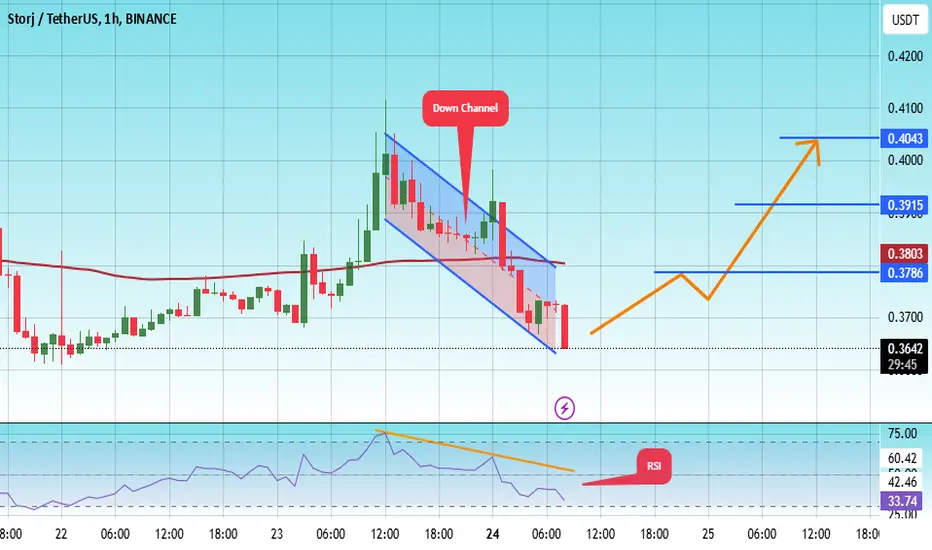
#STORJ/USDT#STORJ
The price is moving in a descending channel on the 1-hour frame and is adhering to it well and is heading to break it strongly upwards and retest it
We have a bounce from the lower limit of the descending channel, this support is at a price of 0.3630
We have a downtrend on the RSI indicator that is about to break and retest, which supports the rise
We have a trend to stabilize above the moving average 100
Entry price 0.3653
First target 0.3786
Second target 0.3915
Third target 0.14043
BBUSDT UPDATEBBUSDT is a cryptocurrency trading at $0.1729. Its target price is $0.3500, indicating a potential 100%+ gain. The pattern is a Bullish Falling Wedge, a reversal pattern signaling a trend change. This pattern suggests the downward trend may be ending. A breakout from the wedge could lead to a strong upward move. The Bullish Falling Wedge is a positive signal, indicating a potential price surge. Investors are optimistic about BBUSDT's future performance. The current price may be a buying opportunity. Reaching the target price would result in significant returns. BBUSDT is poised for a potential breakout and substantial gains.
