Greed Alert: STOXX 50 Momentum Signals But Caution Needed🚨 STOXX50 RESISTANCE BREAKOUT PLAY! 💥 | THIEF TRADER STYLE 🔓📈
🧠 Thief Trader Master Plan: BULLISH ATTACK
🎯 Entry: Breakout above 5420 (Major RESISTANCE WALL 🧱)
🛑 Stop Loss: 5330 — Strict risk control, no funny business 😤
🚀 Target: 5560 — Smart money aims high 💰
👀 We spotted a strong momentum brewing — bulls are charging to break through the ceiling. Once 5420 cracks, it's game on.
🔥 Watch the levels, respect the trade, and let’s rob the market clean 💼💸
🧠 Market Sentiment Outlook
Retail Traders
🐂 Bullish: 55%
🐻 Bearish: 35%
😐 Neutral: 10%
Institutional Traders
🐂 Bullish: 60%
🐻 Bearish: 30%
😐 Neutral: 10%
😨😍 Fear & Greed Index
Score: 69/100 → Greed 🤠
Insight: Market tilts toward optimism — but tread carefully; overvaluation risks are real.
📈 Fundamental Strength Score
Score: 72/100
Drivers:
💰 Earnings Surge – AB InBev (+8.7%), Munich RE (+4.8%)
📉 Stable Eurozone Data
🚀 Momentum Building – STOXX 50 approaching all-time highs
🌍 Macro Economic Score
Score: 65/100
Factors:
⚖️ Tariff Delays – U.S. tariffs on Canada/Mexico pushed to April 2
📅 Eurozone PMI Preview
🌎 Tensions Rising – U.S.–Iran geopolitical friction
🔎 Key Highlights
🧠 Sentiment Check: Greedy mood – watch for pullbacks
💼 Earnings Season: Q2 winners driving index higher
⚠️ Volatility Triggers: Geopolitics + tariff policy
📉 Opportunity Alert: Fear score <20? Historically undervalued zone
📊 Technical Signal: STOXX 50 >125-day MA = uptrend confirmed
🧭 Always combine real-time data with sound technical and fundamental insights.
📌 Stay informed. Stay sharp. 🚀
💬 Drop your thoughts below.
❤️ SMASH that like button if this helped you.
👥 Support the Thief Trader team — we're in this to help you win.
📡 Stay sharp. Stay ruthless. Stay profitable.
— Thief Trader 🔐📊
Stoxx50

Stoxx Key Trading Levels Key Support and Resistance Levels
Resistance Level 1: 5465
Resistance Level 2: 5500
Resistance Level 3: 5530
Support Level 1: 5255
Support Level 2: 5200
Support Level 3: 5155
This communication is for informational purposes only and should not be viewed as any form of recommendation as to a particular course of action or as investment advice. It is not intended as an offer or solicitation for the purchase or sale of any financial instrument or as an official confirmation of any transaction. Opinions, estimates and assumptions expressed herein are made as of the date of this communication and are subject to change without notice. This communication has been prepared based upon information, including market prices, data and other information, believed to be reliable; however, Trade Nation does not warrant its completeness or accuracy. All market prices and market data contained in or attached to this communication are indicative and subject to change without notice.
Stoxx50 sideways consolidation continuesKey Support and Resistance Levels
Resistance Level 1: 5464
Resistance Level 2: 5500
Resistance Level 3: 5580
Support Level 1: 5152
Support Level 2: 5097
Support Level 3: 5044
This communication is for informational purposes only and should not be viewed as any form of recommendation as to a particular course of action or as investment advice. It is not intended as an offer or solicitation for the purchase or sale of any financial instrument or as an official confirmation of any transaction. Opinions, estimates and assumptions expressed herein are made as of the date of this communication and are subject to change without notice. This communication has been prepared based upon information, including market prices, data and other information, believed to be reliable; however, Trade Nation does not warrant its completeness or accuracy. All market prices and market data contained in or attached to this communication are indicative and subject to change without notice.

Stoxx sideways consolidation Key Support and Resistance Levels
Resistance Level 1: 5464
Resistance Level 2: 5500
Resistance Level 3: 5580
Support Level 1: 5152
Support Level 2: 5097
Support Level 3: 5044
This communication is for informational purposes only and should not be viewed as any form of recommendation as to a particular course of action or as investment advice. It is not intended as an offer or solicitation for the purchase or sale of any financial instrument or as an official confirmation of any transaction. Opinions, estimates and assumptions expressed herein are made as of the date of this communication and are subject to change without notice. This communication has been prepared based upon information, including market prices, data and other information, believed to be reliable; however, Trade Nation does not warrant its completeness or accuracy. All market prices and market data contained in or attached to this communication are indicative and subject to change without notice.
STOXX "Double Top" resistance retest at 5335The SOXX50 remains in a bullish trend, with recent price action showing signs of a corrective pullback within the broader uptrend.
Support Zone: 5200 – a key level from previous consolidation. Price is currently testing or approaching this level.
A bullish rebound from 5200 would confirm ongoing upside momentum, with potential targets at:
5335 – initial resistance
5400 – psychological and structural level
5470 – extended resistance on the longer-term chart
Bearish Scenario:
A confirmed break and daily close below 5200 would weaken the bullish outlook and suggest deeper downside risk toward:
5155– minor support
5090 – stronger support and potential demand zone
Outlook:
Bullish bias remains intact while the STOXX50 holds above 5200. A sustained break below this level could shift momentum to the downside in the short term.
This communication is for informational purposes only and should not be viewed as any form of recommendation as to a particular course of action or as investment advice. It is not intended as an offer or solicitation for the purchase or sale of any financial instrument or as an official confirmation of any transaction. Opinions, estimates and assumptions expressed herein are made as of the date of this communication and are subject to change without notice. This communication has been prepared based upon information, including market prices, data and other information, believed to be reliable; however, Trade Nation does not warrant its completeness or accuracy. All market prices and market data contained in or attached to this communication are indicative and subject to change without notice.

Stoxx50 Bearish reversal resistance at 5,325The Stoxx50 equity index is exhibiting bearish price action sentiment, consistent with the prevailing downtrend. Recent movements show signs of a corrective pullback, suggesting temporary relief within a broader downward structure.
Key Technical Levels:
Resistance:
5,325 – Critical resistance level; previously acted as an intraday consolidation zone.
5,384 – Intermediate resistance following a breakout.
5,500 – Key psychological and technical level; previous swing high.
Support:
5,150 – Initial downside target if the pullback fails.
5,090 – Secondary support, aligning with past reaction lows.
5,040 – Long-term support level, near a broader demand zone.
Scenario Analysis:
Bearish Continuation (Base Case):
A rally toward 5,325 that fails to produce a sustained breakout, followed by a bearish rejection, would confirm the corrective nature of the current bounce. This scenario reinforces the downside bias, targeting a decline toward 5,150, then 5,090, and potentially 5,040 over a longer timeframe.
Bullish Reversal (Alternative Scenario):
A confirmed breakout above 5,325, especially with a daily close above this level, would invalidate the immediate bearish outlook. This would shift sentiment to neutral-bullish, opening the door for a potential retest of 5,384 and an extended rally toward the 5,500 level.
Conclusion:
The technical structure of the Stoxx50 remains bearish in the short to medium term, with current price action reflecting a corrective rally rather than a trend reversal. Traders should watch the 5,325 level closely: failure to break above it reinforces downside potential, while a decisive breakout could signal a shift toward a bullish recovery.
This communication is for informational purposes only and should not be viewed as any form of recommendation as to a particular course of action or as investment advice. It is not intended as an offer or solicitation for the purchase or sale of any financial instrument or as an official confirmation of any transaction. Opinions, estimates and assumptions expressed herein are made as of the date of this communication and are subject to change without notice. This communication has been prepared based upon information, including market prices, data and other information, believed to be reliable; however, Trade Nation does not warrant its completeness or accuracy. All market prices and market data contained in or attached to this communication are indicative and subject to change without notice.

STOXX50 INTRADAY Bullish sideways consolidationTrend: Overall trend remains bullish, supported by rising price action.
Recent Movement: Price is in a sideways consolidation phase after a strong uptrend.
Key Levels
Support:
5310 – Key level from prior consolidation.
5275, then 5230 – Next supports if 5310 breaks.
Resistance:
5480 – First upside target.
5510, then 5565 – Further resistance levels on continued strength.
Trading Scenarios
Bullish Scenario:
A pullback to 5310 followed by a bounce could lead to a move towards 5480, then higher to 5510 and 5565.
Bearish Scenario:
A confirmed break and daily close below 5310 would weaken the bullish case. In that case, expect a potential drop to 5275, then 5230.
Conclusion
The FTSE remains bullish, but a short-term pullback is possible. A bounce from 5310 would confirm trend strength. Watch 5310 closely — holding above favours bulls; a break below shifts sentiment to bearish.
This communication is for informational purposes only and should not be viewed as any form of recommendation as to a particular course of action or as investment advice. It is not intended as an offer or solicitation for the purchase or sale of any financial instrument or as an official confirmation of any transaction. Opinions, estimates and assumptions expressed herein are made as of the date of this communication and are subject to change without notice. This communication has been prepared based upon information, including market prices, data and other information, believed to be reliable; however, Trade Nation does not warrant its completeness or accuracy. All market prices and market data contained in or attached to this communication are indicative and subject to change without notice.

STOXX INTRADAY consolidation key support at 5310Trend: Overall trend remains bullish, supported by rising price action.
Recent Movement: Price is in a sideways consolidation phase after a strong uptrend.
Key Levels
Support:
5310 – Key level from prior consolidation.
5275, then 5230 – Next supports if 5310 breaks.
Resistance:
5480 – First upside target.
5510, then 5565 – Further resistance levels on continued strength.
Trading Scenarios
Bullish Scenario:
A pullback to 5310 followed by a bounce could lead to a move towards 5480, then higher to 5510 and 5565.
Bearish Scenario:
A confirmed break and daily close below 5310 would weaken the bullish case. In that case, expect a potential drop to 5275, then 5230.
Conclusion
The FTSE remains bullish, but a short-term pullback is possible. A bounce from 5310 would confirm trend strength. Watch 5310 closely — holding above favours bulls; a break below shifts sentiment to bearish.
This communication is for informational purposes only and should not be viewed as any form of recommendation as to a particular course of action or as investment advice. It is not intended as an offer or solicitation for the purchase or sale of any financial instrument or as an official confirmation of any transaction. Opinions, estimates and assumptions expressed herein are made as of the date of this communication and are subject to change without notice. This communication has been prepared based upon information, including market prices, data and other information, believed to be reliable; however, Trade Nation does not warrant its completeness or accuracy. All market prices and market data contained in or attached to this communication are indicative and subject to change without notice.

"STOXX50/EURO50" Trading Plan: Ride the Wave or Get Trapped?🚨 EUROPEAN INDEX HEIST: STOXX50 Breakout Robbery Plan (Long Setup) 🚨
🌟 Hi! Hola! Ola! Bonjour! Hallo! Marhaba! 🌟
Attention Market Bandits & Index Robbers! 🏦💶💸
Using 🔥Thief Trading tactics🔥, we're targeting the STOXX50/EURO50 for a clean breakout heist. The plan? Go long and escape before the MA trap snaps shut. Overbought? Yes. Risky? Absolutely. But real thieves profit when weak hands panic. Take your cut and run! 🏆💰
📈 ENTRY: TIME TO STRIKE!
Wait for MA breakout at 5460.00 → Then move fast!
Buy Stop Orders: Place above Moving Average
Buy Limit Orders: Sneak in on 15M/30M pullbacks
Pro Tip: Set a BREAKOUT ALARM - don't miss the action!
🛑 STOP LOSS: DON'T GET CAUGHT!
For Buy Stop Orders: Never set SL pre-breakout - amateurs get burned!
Thief's Safe Zone: Recent swing low (5300.00 on 4H chart)
Rebels: Place SL wherever... but don't cry later! 😈
🏴☠️ TARGET: 5680.00 (OR ESCAPE EARLY!)
Scalpers: Long only! Trail your SL like a pro
Swing Traders: Ride this heist for max gains
💶 MARKET CONTEXT: BULLISH BUT TRAPPY
Fundamentals: Macro data, COT reports, Quant analysis
Market Sentiment: Intermarket flows, positioning
Full Analysis: Check our bio0 linkss 👉🔗 (Don't trade blind!)
⚠️ WARNING: NEWS = VOLATILITY TRAP!
Avoid new trades during high-impact news
Lock profits with trailing stops - greed gets you caught!
💥 SUPPORT THE HEIST!
Smash that Boost Button 💖→ Stronger crew = bigger scores!
Steal profits daily with the Thief Trading Style 🎯🚀
Next heist coming soon... stay sharp! 🤑🐱👤🔥

STOXX INTRADAY uptrend continuation supported at 5310Trend: Overall trend remains bullish, supported by rising price action.
Recent Movement: Price is in a sideways consolidation phase after a strong uptrend.
Key Levels
Support:
5310 – Key level from prior consolidation.
5275, then 5230 – Next supports if 5310 breaks.
Resistance:
5480 – First upside target.
5510, then 5565 – Further resistance levels on continued strength.
Trading Scenarios
Bullish Scenario:
A pullback to 5310 followed by a bounce could lead to a move towards 5480, then higher to 5510 and 5565.
Bearish Scenario:
A confirmed break and daily close below 5310 would weaken the bullish case. In that case, expect a potential drop to 5275, then 5230.
Conclusion
The FTSE remains bullish, but a short-term pullback is possible. A bounce from 5310 would confirm trend strength. Watch 5310 closely — holding above favours bulls; a break below shifts sentiment to bearish.
This communication is for informational purposes only and should not be viewed as any form of recommendation as to a particular course of action or as investment advice. It is not intended as an offer or solicitation for the purchase or sale of any financial instrument or as an official confirmation of any transaction. Opinions, estimates and assumptions expressed herein are made as of the date of this communication and are subject to change without notice. This communication has been prepared based upon information, including market prices, data and other information, believed to be reliable; however, Trade Nation does not warrant its completeness or accuracy. All market prices and market data contained in or attached to this communication are indicative and subject to change without notice.

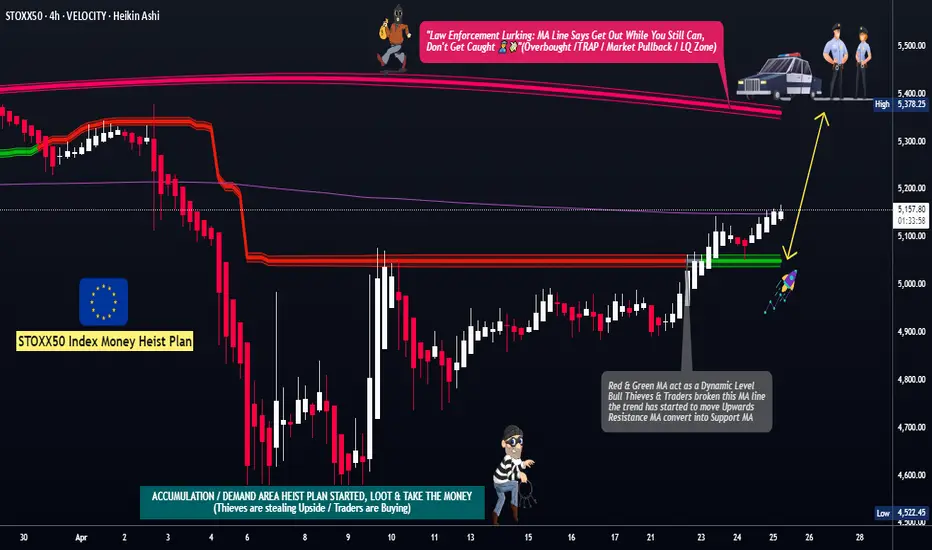
"STOXX50/EURO50" Index Market Money Heist (Day Trade)🌟Hi! Hola! Ola! Bonjour! Hallo! Marhaba!🌟
Dear Money Makers & Robbers, 🤑 💰💸✈️
Based on 🔥Thief Trading style technical and fundamental analysis🔥, here is our master plan to heist the "STOXX50/EURO50" Index Market. Please adhere to the strategy I've outlined in the chart, which emphasizes long entry. Our aim is the high-risk Moving Average Line area. It's a Risky level, overbought market, consolidation, trend reversal, trap at the level where traders and bearish robbers are stronger. 🏆💸"Take profit and treat yourself, traders. You deserve it!💪🏆🎉
Entry 📈 : "The vault is wide open! Swipe the Bullish loot at any price - the heist is on!
however I advise to Place buy limit orders within a 15 or 30 minute timeframe nearest or swing low or high level for pullback entries.
Stop Loss 🛑:
📍 Thief SL placed at the recent/swing low level Using the 1H timeframe (4900) Day/Swing trade basis.
📍 SL is based on your risk of the trade, lot size and how many multiple orders you have to take.
Target 🎯: 5370
🧲Scalpers, take note 👀 : only scalp on the Long side. If you have a lot of money, you can go straight away; if not, you can join swing traders and carry out the robbery plan. Use trailing SL to safeguard your money 💰.
💰💵💸"STOXX50/EURO50" Index Market Heist Plan (Swing/Day Trade) is currently experiencing a Bullish trend.., driven by several key factors.☝☝☝
📰🗞️Get & Read the Fundamental, Macro Economics, COT Report, Geopolitical and News Analysis, Sentimental Outlook, Intermarket Analysis, Index-Specific Analysis, Future trend targets with Overall outlook score... go ahead to check 👉👉👉🔗🔗
⚠️Trading Alert : News Releases and Position Management 📰 🗞️ 🚫🚏
As a reminder, news releases can have a significant impact on market prices and volatility. To minimize potential losses and protect your running positions,
we recommend the following:
Avoid taking new trades during news releases
Use trailing stop-loss orders to protect your running positions and lock in profits
💖Supporting our robbery plan 💥Hit the Boost Button💥 will enable us to effortlessly make and steal money 💰💵. Boost the strength of our robbery team. Every day in this market make money with ease by using the Thief Trading Style.🏆💪🤝❤️🎉🚀
I'll see you soon with another heist plan, so stay tuned 🤑🐱👤🤗🤩
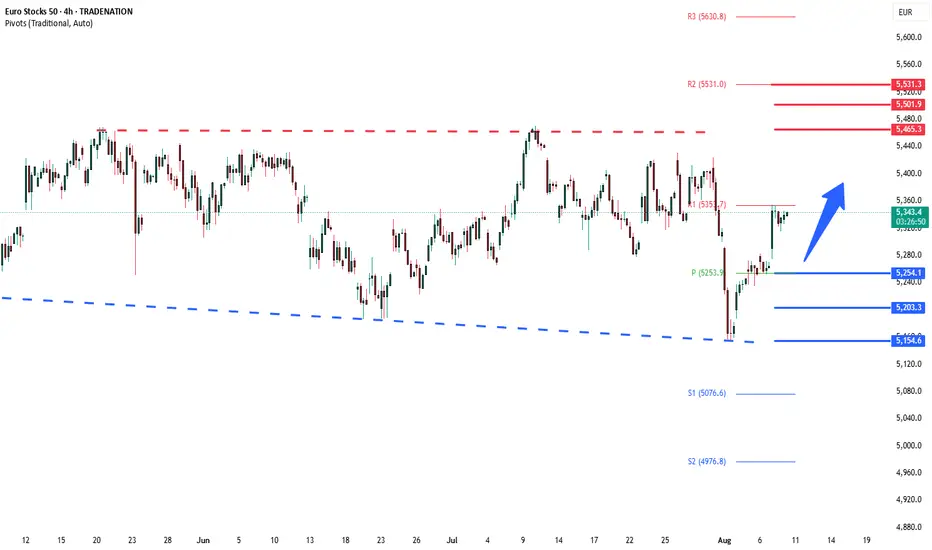
STOXX INTRADAY bullish trend supported at 5225Key Support and Resistance Levels
Resistance Level 1: 5345
Resistance Level 2: 5375
Resistance Level 3: 5411
Support Level 1: 5225
Support Level 2: 5193
Support Level 3: 5157
This communication is for informational purposes only and should not be viewed as any form of recommendation as to a particular course of action or as investment advice. It is not intended as an offer or solicitation for the purchase or sale of any financial instrument or as an official confirmation of any transaction. Opinions, estimates and assumptions expressed herein are made as of the date of this communication and are subject to change without notice. This communication has been prepared based upon information, including market prices, data and other information, believed to be reliable; however, Trade Nation does not warrant its completeness or accuracy. All market prices and market data contained in or attached to this communication are indicative and subject to change without notice.

"STOXX50/EURO50" Index Market Money Heist (Day / Swing Trade)🌟Hi! Hola! Ola! Bonjour! Hallo! Marhaba!🌟
Dear Money Makers & Robbers, 🤑💰✈️
Based on 🔥Thief Trading style technical and fundamental analysis🔥, here is our master plan to heist the "STOXX50/EURO50" Index CFD Market. Please adhere to the strategy I've outlined in the chart, which emphasizes short entry. Our aim is the high-risk Green MA Zone. Risky level, oversold market, consolidation, trend reversal, trap at the level where traders and bullish robbers are stronger. 🏆💸"Take profit and treat yourself, traders. You deserve it!💪🏆🎉
Entry 📈 : "The heist is on! Wait for the MA breakout then make your move at (4500) - Bearish profits await!"
however I advise to Place sell stop orders above the Moving average (or) after the Support level Place sell limit orders within a 15 or 30 minute timeframe most NEAREST (or) SWING low or high level for Pullback entries.
📌I strongly advise you to set an "alert (Alarm)" on your chart so you can see when the breakout entry occurs.
Stop Loss 🛑: "🔊 Yo, listen up! 🗣️ If you're lookin' to get in on a sell stop order, don't even think about settin' that stop loss till after the breakout 🚀. You feel me? Now, if you're smart, you'll place that stop loss where I told you to 📍, but if you're a rebel, you can put it wherever you like 🤪 - just don't say I didn't warn you ⚠️. You're playin' with fire 🔥, and it's your risk, not mine 👊."
📌Thief SL placed at the nearest/swing High or Low level Using the 4H timeframe (4800) Day/Swing trade basis.
📌SL is based on your risk of the trade, lot size and how many multiple orders you have to take.
Target 🎯: 4200 (or) Escape Before the Target
"STOXX50/EURO50" Index CFD Market Heist Plan (Day / Swing Trade) is currently experiencing a Bearish trend.., driven by several key factors.👇👇👇
📰🗞️Get & Read the Fundamental, Macro, COT Report, Geopolitical and News Analysis, Sentimental Outlook, Intermarket Analysis, Index-Specific Analysis, Positioning and future trend targets... go ahead to check 👉👉👉🔗🔗
⚠️Trading Alert : News Releases and Position Management 📰 🗞️ 🚫🚏
As a reminder, news releases can have a significant impact on market prices and volatility. To minimize potential losses and protect your running positions,
we recommend the following:
Avoid taking new trades during news releases
Use trailing stop-loss orders to protect your running positions and lock in profits
💖Supporting our robbery plan 💥Hit the Boost Button💥 will enable us to effortlessly make and steal money 💰💵. Boost the strength of our robbery team. Every day in this market make money with ease by using the Thief Trading Style.🏆💪🤝❤️🎉🚀
I'll see you soon with another heist plan, so stay tuned 🤑🐱👤🤗🤩

STOXX50 oversold bounce back capped at 5056The STOXX50 Index remains in a bearish structure, with recent price action confirming a break below the prior consolidation zone, indicating potential for further downside.
Key Resistance: 5056 – former support turned resistance, aligning with the intraday consolidation area.
Support Levels:
4645 – near-term target if bearish momentum continues
4548 and 4480 – medium to long-term downside objectives
An oversold bounce may occur, but unless price breaks and closes above 5056 on the daily chart, the bearish outlook remains intact.
Conversely, a confirmed breakout above 5056 would invalidate the bearish bias and open the path to test 5154, with 5237 as a secondary resistance.
Conclusion
The STOXX50 bias is bearish below 5056. Watch for a rejection at that level to confirm downside continuation. A daily close above 5056 would shift the outlook to bullish.
This communication is for informational purposes only and should not be viewed as any form of recommendation as to a particular course of action or as investment advice. It is not intended as an offer or solicitation for the purchase or sale of any financial instrument or as an official confirmation of any transaction. Opinions, estimates and assumptions expressed herein are made as of the date of this communication and are subject to change without notice. This communication has been prepared based upon information, including market prices, data and other information, believed to be reliable; however, Trade Nation does not warrant its completeness or accuracy. All market prices and market data contained in or attached to this communication are indicative and subject to change without notice.

"STOXX50 / EURO 50" Indices Heist Plan (Swing/Day Trade)🌟Hi! Hola! Ola! Bonjour! Hallo! Marhaba!🌟
Dear Money Makers & Robbers, 🤑💰✈️
Based on 🔥Thief Trading style technical and fundamental analysis🔥, here is our master plan to heist the "STOXX50 / EURO 50" Index CFD Market. Please adhere to the strategy I've outlined in the chart, which emphasizes short entry. Our aim is the high-risk Green Zone. Risky level, oversold market, consolidation, trend reversal, trap at the level where traders and bullish robbers are stronger. 🏆💸Book Profits Be wealthy and safe trade.💪🏆🎉
Entry 📈 : "The vault is wide open! Swipe the Bearish loot at any price - the heist is on!
however I advise to Place sell limit orders within a 15 or 30 minute timeframe most recent or swing, low or high level.
Stop Loss 🛑: (5450) Thief SL placed at the recent/swing high or low level Using the 2H timeframe swing / day trade basis.
SL is based on your risk of the trade, lot size and how many multiple orders you have to take.
Target 🎯: 5200 (or) Escape Before the Target
🧲Scalpers, take note 👀 : only scalp on the Short side. If you have a lot of money, you can go straight away; if not, you can join swing traders and carry out the robbery plan. Use trailing SL to safeguard your money 💰.
"STOXX50 / EURO 50" Index CFD Market Heist Plan (Swing/Day) is currently experiencing a bearishness,., driven by several key factors.
📰🗞️Get & Read the Fundamental, Macro, COT Report, Quantitative Analysis, Sentimental Outlook, Intermarket Analysis, Future trend targets.. go ahead to check 🔎👉👉👉🔗
⚠️Trading Alert : News Releases and Position Management 📰 🗞️ 🚫🚏
As a reminder, news releases can have a significant impact on market prices and volatility. To minimize potential losses and protect your running positions,
we recommend the following:
Avoid taking new trades during news releases
Use trailing stop-loss orders to protect your running positions and lock in profits
💖Supporting our robbery plan 💥Hit the Boost Button💥 will enable us to effortlessly make and steal money 💰💵. Boost the strength of our robbery team. Every day in this market make money with ease by using the Thief Trading Style.🏆💪🤝❤️🎉🚀
I'll see you soon with another heist plan, so stay tuned 🤑🐱👤🤗🤩

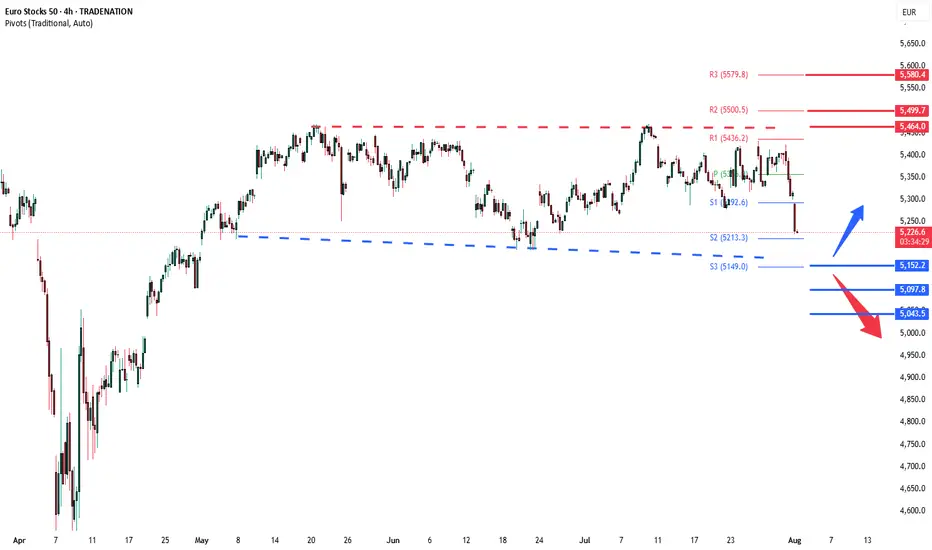
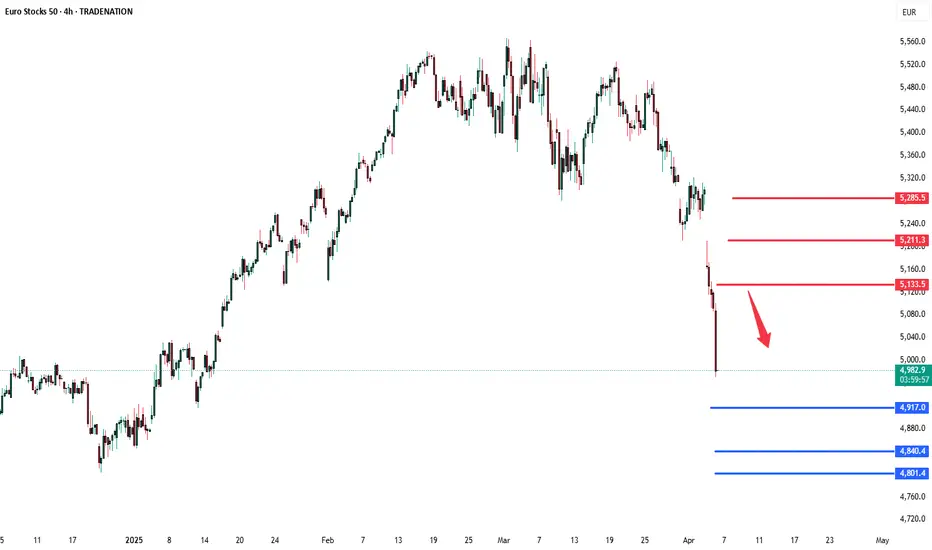
STOXX50 bearish continuation below 5133 The STOXX 50 index maintains a bearish outlook, aligned with the broader downtrend. Recent price action confirms a breakdown below a key consolidation zone, reinforcing the downward pressure.
Key Level: 5133
This level represents the former intraday consolidation zone and now acts as a pivotal resistance.
Bearish Scenario:
An oversold rally toward 5133 followed by a bearish rejection would reinforce downside momentum. If confirmed, this opens the path toward support at 4950, with extended targets at 4917 and 4840 over a longer timeframe.
Bullish Alternative:
A breakout and sustained daily close above 5133 would negate the current bearish setup. This shift could trigger a broader recovery, targeting 5211 initially, followed by a potential move to 5285.
Conclusion:
The technical structure remains bearish while the index trades below 5133. A rejection at this level would confirm further downside potential. Only a decisive break above 5133 would challenge the bearish bias and open the way for a bullish recovery.
This communication is for informational purposes only and should not be viewed as any form of recommendation as to a particular course of action or as investment advice. It is not intended as an offer or solicitation for the purchase or sale of any financial instrument or as an official confirmation of any transaction. Opinions, estimates and assumptions expressed herein are made as of the date of this communication and are subject to change without notice. This communication has been prepared based upon information, including market prices, data and other information, believed to be reliable; however, Trade Nation does not warrant its completeness or accuracy. All market prices and market data contained in or attached to this communication are indicative and subject to change without notice.
STOXX50 Expanding triangle consolidationCurrent Trend: Bullish (Long-term Uptrend)
Pattern Formation: Expanding Triangle (Sideways Consolidation)
Key Support Level: 5283
Key Resistance Levels: 5440, 5500, 5570
Bullish Scenario:
The STOXX 50 remains within a long-term uptrend, with recent price action consolidating in an expanding triangle pattern.
A pullback from current levels could find support at 5283, a key swing low.
A strong bullish bounce from 5283 would confirm the continuation of the uptrend, targeting 5400 as the next resistance level.
A breakout above 5400 could lead to further upside momentum towards 5440, followed by 5500 over the longer term.
Bearish Scenario:
A confirmed breakdown below 5283 with a daily close below this level would invalidate the bullish outlook.
In this scenario, increased selling pressure could push prices lower, with 5211 as the next key support level.
A further decline below 5211 could open the door for an extended retracement towards 5135.
Conclusion:
The STOXX 50 remains in a bullish trend but is consolidating within an expanding triangle. Holding above 5283 keeps the upside bias intact, with potential targets at 5440 and beyond. However, a breakdown below 5283 would shift the sentiment to bearish, signaling further downside risk towards 5211. Traders should monitor price action around the 5283 level for confirmation of either scenario.
This communication is for informational purposes only and should not be viewed as any form of recommendation as to a particular course of action or as investment advice. It is not intended as an offer or solicitation for the purchase or sale of any financial instrument or as an official confirmation of any transaction. Opinions, estimates and assumptions expressed herein are made as of the date of this communication and are subject to change without notice. This communication has been prepared based upon information, including market prices, data and other information, believed to be reliable; however, Trade Nation does not warrant its completeness or accuracy. All market prices and market data contained in or attached to this communication are indicative and subject to change without notice.

EURO50 / STOXX 50 Indices CFD Market Heist Plan🌟Hi! Hola! Ola! Bonjour! Hallo! Marhaba!🌟
Dear Money Makers & Thieves, 🤑 💰🐱👤🚀
Based on 🔥Thief Trading style technical and fundamental analysis🔥, here is our master plan to heist the EURO50 / STOXX 50 Indices CFD Market. Please adhere to the strategy I've outlined in the chart, which emphasizes short entry. Our aim is the high-risk Green Zone. Risky level, oversold market, consolidation, trend reversal, trap at the level where traders and bullish thieves are getting stronger. 🏆💸Book Profits Be wealthy and safe trade.💪🏆🎉
Entry 📈 : "The heist is on! Wait for the breakout (5400) then make your move - Bearish profits await!" however I advise placing Sell Stop Orders below the breakout MA or Place Sell limit orders within a 15 or 30 minute timeframe. Entry from the most recent or Swing high or low level should be in retest.
📌I strongly advise you to set an alert on your chart so you can see when the breakout entry occurs.
Stop Loss 🛑: Thief SL placed at (5450) swing Trade Basis Using the 4H period, the recent / swing high or low level.
SL is based on your risk of the trade, lot size and how many multiple orders you have to take.
Target 🎯:
Primary Target - 5300 (or) Escape Before the Target
Secondary Target - 5130 (or) Escape Before the Target
🧲Scalpers, take note 👀 : only scalp on the Short side. If you have a lot of money, you can go straight away; if not, you can join swing traders and carry out the robbery plan. Use trailing SL to safeguard your money 💰.
📰🗞️Fundamental, Macro, COT Report, Index-Specific Analysis, Sentimental Outlook, Intermarket Analysis, Future Prediction:
EURO50 / STOXX 50 Indices CFD Market is currently experiencing a Neutral trend., driven by several key factors.
🔴Fundamental Analysis
Fundamental factors assess intrinsic drivers:
Economic Growth:
Eurozone GDP at 1.2% (Q4 2024, ECB projection)—modest growth supports equities—mildly bullish.
Corporate Earnings:
STOXX50 firms report 8% year-over-year growth, led by consumer goods and industrials—bullish, though energy lags.
Interest Rates:
ECB at 2.5%, no immediate cuts—real yields (~0.5%) pressure equities—bearish short-term.
Inflation:
HICP at 2.8%—above ECB’s 2% target, aids exporters but squeezes margins—mixed.
Trade Environment:
U.S. tariffs (10% on China) shift trade to Europe—bullish long-term for exporters.
Explanation: Fundamentals lean bullish with earnings and trade gains, but ECB rates and inflation temper short-term upside.
⚪Macroeconomic Factors
Macroeconomic influences on the STOXX50:
Eurozone:
PMI 46.2 (Eurostat)—stagnation persists—bearish.
ECB’s 2.5% rate and stimulus talks—bullish offset.
U.S.:
Fed at 3-3.5%, PCE 2.6%—USD softening (DXY ~105) boosts exports—bullish.
Tariffs disrupt trade—mixed, Eurozone benefits relatively.
Global:
China 4.5%, Japan 1%—slow growth curbs demand—bearish.
Oil $70.44—stable, neutral.
Geopolitical Risk:
Russia-Ukraine tensions—bearish sentiment, bullish for defense stocks.
Explanation: Macro factors are mixed—USD weakness and tariffs favor Europe, but global slowdown and stagnation limit gains.
🟠Commitments of Traders (COT) Data
COT data reflects futures positioning:
Speculators:
Net long ~35,000 contracts (down from 45,000)—cautious bullishness—bullish.
Hedgers:
Net short ~40,000 contracts—stable, profit-taking—neutral.
Open Interest:
~85,000 contracts—steady interest—neutral to bullish.
Explanation: COT shows a market with room for upside, not overbought, supporting a cautiously bullish stance.
🟡Index-Specific Analysis
Factors unique to the STOXX50:
Technical Levels:
50-day SMA ~5,500, 200-day SMA ~5,300—price below 50-day, above 200-day—neutral consolidation.
Support at 5,450, resistance at 5,600—price near support.
Sector Composition:
Financials (20%), industrials (18%), consumer goods (15%)—trade shifts boost financials/industrials—bullish tilt.
Volatility Index (VSTOXX):
18%—±65-point daily swings—neutral risk perception.
Market Breadth:
65% of stocks above 200-day MA—broad participation—mildly bullish.
Explanation: Technicals suggest consolidation, with sectoral strength offering resilience.
🟢Market Sentiment Analysis
Investor and trader mood:
Retail Sentiment:
60% short at 5,480 (social media)—contrarian upside—bullish signal.
Institutional:
J.P. Morgan targets 5,700 by Q4 2025, Citi flags volatility—neutral to bullish.
Corporate:
Hedging at 5,500-5,600—neutral, awaiting clarity.
Social Media:
Bearish short-term (tariff fears), bullish long-term (recovery)—mixed.
Explanation: Sentiment is cautious—retail shorts suggest a potential squeeze, institutional views support longer-term gains.
🔵Geopolitical and News Analysis
Geopolitical events and news:
U.S.-China Trade Tensions:
Trump’s 10% tariff on China (Mar 6)—shifts trade to Europe—bullish for exporters, bearish short-term volatility (Reuters).
Russia-Ukraine Conflict:
Escalation risks (e.g., energy disruptions)—bearish sentiment, bullish for defense (e.g., Airbus)—mixed (Bloomberg, Mar 7).
EU Policy:
ECB projections (Mar 6) cite geopolitical drag—bearish. Defense spending talks—bullish for industrials (ECB.europa.eu).
France-Germany:
Stable coalition aids EU integration—mildly bullish.
Explanation: Geopolitics add volatility—tariffs and conflicts weigh short-term, trade benefits and defense spending lift long-term prospects.
🟣Intermarket Analysis
Relationships with other markets:
EUR/USD:
Below 1.0500—weaker euro aids exports—bullish.
DAX:
~19,500—strong correlation, similar dynamics—bullish alignment.
S&P 500:
~5,990—stable, neutral; U.S. risk-off lifts STOXX50—mildly bullish.
Commodities:
Oil $70.44—neutral; gold $2,930 (risk-off)—bullish for Eurozone as hedge market.
Bond Yields:
Eurozone 2.2% vs. U.S. 3.8%—yield gap attracts capital—bullish.
Explanation: Intermarket signals are bullish—EUR/USD, bonds, and gold favor STOXX50, with equities providing cautious support.
🟤Next Trend Move
Projected price movements:
Short-Term (1-2 Weeks):
Range: 5,450-5,600.
Dip to 5,450 if tariff fears grow; up to 5,600 if ECB signals dovishness or trade data beats.
Medium-Term (1-3 Months):
Range: 5,400-5,700.
Below 5,450 targets 5,400; above 5,600 aims for 5,700, tied to earnings/policy.
Catalysts: ECB statements, PMI (Mar 10), U.S. trade updates.
Explanation: Short-term consolidation is likely, with downside risks from geopolitics and upside from policy support.
⚫Overall Summary Outlook
The STOXX50 at 5,480.00 faces bearish short-term pressures (geopolitical uncertainty, stagnation, tariff fears) offset by bullish drivers (earnings, trade shifts, USD softness). COT and intermarket signals suggest cautious optimism, technicals indicate consolidation, and sentiment balances short-term caution with long-term hope. A short-term dip to 5,450 is probable, with medium-term upside to 5,700 if fundamentals hold.
📌Keep in mind that these factors can change rapidly, and it's essential to stay up-to-date with market developments and adjust your analysis accordingly.
⚠️Trading Alert : News Releases and Position Management 📰 🗞️ 🚫🚏
As a reminder, news releases can have a significant impact on market prices and volatility. To minimize potential losses and protect your running positions,
we recommend the following:
Avoid taking new trades during news releases
Use trailing stop-loss orders to protect your running positions and lock in profits
💖Supporting our robbery plan 💥Hit the Boost Button💥 will enable us to effortlessly make and steal money 💰💵. Boost the strength of our robbery team. Every day in this market make money with ease by using the Thief Trading Style.🏆💪🤝❤️🎉🚀
I'll see you soon with another heist plan, so stay tuned 🤑🐱👤🤗🤩

STOXX50 Expanding triangle consolidationCurrent Trend: Bullish (Long-term Uptrend)
Pattern Formation: Expanding Triangle (Sideways Consolidation)
Key Support Level: 5283
Key Resistance Levels: 5470, 5527, 5570
Bullish Scenario:
The STOXX 50 remains within a long-term uptrend, with recent price action consolidating in an expanding triangle pattern.
A pullback from current levels could find support at 5283, a key swing low.
A strong bullish bounce from 5283 would confirm the continuation of the uptrend, targeting 5400 as the next resistance level.
A breakout above 5400 could lead to further upside momentum towards 5525, followed by 5570 over the longer term.
Bearish Scenario:
A confirmed breakdown below 5283 with a daily close below this level would invalidate the bullish outlook.
In this scenario, increased selling pressure could push prices lower, with 5173 as the next key support level.
A further decline below 5173 could open the door for an extended retracement towards 5067.
Conclusion:
The STOXX 50 remains in a bullish trend but is consolidating within an expanding triangle. Holding above 5283 keeps the upside bias intact, with potential targets at 5400 and beyond. However, a breakdown below 5283 would shift the sentiment to bearish, signaling further downside risk towards 5173 and 5067. Traders should monitor price action around the 5283 level for confirmation of either scenario.
This communication is for informational purposes only and should not be viewed as any form of recommendation as to a particular course of action or as investment advice. It is not intended as an offer or solicitation for the purchase or sale of any financial instrument or as an official confirmation of any transaction. Opinions, estimates and assumptions expressed herein are made as of the date of this communication and are subject to change without notice. This communication has been prepared based upon information, including market prices, data and other information, believed to be reliable; however, Trade Nation does not warrant its completeness or accuracy. All market prices and market data contained in or attached to this communication are indicative and subject to change without notice.

STOXX50 Expanding Triangle in playCurrent Trend: Bullish (Long-term Uptrend)
Pattern Formation: Expanding Triangle (Sideways Consolidation)
Key Support Level: 5283
Key Resistance Levels: 5470, 5527, 5570
Bullish Scenario:
The STOXX 50 remains within a long-term uptrend, with recent price action consolidating in an expanding triangle pattern.
A pullback from current levels could find support at 5283, a key swing low.
A strong bullish bounce from 5283 would confirm the continuation of the uptrend, targeting 5470 as the next resistance level.
A breakout above 5470 could lead to further upside momentum towards 5527, followed by 5570 over the longer term.
Bearish Scenario:
A confirmed breakdown below 5283 with a daily close below this level would invalidate the bullish outlook.
In this scenario, increased selling pressure could push prices lower, with 5200 as the next key support level.
A further decline below 5200 could open the door for an extended retracement towards 5140.
Conclusion:
The STOXX 50 remains in a bullish trend but is consolidating within an expanding triangle. Holding above 5283 keeps the upside bias intact, with potential targets at 5470 and beyond. However, a breakdown below 5283 would shift the sentiment to bearish, signaling further downside risk towards 5200 and 5140. Traders should monitor price action around the 5283 level for confirmation of either scenario.
This communication is for informational purposes only and should not be viewed as any form of recommendation as to a particular course of action or as investment advice. It is not intended as an offer or solicitation for the purchase or sale of any financial instrument or as an official confirmation of any transaction. Opinions, estimates and assumptions expressed herein are made as of the date of this communication and are subject to change without notice. This communication has been prepared based upon information, including market prices, data and other information, believed to be reliable; however, Trade Nation does not warrant its completeness or accuracy. All market prices and market data contained in or attached to this communication are indicative and subject to change without notice.

STOXX 50 Expanding Triangle pattern supported at 5380Current Trend: Bullish (Long-term Uptrend)
Pattern Formation: Expanding Triangle (Sideways Consolidation)
Key Support Level: 5386
Key Resistance Levels: 5470, 5527, 5570
Bullish Scenario:
The STOXX 50 remains within a long-term uptrend, with recent price action consolidating in an expanding triangle pattern.
A pullback from current levels could find support at 5386, a key swing low.
A strong bullish bounce from 5386 would confirm the continuation of the uptrend, targeting 5470 as the next resistance level.
A breakout above 5470 could lead to further upside momentum towards 5527, followed by 5570 over the longer term.
Bearish Scenario:
A confirmed breakdown below 5386 with a daily close below this level would invalidate the bullish outlook.
In this scenario, increased selling pressure could push prices lower, with 5320 as the next key support level.
A further decline below 5320 could open the door for an extended retracement towards 5246.
Conclusion:
The STOXX 50 remains in a bullish trend but is consolidating within an expanding triangle. Holding above 5386 keeps the upside bias intact, with potential targets at 5470 and beyond. However, a breakdown below 5386 would shift the sentiment to bearish, signaling further downside risk towards 5320 and 5246. Traders should monitor price action around the 5386 level for confirmation of either scenario.
This communication is for informational purposes only and should not be viewed as any form of recommendation as to a particular course of action or as investment advice. It is not intended as an offer or solicitation for the purchase or sale of any financial instrument or as an official confirmation of any transaction. Opinions, estimates and assumptions expressed herein are made as of the date of this communication and are subject to change without notice. This communication has been prepared based upon information, including market prices, data and other information, believed to be reliable; however, Trade Nation does not warrant its completeness or accuracy. All market prices and market data contained in or attached to this communication are indicative and subject to change without notice.

STOXX50: Maintains Bullish Momentum - Is 5,688 the Next Target?ICMARKETS:STOXX50 remains within a well-defined ascending channel, with the price showing a rebound from the midline of the channel. This suggests a continuation of the uptrend, targeting the upper channel boundary.
A short-term pullback could offer a potential entry opportunity. If buyers step in and confirm strength through candlestick patterns like bullish engulfing or hammer formations, momentum could drive price higher toward the 5,688 level.
A breakdown below the channel's lower boundary, however, would invalidate the bullish outlook and signal a potential shift in market direction.
Remember, always confirm your setups and trade with solid risk management. Best of luck!

STOXX50 Maintains Bullish Momentum — Targeting $5,605ICMARKETS:STOXX50 remains within a well-defined ascending channel, with the price showing a rebound from the midline of the channel. This suggests a continuation of the broader uptrend, with the next potential target near 5,605, aligning with the upper boundary of the channel.
A minor pullback could present a potential entry opportunity if buyers maintain control. Confirmation through bullish candlestick patterns—such as bullish engulfing or hammer formations—may strengthen the bullish case and drive momentum toward the 5,605 level.
A breakdown below the channel’s lower boundary would invalidate the bullish outlook and could indicate a potential shift in market direction. Monitoring how price reacts around the midline will be crucial for assessing continued bullish momentum.
Remember, always confirm your setups and trade with solid risk management. Best of luck!
