One Last Drop Before Take Off?Price is still in a pullback phase, and the next potential target zone is around 0.07488 – 0.07334.
We might see one last dip before BINANCE:STPTUSDT resumes its uptrend.
If the price reaches this pullback zone with a bullish divergence, that would be a strong confirmation for a possible reversal.
But even without divergence, we can still rely on candlestick patterns to signal a potential reversal at that level.
What do you think — will BINANCE:STPTUSDT bounce from this zone or break lower?
STPTUSDT

Standard Tokenization Protocol Easy 200%+ TargetThis chart has the bullish breakout, the correction, the shakeout, the rounded bottom, the recovery, the volume and all the classic signals combined plus more. This chart is bullish now and bullish means... Oh, oh! Easy double-up.
You can put in 1 Bitcoin and end up with 3 Bitcoins within just a few short months. Sounds nice? Do your own planning of course because when trading Cryptocurrencies there is always risk involved.
If you are trading spot the risk is minimum because you hold the actual coins. If the project is a strong one, you are simply buying and if it doesn't move right away, well, just think long-term. But everything will move now because we are in the start of the 2025 bull market. Awesome is a small word to describe what will happen next.
» STPTUSDT is ready now is bullish now and very soon going up.
This chart has a rounded bottom formation coupled with rising volume. This means that the flush correction is over and the action is back on the bullish zone. This means that a new bullish wave is underway and this means that my target will be hit within weeks or months.
By late May, the entire Altcoins market will be massive green and you will be amazed by how crazy-good everything will become. Only amazed if you don't trust me, if you do trust me, you will be chill and relaxed because everything happened as it should happen and everything is happening as it was predicted years ago.
We know for a fact what will happen and we have confirmation based on what is happening and... Time will tell, but the wait is over now and it will only take 2-3 weeks for full confirmation. At that time, we will not say you were right or you were wrong, we will celebrate, congratulate each other, support each other, collect the profits and move on. We will continue to adapt and change, adapt and grow.
If you lose, that's ok, losing is part of the game.
If you win, that's perfect, winning is what we like best.
The goal is not to win them all. The goal is to come out ahead, become a winner as we grow.
We grow personally, financially and spiritually; the market will help to grow your money while you take care of the challenges that life throws at us. There is no going wrong with Crypto, this is the stock market for the people, a new financial market for the new generation.
You can literally just inject money every week or every month, whatever you can afford, and in 20 years from now, you can retire with more money than Michael Jackson, serial rapist P. Diddy or technical genius Elon Musk.
Namaste.


Trading opportunity for STPTUSDTBased on technical factors there is a Buy position in :
📊 STPTUSDT
🔵 Buy Now
🪫Stop loss 0.04200
🔋Target 0.06450
📏 R/R 3
💸RISK : 1%
We hope it is profitable for you ❤️
Please support our activity with your likes👍 and comments📝

AUCTIONUSDT UPDATE
AUCTIONUSDT is a cryptocurrency trading at $14.18. Its target price is $26.00, indicating a potential 100%+ gain. The pattern is a Bullish Falling Wedge, a reversal pattern signaling a trend change. This pattern suggests the downward trend may be ending. A breakout from the wedge could lead to a strong upward move. The Bullish Falling Wedge is a positive signal, indicating a potential price surge. Investors are optimistic about AUCTIONUSDT's future performance. The current price may be a buying opportunity. Reaching the target price would result in significant returns. AUCTIONUSDT is poised for a potential breakout and substantial gains

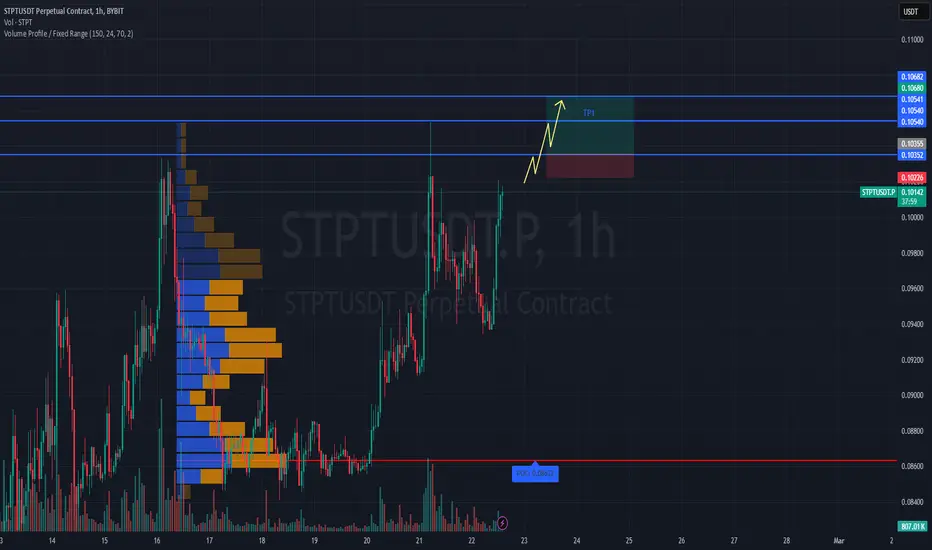
#STPTUSDT maintains bullish momentum📈 LONG BYBIT:STPTUSDT.P from $0.10355
🛡 Stop Loss: $0.10226
⏱ 1H Timeframe
✅ Overview:
➡️ BYBIT:STPTUSDT.P is showing strong bullish momentum after consolidating at lower levels, indicating buyer presence.
➡️ Volume Profile suggests that the main liquidity (POC) is positioned significantly below the current price, confirming demand dominance.
➡️ A breakout above $0.10355 and holding above this level will validate the bullish continuation.
➡️ The nearest resistance zone is between $0.10540 and $0.10680, where partial profit-taking may occur.
⚡ Plan:
➡️ Long entry upon breaking $0.10355, confirming buyer strength.
➡️ Stop-Loss at $0.10226—placed below the nearest support to minimize risk.
➡️ Main target range: $0.10540–$0.10680, where selling pressure might emerge.
🎯 TP Targets:
💎 TP 1: $0.10540
🔥 TP 2: $0.10680
🚀 BYBIT:STPTUSDT.P maintains bullish momentum — expecting further upside!
📢 BYBIT:STPTUSDT.P remains within an uptrend. If the price consolidates above $0.10355, further acceleration is expected.
📢 Volume suggests strong buyer activity, supporting the bullish outlook.
📢 However, the $0.10540–$0.10680 zone could act as a profit-taking level, so monitoring price action and partial profit-taking is advisable.
QTUMUSDT UPDATEQTUMUSDT is a cryptocurrency trading at $3.555. Its target price is $5.500, indicating a potential 50%+ gain. The pattern is a Bullish Falling Wedge, a reversal pattern signaling a trend change. This pattern suggests the downward trend may be ending. A breakout from the wedge could lead to a strong upward move. The Bullish Falling Wedge is a positive signal, indicating a potential price surge. Investors are optimistic about QTUMUSDT's future performance. The current price may be a buying opportunity. Reaching the target price would result in significant returns. QTUMUSDT is poised for a potential breakout and substantial gains.

STPTUSDT (STP) Updated till 15-01-25STPTUSDT (STP) Daily timeframe range. we can see 2 wicks toward 0.08291 thats buyers trying to clear out sellers on resistance. if retail interest keeps up its not hard to get over 0.08291. its holding well even through market dump till now. recent support at 0.06287.

STPT Bullish on MonthlySTPT will give 400% plus profit .. u must allocate some funds in this project

STPTUSDT(STP) Updated till 16-09-24STPTUSDT(STP) Daily timeframe range. we can see a huge wick on daily candle today. peoples gonna get trapped if its not get to 0.06043 again. but if it can stay above 0.04803 than it got chances for another push to 0.06043 . local support at 0.03716.

#STPT/USDT#STPT
The price is moving within a bullish channel pattern on the 12-hour frame, which is a strong retracement pattern
We have a bounce from a major support area in green at 0.03550
We have a tendency to stabilize above the Moving Average 100
We have an upward trend on the RSI indicator that supports the rise and gives greater momentum, upon which the price is based higher at the discount
Entry price is 0.4000
The first target is 0.04832
The second target is 0.05365
The third goal is 0.06020

STPTUSDT is Ready for the Next Big Move? Get Ready for BreakoutYello Paradisers! Are you ready for the next big move in #STPT? Let's break down these statements and analyze what's happening:
💎#STPT is currently trading within a descending channel, which typically signals a bearish trend. This pattern showcases a series of lower highs and lower lows. However, there’s a potential breakout and retest zone just above the descending resistance. A successful breakout and retest could lead to a strong upward move.
💎#STPTUSDT has been consistently rejected by the channel as indicated by the red arrows. A break above this line could signal a potential trend reversal. 50EMA is also reinforcing this bullish outlook.
💎There's a highlighted support zone around $0.03737, this level has been tested and respected multiple times by the GETTEX:STP , making it a crucial support area to watch. It’s also where we find a bullish order block, suggesting that buyers are likely to step in at this level.
💎Within the support zone, this order block indicates strong buying interest, providing further support for a potential bullish move. The bullish outlook will be invalidated if the $STPT falls below the major support zone at $0.03565. This level is key for maintaining the current structure.
Stay focused, patient, and disciplined, Paradisers!
MyCryptoParadise
iFeel the success🌴

STPT buy setupBy maintaining the green range, it can break the trigger line and move to the red box.
On the chart, we have a bullish iCH, which can be the first sign for a pullback towards higher supplies.
The target is the red box.
Closing a 4-hour candle below the invalidation level will violate the analysis.
For risk management, please don't forget stop loss and capital management
When we reach the first target, save some profit and then change the stop to entry
Comment if you have any questions
Thank You


STPT LOOKS BULLISH (1D)It looks like the big wave B is over and has entered the ascending wave C.
By maintaining the green range, it can move towards the TPs. Closing a daily candle below the green range will violate the analysis
For risk management, please don't forget stop loss and capital management
When we reach the first target, save some profit and then change the stop to entry
Comment if you have any questions
Thank You

$STPT Breakout and retest inverse head and shoulders pattern **$STPT Breakout and retest inverse head and shoulders pattern **
The inverse head and shoulders pattern is a reversal pattern that can indicate a potential change in the trend from bearish to bullish. It consists of three troughs: a lower low (head) between two higher lows (shoulders). Here are the steps to trade the inverse head and shoulders pattern:
1. **Identify the Pattern:**
- Look for a downtrend in the price chart.
- Identify the three troughs that form the inverse head and shoulders pattern.
2. **Confirmation of Pattern:**
- Confirm the pattern by checking if the second shoulder's low is higher than the first shoulder's low.
- Volume analysis can be useful. Typically, the volume is higher during the formation of the head than during the shoulders. As the pattern completes, the volume should diminish.
3. **Neckline Breakout:**
- The neckline is a horizontal line connecting the high points of the two shoulders. Wait for a clear breakout above this neckline.
- The breakout should ideally be accompanied by a surge in volume, indicating strong buying interest.
4. **Confirmation of Breakout:**
- To avoid false breakouts, wait for confirmation. Some traders wait for a daily close above the neckline to confirm the breakout.
5. **Price Target:**
- The distance from the head to the neckline can be measured and added to the breakout point to estimate a target price. This is a potential target for the upward move.
6. **Stop-Loss:**
- Set a stop-loss order below the neckline to manage risk. If the price falls back below the neckline after the breakout, it may indicate a false breakout.
7. **Risk Management:**
- Consider the risk-reward ratio before entering the trade. Ensure that potential profits are worth the risk taken.
8. **Monitor the Trade:**
- Keep an eye on the trade as it progresses. Look for signs of strength or weakness in the price movement.
9. **Consider Other Indicators:**
- Use other technical indicators, such as moving averages or relative strength index (RSI), to confirm the strength of the trend reversal.
10. **Patience:**
- Be patient and allow the trade to develop. Not all breakouts lead to sustained trends, so monitor the market conditions.
Remember that no trading strategy is foolproof, and there is always a risk of losses. It's crucial to combine technical analysis with risk management and stay informed about market conditions. Additionally, practice on a demo account before implementing any new trading strategy with real money.

STPT/USDT what next? 👀 STPT Today analysis💎 Paradisers, turn your attention to STPTUSDT! We've observed a captivating trajectory as it firmly anchors at a crucial demand level, setting the stage for potential outcomes.
💎 In our prior observations, STPT successfully surpassed a descending channel, initiating an upward trend. However, after facing rejection from a supply point, it revisited the channel's support. Currently, it's poised for a significant leap towards a formidable resistance, all while operating within the demand zone. This presents us with two potential scenarios:
💎 The price embarks on a bullish journey, breaking through the robust resistance, leading to an upward continuation.
💎 Conversely, if the price dips below the demand zone, we might see it approaching the support level once more.
💎 Remember to employ prudent trading strategies and use proper stop-loss measures! Stay alert to market movements and look forward to more insight

STPTUSDT(STP) Daily tf Range Updated till 05-10-23STPTUSDT(STP) Daily timeframe range. back to 0.07009 failed several times here , if it breaks easy way to 0.08213 or fails back to low.

STP (STPT) formed bullish BAT move for the next pumpHi dear friends, hope you are well and welcome to the new trade setup of STP (STPT) with US Dollar pair
Previously we caught almost 29% pump of STPT as below:
Now on 2-hr frame, STPT has formed a bullish BAT move for the next price reversal.
Note: Above idea is for educational purpose only. It is advised to diversify and strictly follow the stop loss, and don't get stuck with trade.

Getting Ready For Massive Recovery
Formed Descending Channel & Building Up For Massive Breakout
Incase Of Breakout Expecting 200 - 220% Bullish Rally Keep Eyes On For lower tf breakout

STP (STPT) forming bullish BAT move for upto 31% pumpHi dear friends, hope you are well and welcome to the new trade setup of STP (STPT) with US Dollar pair
Previously we caught almost 40% pump of STPT as below:
Now on a 2-hr time frame, STPT is about to complete a bullish BAT for another price reversal.
Note: Above idea is for educational purpose only. It is advised to diversify and strictly follow the stop loss, and don't get stuck with trade

STP (STPT) formed bullish BAT move for upto 24% pumpHi dear friends, hope you are well and welcome to the new trade setup of STP (STPT) with US Dollar pair
Previously we had a nice trade of STPT as below:
Now on a 4-hr time frame, STPT has formed a bullish BAT pattern for another price reversal move.
Note: Above idea is for educational purpose only. It is advised to diversify and strictly follow the stop loss, and don't get stuck with trade

✴️ STPT | Allow Me To Show You Some Magic 222.2Please allow me to show you a magic trick...
See the green arrow?
Wait patiently... ... ...
222.2% = Magic!
