GBPCAD could go up to 1.7138 after the BOEGBPCAD has started to show upward strength after bouncing at the 1.70 level, where a demand zone is located. The price underwent a significant structural change on the M15 timeframe yesterday, presenting a trading opportunity that could have yielded a 1% profit before the release of Canadian data. Personally, I did not execute that trade. Currently, it appears to be resuming its trajectory towards the higher swing point, where there is liquidity to fill at the 1.7138 level. Today, the BOE interest rates are expected, so pay attention to potential entries during the London session and possible spikes during the rate announcement. Personally, I would consider an entry, provided the conditions are met, after the rate announcement to have a more comprehensive view of the chart and macroeconomic factors. Naturally, I will assess a structural change to the upside on the M15 to confirm my long-term bullish outlook. Greetings and happy trading to everyone.
Strategy!

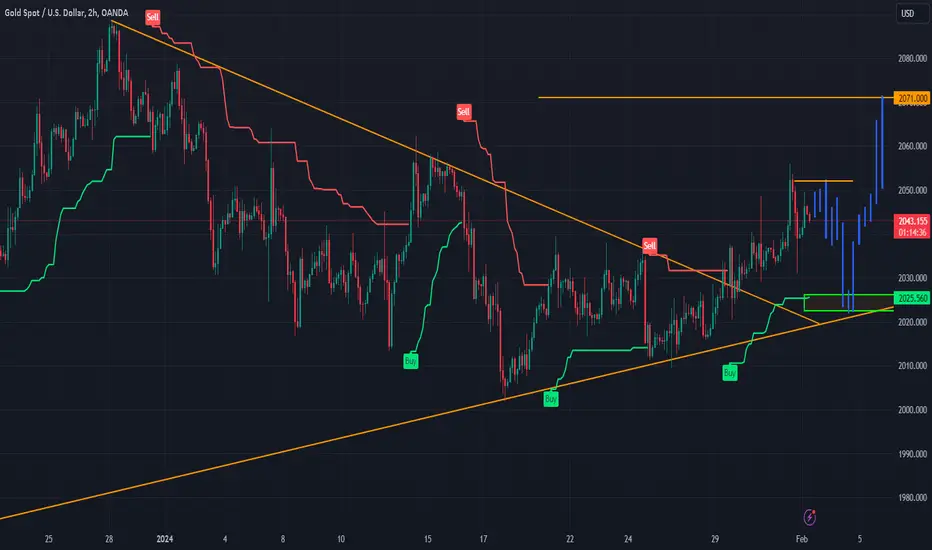
Xau/Usd 2hHello traders!
As we can see, the pair managed to capture a new price at the level (2056.00). In my opinion, the pair should hit the level (2052.00) and then start a decline towards the level (2026.00) where we will then see a rise towards the level (2071.00). The market is showing instability because of the economic news and because of the war. Be careful! Don`t forget to look at the economic calendar!
MAKE MONEY AND ENJOY LIFE 💰
THANK YOU!
GOOD LUCK!
🙏🏻🙏🏻🙏🏻
Perfect ChoCh : Entry + SetupWith this trading model, I aim to share with the community a particularly significant approach that has revolutionized my way of operating in the markets, especially on shorter timeframes such as 1, 5, and 15 minutes. This model involves defining a clear structure before entering the market, specifically a demand zone already present in the market. A price that reaches this zone through a double structural break (BOS) before rallying and creating an internal break (ChoCh) before returning to the demand zone. Subsequently, the price will surpass the previous high, thereby defining a new demand zone. One will then await the price to reach this zone, and once there, enter the market with the aim of reaching the supply zone depicted on the chart.

XAU/USD | Bullish trend ready to reach $2060.Gold has shown a reversal in trend, dropping below $2,030 after an initial increase to $2,040. Despite the strength of the US dollar, XAU/USD has maintained positive territory thanks to the decline in US yields and growing tensions in the Middle East. On the daily chart, the pair has modest intraday gains but remains below a 20-period simple moving average (SMA). Longer-term moving averages lack directionality. Technical indicators have slightly improved but remain negative, indicating limited upside prospects. In the short term (4-hour chart), XAU/USD is in a neutral phase, with moving averages lacking directional strength. Technical indicators suggest diminishing short-term buying interest. Support levels are at $2,019.20, $2,010.00, and $2,001.60, while resistance levels are at $2,033.10, $2,040.30, and $2,052.60. The week saw gold open with a higher gap at $2,037.46, but the dollar recovered during the American session. Geopolitical tensions, especially between the US and Iran, have influenced the markets. Investors are awaiting economic data and monetary policy decisions, with a focus on earnings and comments from the ECB attempting to temper expectations of an interest rate cut in April.

NASDAQ | Bearish triangle with a retest at 15,430During the day on January 26th, the index of US technology stocks, likely the Nasdaq 100, recorded a negative performance, closing with a moderately negative percentage change of 0.55%. The day started with difficulties, opening at 17,430 points, approximately near the lowest level of the previous day. Despite this, the index showed reasonable resilience throughout the session but ultimately closed weakly at 17,420 points, near the day's lows. An analysis of the status and trend suggests that in the medium term, the Nasdaq 100 confirms the presence of an upward trend. However, in the short term, it appears that the positive momentum is diminishing at the resistance test identified at 17,510 points, with the first support located at 17,330 points. Expectations are leaning towards a negative extension in the short term, with a target set at 17,230 points.

PTON Peloton Interactive Options Ahead of EarningsAnalyzing the options chain and the chart patterns of PTON Peloton Interactive prior to the earnings report this week,
I would consider purchasing the 8usd strike price Calls with
an expiration date of 2025-1-17,
for a premium of approximately $1.45.
If these options prove to be profitable prior to the earnings release, I would sell at least half of them.
PTON might be a buyout this year. From one of these giants: AAPL, AMZN or NKE!

USDJPY a Short Trade with target to 146.80Japan is going through a consolidation phase against the US dollar, amidst mixed fundamental signals. The softer tone of the Tokyo Core CPI, coupled with a positive risk sentiment, is weakening the Japanese Yen (JPY). Despite subdued price action in the USD, momentum is lacking ahead of US PCE data. The USD/JPY pair has trimmed some of its intraday gains, hovering around 147.60 during Thursday's European trading hours. However, it attempted to recover losses from the previous session after positive US Purchasing Managers Index (PMI) data. Japan's Merchandise Trade Balance for December exceeded expectations, contributing to the strengthening of JPY. The Bank of Japan (BoJ) has maintained existing interest rates and yield curve control policies, with Governor Ueda expressing a strong commitment to achieving the 2.0% inflation target. The US S&P Global PMI reached an 11-month high in January, surpassing forecasts, and the market is cautious ahead of the US Federal Reserve's interest rate decision on January 31, leading to increased demand for the Greenback. While the market has priced in speculation of no adjustment in January, the CME FedWatch tool indicates a notable decline in the probability of a March rate cut, dropping below 40%. This marks a significant decrease from the 80% probability recorded just a month ago. Traders are eagerly awaiting US Gross Domestic Product Annualized (Q4) data on Thursday for further insights into the Fed's potential interest rate trajectory. H4 Chart: I expect a bounce in the supply zone within the highlighted white box, corresponding to the Fibonacci level 62-79, and will look for a confirmation of a bearish structural change at M15. Stay tuned for updates. Greetings and have a great day to everyone from Nicola.

💡 $357 profit with 72% PoP STRANGLE - #1 trade in my challangeTrade Overview:
Initiated my first options trade for the annual challenge on January 2nd with an IWM strangle. Observing high IVR in the index, I capitalized on the recent VIX spike to enter the 45DTE 212/188 strangle for 3.57cr.
Trade Management:
Rolling Strategy: Will roll legs as needed before expiration if price diverges.
Loss Management: With a FWB:12K account, I'm capping floating loss at $200.
Closing Strategy: Targeting to close around 21DTE.
Trade Details:
Symbol: IWM
Option Type: Strangle 45DTE
Entry Date: January 2, 2024
Entry Price: 3.57cr
Required BP: $1681
Max Profit: $357 (20% of capital)
PoP: 72%
Positions:
IWM Feb 16, 2024 212.00 CALL - Sell | Price: 1.76 | Qty: 1 | R. PnL: 0 | Commission: 1.251 | Fees: 0
IWM Feb 16, 2024 188.00 PUT - Sell | Price: 1.81 | Qty: 1 | R. PnL: 0 | Commission: 1.2511 | Fees: 0
Key Metrics:
Tasty IVR: 42 (High)
Breakevens: 184/215

EURAUD | It's time to evaluate a Bearish MomentumThe H4 analysis of the Euro/Australian Dollar exchange rate points to a negative trend, with the price currently undergoing a Fibonacci retracement at the 0.62-0.79 level. I anticipate a potential bearish momentum for the pair with a potential target of 1.6270, representing an area of liquidity that has yet to be explored. However, it is crucial for the price to execute a Break Out of Structure (BOS) on a 15-minute time frame during the London or New York sessions. We hope to observe a clear and significant change in market structure during these sessions; otherwise, the idea is not to be considered viable. We always await the necessary operational confirmations and adhere to an optimal risk management approach. Best regards, as always, from Nicola, and I wish everyone a good day of trading.

EUR/USD: It's Time to Evaluate a Short Trade!Good morning traders, EUR/USD has firmly maintained its downward trend and retreated to multi-week lows in the 1.0820 zone amidst increasing pre-ECB weakness. Looking at the 4-hour chart, the pair seems to have broken below the consolidative phase. That said, the first support level will be around 1.0821 before 1.0723. On the bullish side, attempts should look for a test of the 200-SMA at 1.0920, followed by the 100-SMA at 1.0930 and then 1.0998. The continuation of the strong dollar buying bias has kept risk appetite in check, pushing the US Dollar Index (DXY) to a new yearly high around 103.80, also aided by higher US yields, especially in the belly and the long end of the curve, and the current risk-off environment. In light of the upcoming ECB event, it is interesting to note that market participants have already priced in around 120 bps in rate cuts for the ongoing year, and there is a growing debate between market participants and ECB decision-makers regarding the timing of the central bank's decision to initiate a reduction in the region's policy rate. Despite inflation surpassing the target set by the European Central Bank, policymakers in Europe seem inclined to maintain a cautious approach, even though weak economic fundamentals in the region limit the potential for the European currency to strengthen. The situation looks heated for the dollar; the market today broke a double demand zone at H4, and now it could retrace to the 62 Fibonacci level in the supply zone at 1.0884 before seeking liquidity at a swing low around 1.0750. In case of a retracement, it will be crucial to evaluate an entry, possibly towards the end of the London session, perhaps following a bearish structural change to confirm our view. Greetings to everyone and happy trading.

5 Steps Smart Money Concept Model5 STEPS SMART MONEY CONCEPT MODEL
Break of Structure (BOS):
Definition: A Break of Structure occurs when the market provides the initial indication that the price is likely to reverse. For example, a new lower low and lower high signal a disrupted market structure, indicating a forthcoming reversal to the downside.
Trading Approach: Traders typically align their trades with the Higher Time Frame (HTF) BOS, especially when the price closes above/below a swing high/low.
Change in Character (CHOCH):
Definition: A CHOCH represents an initial shift that can signal a short- or long-term price reversal. It is considered a reversal pattern, utilized by SMC traders on higher time frames for market direction and on lower time frames for trade opportunities.
Implementation: SMC traders use CHOCHs on various time frames to gauge market direction and identify intraday reversals or reactions to Points of Interest (POIs).
Fair Value Gap (FVG):
Definition: Fair Value Gaps highlight market inefficiencies or imbalances, where buying and selling are not equal. These gaps become magnets for price, resolving the inefficiency as resting orders are filled.
Utilization: Traders use FVG information to target these gaps, identifying potential entry points for long or short positions. Fair Value Gaps are considered valuable Points of Interest (POIs) in price action trading.

ABT Abbott Laboratories Options Ahead of EarningsIf you haven`t sold the regional top on ABT:
Nor reentered this fantastic dip:
Then analyzing the options chain and the chart patterns of ABT Abbott Laboratories prior to the earnings report this week,
I would consider purchasing the 115usd strike price at the money Calls with
an expiration date of 2024-2-16,
for a premium of approximately $2.26.
The chart is overextended and the RSI overbought, but I think there is one more leg to go before a correction.
If these options prove to be profitable prior to the earnings release, I would sell at least half of them.

EUR/USD | Small Lateralization Before Reaching 1.0950EUR/USD remains in a disadvantaged position and trades slightly below 1.0900 in the American session. The EUR/USD pair records modest intraday gains and has even reached a new four-day high at 1.0909. EUR/USD moves uneventfully just below the 1.0900 mark on Monday, confined to a limited range. The absence of relevant macroeconomic news and first-tier events scheduled for the week keeps market participants cautious. The strength of Wall Street supports modest optimism amid earnings that exceed expectations. In the coming days, attention will turn to central banks, as the Bank of Japan (BoJ), the Bank of Canada (BoC), and the European Central Bank (ECB) will announce their monetary policy decisions. Additionally, the United States will release the preliminary estimate of Q4 Gross Domestic Product (GDP) and the December Core Personal Consumption Expenditures (PCE) Price Index, the Federal Reserve’s preferred inflation gauge. I wish everyone successful trading, greetings from Nicola.

2024 US Recession | Key Factors2000 DOT-COM CRISIS
The dot-com crisis, also known as the "dot-com bubble" or "dot-com crash," was a period of economic turbulence that affected the technology and telecommunications sectors in the late 1990s and early 2000s. Here are some key points:
Euphoria Phase: In the 1990s, there was a boom in the technology and dot-com industry fueled by irrational investor euphoria. Many companies secured significant funding, even if they had weak or nonexistent business models.
Excessive Valuations: Valuations of technology companies skyrocketed, often based on exaggerated growth projections and unrealistic expectations. This led to rampant speculation in financial markets.
Bubble and Collapse: In 2000, the dot-com bubble began to burst. Many investors realized that numerous technology companies were unable to generate profits in the short term. This triggered a massive sell-off of stocks and a collapse in tech stock prices.
Economic Impacts: The crisis had widespread economic impacts, with the loss of value in many technology stocks and the bankruptcy of numerous companies. Investors suffered heavy losses, and this had repercussions on the entire stock market.
Economic Lessons: The dot-com crisis led to a reassessment of investment practices and taught lessons about the importance of carefully analyzing companies' fundamentals and avoiding investments based solely on speculative expectations.
Following this crisis, the technology sector experienced a correction but also contributed to shaping the industry in a more sustainable way. Many companies that survived the crisis implemented more realistic and sustainable strategies, contributing to the subsequent growth and development of the technology sector.
2007-2008 FINANCIAL CRISIS
The 2007-2008 financial crisis was a widespread event that had a significant impact on the global economy. Here are some key points:
Origins in the Subprime Mortgage Crisis: The crisis originated in the U.S. real estate sector, particularly in subprime mortgages (high-risk). An increase in mortgage defaults led to severe losses for financial institutions holding securities tied to these loans.
Spread of Financial Problems: Losses in the mortgage sector spread globally, involving international financial institutions. Lack of transparency in complex financial products contributed to the crisis's diffusion.
Bank Failures and Government Bailouts: Several major financial institutions either failed or were on the brink of failure. Government interventions, including bailouts and nationalizations, were necessary to prevent the collapse of the financial system.
Stock Market Crashes: Global stock markets experienced significant crashes. Investors lost confidence in financial institutions, leading to a flight from risk and an economic contraction.
Impact on the Real Economy: The financial crisis directly impacted the real economy. The ensuing global recession resulted in the loss of millions of jobs, decreased industrial production, and a contraction in consumer spending.
Financial Sector Reforms: The crisis prompted a reevaluation of financial regulations. In response, many nations implemented reforms to enhance financial oversight and mitigate systemic risks.
Lessons Learned: The financial crisis underscored the need for more effective risk management, increased transparency in financial markets, and better monitoring of financial institutions.
The 2007-2008 financial crisis had a lasting impact on the approach to economic and financial policies, leading to greater awareness of systemic risks and the adoption of measures to prevent future crises.
2019 PRE COVID
In 2019, I closely observed a significant event in the financial markets: the inversion of the yield curve, with 3-month yields surpassing those at 2, 5, and 10 years. This phenomenon, known as an inverted yield curve, is generally considered an advanced signal of a potential economic recession and has often been linked to various financial crises in the past. The inversion of the yield curve occurred when short-term government bond yields, such as those at 3 months, exceeded those at long-term, like 2, 5, and 10 years. This situation raised concerns among investors and analysts, as historically, similar inversions have been followed by periods of economic contraction. Subsequently, in 2020, the COVID-19 pandemic occurred, originating in late 2019 in the city of Wuhan, Hubei province, China. The virus was identified as a new strain of coronavirus, known as SARS-CoV-2. The global spread of the virus was rapid throughout 2020, causing a worldwide pandemic. Countries worldwide implemented lockdown and social distancing measures to contain the virus's spread. The economic impact of the pandemic was significant globally, with sectors such as tourism, aviation, and hospitality particularly affected, leading to business closures and job losses. Efforts to develop a vaccine for COVID-19 were intense, and in 2020, several vaccines were approved, contributing to efforts to contain the virus's spread. In 2021, the Delta variant of the virus emerged as a highly transmissible variant, leading to new increases in cases in many regions worldwide. Subsequent variants continued to impact pandemic management. Government and health authorities' responses varied from country to country, with measures ranging from lockdowns and mass vaccinations to specific crisis management strategies. The pandemic highlighted the need for international cooperation, robust healthcare systems, and global preparedness to address future pandemics. In summary, the observation of the yield curve inversion in 2019 served as a predictive element, suggesting imminent economic challenges, and the subsequent pandemic confirmed the complexity and interconnectedness of factors influencing global economic health.
2024 Outlook
The outlook for 2024 presents significant economic challenges, outlined by a series of critical indicators. At the core of these dynamics are the interest rates, which have reached exceptionally high levels, fueling an atmosphere of uncertainty and impacting access to credit and spending by businesses and consumers. One of the primary concerns is the inversion of the yield curve, manifested between July and September 2022. This phenomenon, often associated with periods of economic recession, has heightened alarm about the stability of the economic environment. The upward break of the 3-month curve compared to the 2, 5, 10, and 30-year curves has raised questions about the future trajectory of the economy. Simultaneously, housing prices in the United States have reached historic highs, raising concerns about a potential real estate bubble. This situation prompts questions about the sustainability of the real estate market and the risks associated with a potential collapse in housing prices. Geopolitical instability further contributes to the complexity of the economic landscape. With ongoing conflicts in Russia, the Red Sea, Palestine, and escalating tensions in Taiwan, investors are compelled to assess the potential impact of these events on global economic stability. The S&P/Experian Consumer Credit Default Composite Index, showing an upward trend since December 2021, suggests an increase in financial difficulties among consumers. Similarly, the charge-off rate on credit card loans for all commercial banks, increasing since the first quarter of 2022, reflects growing financial pressure on consumers and the banking sector. In this context, it is essential to adopt a prudent approach based on a detailed analysis of economic and financial data. The ability to adapt to changing market conditions becomes crucial for individuals, businesses, and financial institutions. Continuous monitoring of the evolution of economic and geopolitical indicators will be decisive in understanding and addressing the challenges that 2024 may bring.

Gold's Week Update , 2000$ ?Gold kicked off the week at high levels as it traded near $2,050 per ounce, buoyed by the Middle East conflict’s safe haven demand and stubborn market sentiment that rate cuts are coming sooner rather than later.
But as the shortened holiday week rolled onward, a steady diet of hawkish central bank comments and the absence of any energy boosts from geopolitics weakened investors’ appetite for the yellow metal.

Bitcoin Update After SEC ApprovalSEC Commission approved the listing and trading of a number of spot bitcoin exchange-traded product (ETP) shares. That will lead new investors to put their money longing btc , so that will create a good liquidity to professional ones to short at 47k - 50k levels , and that's really what happened do not get suprised by seeing btc's price range between 30k - 40k

Bank OZK Options Ahead of EarningsIf you haven`t sold OZK here:
Then analyzing the options chain and the chart patterns of Bank OZK prior to the earnings report this week,
I would consider purchasing the 47usd strike price Puts with
an expiration date of 2024-1-19,
for a premium of approximately $1.32.
If these options prove to be profitable prior to the earnings release, I would sell at least half of them.

XAUUSD Next Movement To 1982$ ?The gold market continues to consolidate in a narrow range as investors swing back and forth on the timing of the Federal Reserve's interest rate cuts this year.

Forex Fundamentals: Building Winning StrategiesForex trading success hinges on a well-defined strategy, as it sets a clear direction and methodology, whether it be scalping, day trading, or another approach. Key to this is understanding the market conditions under which your strategy thrives, as different strategies perform variably across market environments. Employing technical indicators is crucial in providing insights and aiding in decision-making, but they must align with your overall strategy for coherence and effectiveness.
The core of any trading strategy lies in its entry and exit criteria. These criteria ensure disciplined and non-impulsive trading decisions, allowing for entry and exit from the market at the most opportune times. Equally vital is stringent risk management, which protects your capital by defining the risk per trade and setting maximum drawdown limits. In tandem with this, appropriate position sizing mitigates the risk of substantial losses and maintains the health of your trading account.
Backtesting the strategy against historical data is indispensable for understanding its potential effectiveness and challenges. This, followed by forward testing in real-time conditions, often in a demo environment, allows for fine-tuning and adaptation to current market dynamics. Constant adjustments and optimization of your strategy are necessary as financial markets are ever-evolving, and a static strategy is often a recipe for failure.
However, the strategy itself is only part of the equation. The psychological aspect of trading – maintaining discipline and managing emotional responses – is equally critical. Regular performance evaluations and reviews provide insights into the strategy's effectiveness and areas that require improvement, fostering a cycle of continuous learning and adaptation.
In the realm of Forex trading, patience and consistency are not just virtues but necessities. The development, implementation, and refinement of a trading strategy is a meticulous and ongoing process. Success in trading emerges from a disciplined approach, a willingness to learn continuously, and an adaptability to evolving market conditions. It's a journey where each step, from understanding market conditions to psychological resilience, plays a pivotal role in shaping a trader's path to achievement.

USD/CAD Expected to Reach 1.3430The USD/CAD pair records a modest loss below the 1.3500 threshold during the early Asian trading hours on Friday. Currently, USD/CAD is traded at 1.3490, with a 0.03% loss for the day. Initial claims for unemployment benefits in the United States amount to 187,000 for the week ending January 13, the lowest level since September 24, 2022. The figure is better than the market expectation of 207,000, according to the Department of Labor on Thursday. Meanwhile, the Federal Reserve's Philadelphia Manufacturing Index for January came in at -10.6 compared to the previous -12.8. In response to the data, the US Dollar Index rises above 103.60 as investors expect the Federal Reserve (Fed) not to rush to reduce interest rates. In contrast to the recent robust growth in the United States, the Canadian economy is on the verge of entering a recession. Financial markets expect the Fed to cut rates as early as March, while the Bank of Canada (BoC) is expected to cut rates starting in April. Meanwhile, a rebound in oil prices due to fear of supply disruptions and geopolitical risk in the Middle East supports the commodity-linked Canadian Dollar. Additionally, the price has experienced a bull run with a target of 1.35, as anticipated. After reaching the liquidity zone, it seems to have started a bearish trend towards the 1.3430 zone. We will see if market sentiment and the chart configuration prove to be correct. Greetings to everyone from Nicola

GBPUSD | Bullish triangle with liquidity problemIn the Forex market, there is a consistent upward movement of the US dollar, impacting overall risks and causing the GBP/USD pair to trim its initial gains, descending towards 1.2700. However, the GBP/USD remains above the lower limit of the ascending regression channel, and the Relative Strength Index (RSI) signals a bullish trend in the short term. Key levels include resistances at 1.2780, 1.2830, and 1.2860, and supports at 1.2750, 1.2710-1.2700, and 1.2670. Despite a brief dip below 1.2700, the GBP/USD closed positively above 1.2750 on Thursday. The improvement in risk sentiment supports the pair on Friday, as markets await PPI data from the USA. Thursday's CPI inflation data exceeded estimates, but markets do not rule out a Fed interest rate cut in March. The UK's Office for National Statistics (ONS) reports a 0.3% monthly GDP growth in November, keeping the British Pound resilient. The UK's FTSE 100 is up by 0.8%, reflecting a positive mood in European markets. An increase in US PPI inflation is expected in December, but the impact on the USD will depend on its significance.

Eurusd ready to downfall read the caption The eurusd pair trade little change for a second eurusd will down soon so wait and see consecutive day changing hands at around 1.0880 ahead of united states us opening the peaked at 1.0906 while it net a bottom at 1.0876

USOIL | How will geopolitical tensions influence the price?The West Texas Intermediate (WTI) price stands at around $72.70 per barrel during Thursday's Asian session, highlighting an upward trend supported by optimism generated by the Organization of the Petroleum Exporting Countries (OPEC). OPEC's monthly report anticipates robust growth in oil demand for 2024 and 2025, forecasting an increase of 2.25 million barrels per day (bpd) in 2024 and 1.85 million bpd in 2025. From a geopolitical perspective, disruptions in the supply chain in the Red Sea are preventing a more significant decline in crude oil prices, with attacks by Houthi forces in the area. The United States responded with strikes against the Houthi, and tensions escalated when the Houthi rebels targeted a U.S. ship. Internally, the American Petroleum Institute (API) reported an unexpected increase in weekly crude oil stocks, while the market awaits the upcoming Energy Information Administration (EIA) report, expected to show a decrease of 0.313 million barrels compared to the previous reading of 1.338 million barrels.
