USD/JPY Breakdown Incoming? 4 Powerful Signals Say 'Short Now'! The current landscape for USD/JPY signals a potential bearish reversal, supported by a convergence of technical, sentiment, and fundamental factors. Following a strong bullish leg from the 140 zone, price has reached the 146–147 resistance area, where it is currently being rejected. Price action has broken below the ascending channel that began in early April, suggesting a loss of bullish momentum and a possible transition into a deeper corrective phase.
From the COT (Commitment of Traders) perspective, the picture aligns with this bias. Non-commercials on the USD Index (DXY) are aggressively reducing exposure on both long and short sides, resulting in a net position of -615 contracts. This reflects growing uncertainty or waning confidence in dollar strength as U.S. monetary policy enters a potential pivot zone. Meanwhile, JPY futures still show a strong net long position by speculators (194,226 long vs. 21,958 short), even after a significant long liquidation of over 9,700 contracts. Commercial traders, typically positioned opposite to trend, remain heavily net short—hinting at possible strength ahead for the yen.
Seasonality adds further weight: May is historically a bearish month for USD/JPY. The 5, 10, and 15-year averages all show negative returns, with a structural downside tendency, especially in the final two weeks of the month.
Retail sentiment further supports this case. Data shows that 68% of retail traders are currently long USD/JPY. Interpreting this through a contrarian lens, it implies growing downside potential, as over-positioned retail traders often precede a move in the opposite direction.
Lastly, technical analysis (daily timeframe) reinforces the bearish scenario. The break below the bullish channel invalidates the recent structure, and the RSI is trending lower with plenty of room to move down before hitting oversold levels. Immediate support zones lie between 143 and 141. A potential retest of 145.80–146.30 would offer a favorable entry for fresh shorts in line with a developing bearish swing structure.
🎯 Conclusion
All elements—technical structure, COT data, seasonal weakness, and retail sentiment—are converging toward a bearish USD/JPY outlook. Institutional traders are cutting dollar longs, seasonal forces are negative, and retail positioning is overly long. With price structure now broken, the bearish bias is well supported, targeting 143 first and 141 as a deeper move, pending price action confirmation.
Strategy!

EURAUD Ready to Launch? Institutions Positioning for a Big Move!🔍 1. COT REPORT (Commitment of Traders)
EUR:
Net Positioning (Non-Commercial): +75,253 → Bullish, but slightly reduced this week (-3,587 longs, +6,814 shorts).
Commercials: Heavily short (550,286 vs 423,456 longs) → Hedging against potential EUR strength.
Open interest change: +8,343 contracts → Higher market participation, active environment.
AUD:
Net Positioning (Non-Commercial): -59,077 → Strong bearish sentiment on AUD.
Commercials: Net long (121,279 vs 61,743 shorts) → Fundamental support for AUD at potential value areas.
Open interest down (-2,607) → Possible position unwinding or rollover.
📊 COT Conclusion: Speculators favor EUR long / AUD short, but commercials are positioned inversely, suggesting a potential reversal point.
📈 2. SEASONALITY
EUR in May:
Generally negative, with average monthly performance over 10y, 15y, and 20y ranging between -0.01% and -0.02%.
Only the 2y curve shows strength (≈+0.0194).
AUD in May:
Mixed performance: 10y and 5y negative, but 2y slightly positive (+0.0083) → sign of recent improvement.
📊 Seasonality Conclusion: Slight edge for AUD thanks to near-term seasonal resilience.
💡 3. SENTIMENT
Retail traders: 84% short on EURAUD.
Average short entry: 1.7002, current price ≈ 1.7491 → many are in drawdown.
High short congestion above 1.74 → Potential short squeeze setup.
📊 Sentiment Conclusion: Environment favors a bullish push to trigger stops and unwind retail shorts.
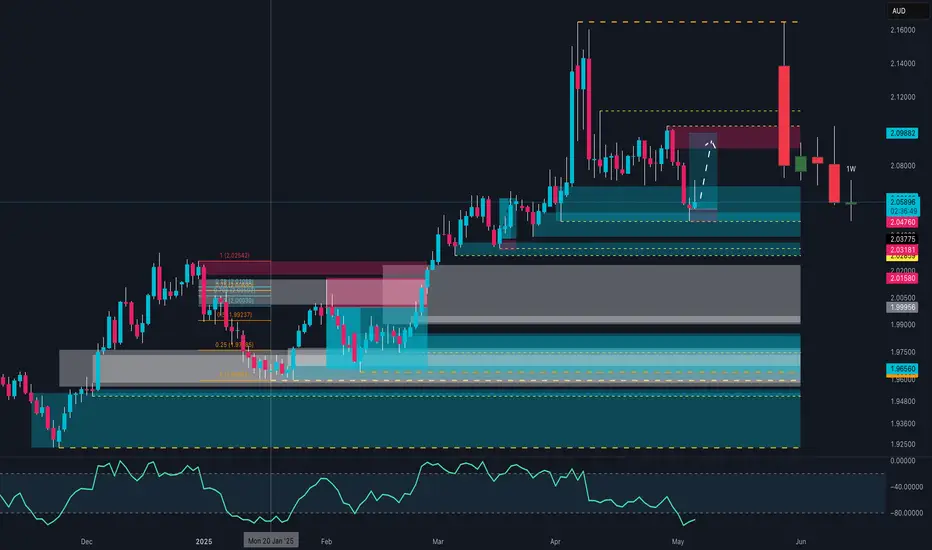
🧠 4. PRICE ACTION
Price reacted to a major demand zone at 1.7200–1.7350.
Last two weekly candles show compression and accumulation following strong bearish momentum.
Clear liquidity pocket above 1.76–1.77, targeting the 1.79–1.80 zone.
RSI showing recovery from oversold conditions.
📊 Technical Conclusion: Structure suggests rebound or reversal, aligned with sentiment and positioning dynamics.
🔚 STRATEGIC OUTLOOK
Primary Bias: LONG EURAUD (multi-day / swing setup)
🎯 Target: 1.7700 – 1.7920
🛡️ Stop: Below 1.7310 (weekly close under demand zone)
⚠️ Alternative (Scenario B): A clear weekly close below 1.7300 may reactivate the bearish trend toward 1.7200.
BB + VWAP ChatGPT Strategy | With Trailing Stop LossThis strategy was generated with the help of ChatGPT. I used VWAP + Bollinger Bands for entry signals, then implemented a 10% trailing stop using Pine Script v5.
It performed well on TSLA and SPY in 4HR charts, and I’ve shared all code + visuals in this full write-up:
👉 eemanispace.com

DOUBLED MONEY in 3 days! $6/share win for $0.50/share stop loss!🔥 +100% in 3 days ✅ $6 to $12 Swing Pick buy on Friday before market close at $6 NASDAQ:ASST
Just 3 days later it's $12 for a mega win!
And to make that much better the risk was only $0.50 per share while going for $6/share win so 1:12 risk/reward ratio

+50% higher since my last post on $SYTA🤑+50% higher since last post on NASDAQ:SYTA with additional Buy Alert, we're now in $8's
You're welcome 💸

EUR/USD is Loading a Breakout?!EUR/USD has posted an interesting bullish reaction following a controlled descent within a descending channel.
After a brief break below a long-term ascending trendline, price established support within a clear demand zone between 1.1130 and 1.1170, closing the daily candle back above the key area.
This structure suggests a possible phase of accumulation, especially given the presence of a strong lower wick and the defense of the highlighted yellow zone. Still, the pair remains within the descending channel, and the squeeze between the trendline and resistance at 1.1280 could become a decision zone. A daily close above 1.1280 would support bullish continuation and open the way to 1.1450.
🧠 Institutional Positioning (COT):
Large speculators continue to favor the long side on the euro, with a noticeable increase in net long exposure. This confirms the accumulation narrative visible on the chart.
Meanwhile, the USD shows a consistent decline in bullish positioning, adding weight to the case for a softer dollar — supportive of a potential EUR breakout.
📊 Retail Sentiment:
Retail traders are slightly skewed to the short side (52% short), which is not extreme but does act as a contrarian input favoring bullish continuation — especially if the price breaks above dynamic resistance.
📅 Seasonality (May):
Historically, May tends to be a weak-to-neutral month for EUR/USD over the 10–20Y horizon. However, recent years (last 2Y) show a bullish deviation from that trend, supporting the idea that any dips could offer opportunity rather than signal trend reversals.
🧭 Summary
📈 Directional Bias: Moderately Bullish
❌ Invalidation: Daily close below 1.1130
🎯 Target Levels:
• Key Resistance: 1.1280
• Extension Zone: 1.1450
🧠 Key Takeaway:
EUR/USD is showing early signs of bullish reversal within a still-constrained technical structure. Demand rejection, institutional long bias, and retail short pressure all align for a potential continuation higher. However, a confirmed breakout above 1.1280 is crucial to validate the scenario.

BTC 4H Chart Analysis - Bitcoin is currently moving within a range, and two potential demand zones are highlighted on the chart with green boxes. There's a possibility that BTC may pull back into one of these zones to collect buy-side liquidity before continuing higher.
These areas can be considered for long setups on the 15-minute timeframe — but only with a valid entry trigger.
---
📌 Key Levels
🟢 Supports:
- 100,000 – 100,500
- 97,400 – 98,700
- 95,900
🔴 Resistances:
- 104,800 – 105,200
- 105,900

What Happens If I Am Late? (Trading Strategy For Beginners)It can happen that for whatever reason you couldn't buy when the market was trading at bottom prices. What then? Am I too late?
It is unwise to buy at any random price and even less with 10X cross leverage. I've seen people doing just that and buying at the top of the range. While it is never too late in relation to the overall market cycle, it can be late for a certain pair.
The time to buy is near support. If bottom prices are not possible, the best option is to wait. Say you miss Bitcoin at $78,800 and prices start to advance. When prices are moving up at $84,000 and rising you can just wait. But if prices peak at $88,000 and then retrace to $84,000, consolidate as a higher low this becomes a second entry. The same when Bitcoin retraced from $95,000 and moved to the $91,000 - $93,000 range. This range becomes a second entry.
Rather than rushing and buying when prices trade, say at $106,000, at the top of the move, we wait for a retrace. If this isn't possible we simply look for another pair.
It is never too late because it depends on what strategy we are using, our Cryptocurrency Trading Plan, and trading style. If you are doing leverage it will depend on the chart setup and the amount of leverage you are using. If you are doing spot, it depends on your goals more than anything because buying can be done at any given time based on the long-term.
It is unwise to rush into Ethereum at $2,500 because you missed $1,600. And you say, "I didn't have any money and I didn't want to miss out." With 10X? What if you lose everything on a flash crash, are you missing out now?
The thing is, that all the pairs are the same when it comes to profits potential. We are looking for a win. So if a pair has a low probability of producing a successful trade, it is no good regardless of the name.
Patience is key.
You can use the comments section to ask questions.
It is not about "breaking the trading rules," it is about your money.
Have you considered what would happen if the market flash crashes just to liquidate you and those in a similar position to yours and then moves up?
You didn't want to miss out, but this not missing out can result in a major loss. It is better to plan and take action based on a strategy rather than rushing, the market is not going away.
Opportunities are endless, and every single day I will be sharing new charts. Some pairs are trading near support and at bottom prices, those are always the best because of the lower risk.
Low risk vs a high potential for reward.
Plan ahead.
Namaste.

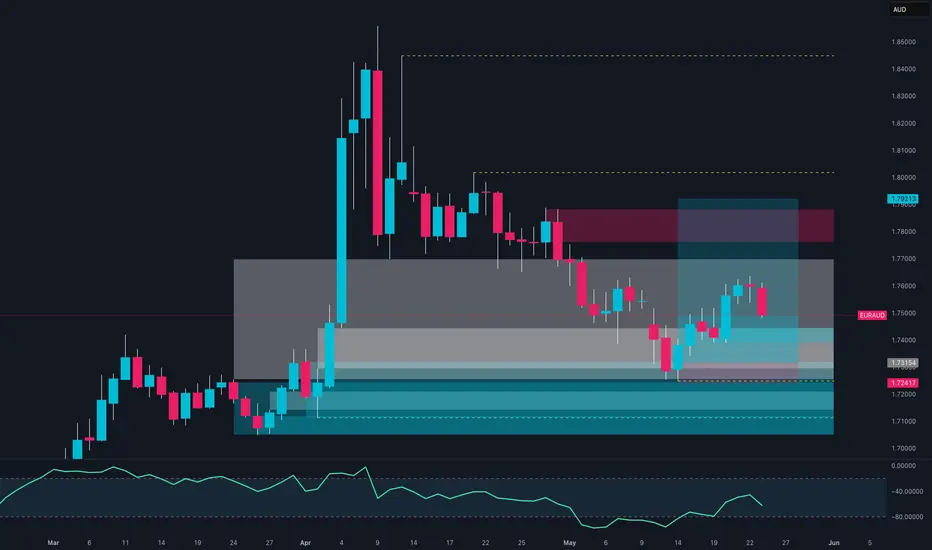
EUR/AUD: Rebound or Continuation of the Drop?EUR/AUD is in a critical situation after a strong bearish trend that pushed the price into a key support area. Analyzing the daily chart, we can observe that the price is testing a strong demand zone, highlighted in blue, from which a potential rebound towards the upper supply zone (in red) could emerge.
The retail sentiment confirms strong short pressure, with 82% of traders positioned on the downside. This excess pessimism suggests, from a contrarian perspective, a possible rebound. Additionally, the oscillator indicates an oversold condition, reinforcing the hypothesis of a correction.
From an institutional point of view, the COT data shows a slight reduction in long positions for both EUR and AUD, but with one detail: speculators remain predominantly long on EUR and short on AUD. Meanwhile, hedgers continue to protect themselves against a possible decline in the euro, demonstrating caution.
In terms of seasonality, May has historically been a weak month for both currencies, but in the last two years, EUR has shown a slight recovery, while AUD has demonstrated signs of stability.
Trading Strategy:
Monitor the reaction to the support zone carefully. A bullish signal in this area could pave the way for a rebound towards the upper resistance. However, a bearish breakout would confirm the ongoing downward trend.

[𝟬𝟱/𝟭𝟮] 𝗪𝗲𝗲𝗸𝗹𝘆 𝗦𝗣𝗫 𝗚𝗘𝗫 𝗣𝗹𝗮𝘆𝗯𝗼𝗼𝗸🔍 IF/THEN QUICK GAMMA PLAYBOOK
IF > 5825 THEN path to 5900 → stall/profit-taking likely
IF > 5900 THEN path to first 5950, then 6000 → gamma squeeze extension zone
IF < 5825 THEN path to 5700 → test of transition zone support
Chop Zone: — re-entry = short-term balance/testing zone
IF < 5700 THEN path to 5500 → gamma flush / dealer unwind risk
🧭 𝗘𝗫𝗧𝗘𝗡𝗗𝗘𝗗 𝗭𝗢𝗡𝗘 𝗠𝗔𝗣/b]
✅ Gamma Flip Level
5700 → This is the confirmed Gamma Flip level = High Volatility Zone = HVL. We are comfortably above it, confirming positive gamma environment.
🧱 Major Call Walls / Resistance to upside from here
5900 → Significant call resistance zone (highlighted across GEX, profile, and /matrix command). 5825–5900 = Current rally zone → expected stall at 5900 (Profit-taking zone)5950 → Next mid-large positive gamma wall to the upside, mid-station between mounts. Dealers short gamma, adding fuel to breakout.6000 → Positive Gamma squeeze continuation target. Gamma squeeze intensifies → likely extends to 6000.🟦 Transition / Chop Zone
5700–5825 → Previous chop range. Retrace could test this before renewed upside.Currently outside and breaking up from this zone, indicating trend initiation.
Balance zone from prior structure.
Expect fade setups if price dips back in.
Needs catalyst or strong sell flow to re-enter meaningfully.
🛡️ Major Put Supports to the downside
5700 → = HVL, also aligned with pTrans and Put support.Dealer unwind risk, downside opens.5500 → Key level if the 5700 zone fails — “total denial zone” of current FOMO.
-----------------------------
This week’s SPX setup remains decisively bullish from a gamma perspective. The GEX profile shows strong positive gamma, with institutional and dealer hedging flows firmly positioned to support continued upside—especially into Friday’s OPEX. The environment is ideal for a controlled melt-up: volatility is softening, implied volatility is trending lower, and there’s no sign of panic in the options market.
Put pricing skew is also declining, which suggests reduced fear and a shift toward more aggressive call buying—another sign of bullish sentiment. Dealer positioning implies that any upward momentum is likely to be chased and hedged into, reinforcing the trend.
However, traders should stay alert: if SPX slips back below 5825, we may see a pause or retracement back into the 5700–5825 transition zone. Only a decisive break below 5700 would flip the gamma regime back to negative and open the door to real downside volatility.

EUR/USD Breakdown in May: Seasonality + Smart MoneyEUR/USD Weekly Outlook – May 15, 2025
EUR/USD is showing clear signs of weakness after a sharp rejection from the key supply zone between 1.1450 and 1.1600. Last week’s candle closed decisively below the 1.1250–1.1300 structure, confirming the failure to sustain bullish momentum. The RSI has also dropped below the 40 level, signaling strong downside pressure.
From an institutional positioning standpoint, non-commercial traders are rebalancing: both longs and shorts on the euro have decreased, while spread positions have increased—suggesting hesitation and a lack of clear conviction. On the other hand, commercials remain heavily long on the euro, but this appears to be more of a hedging move than a directional bias. The US dollar is regaining strength, with new long positions added by speculative traders, aligning with the recent EUR/USD decline.
Retail sentiment shows that a majority of traders are short, but not in extreme proportions. There’s a heavy cluster of long orders between 1.1100 and 1.1050, likely serving as liquidity targets for further downside movement.
From a seasonal perspective, May is historically bearish for EUR/USD. All major seasonal timeframes (5y, 10y, 15y, 20y) point to consistent average negative performance in this month. The current 2025 trend aligns perfectly with this historical pattern, providing a statistical tailwind to the bearish thesis.
Macro-wise, today’s key US data releases—PPI and Retail Sales—could significantly impact the USD. A positive surprise would further strengthen the dollar, adding downward pressure on the pair. Market attention is also focused on Fed Chair Powell's speech later today, which could add fuel to the current move.
Conclusion: The macro, technical, sentiment, and seasonal frameworks all converge on a bearish continuation for EUR/USD. A weekly close below 1.1175 would confirm the downside extension, targeting the 1.0850–1.0700 demand zone. A break above 1.1330 would temporarily invalidate the bearish setup.

GBP/USD Bulls Are Back? Institutions Are Loading Up1. Price Action & Zone Mapping
GBP/USD is consolidating above 1.3300 after a strong bullish reaction near the demand zone between 1.3040 and 1.3150 — an area that has already rejected price twice in recent months.
While the market structure still shows lower highs, the weekly candlestick formation signals a clear loss of bearish momentum. On the upside, the 1.3500–1.3600 zone remains the key supply area to break for a structural reversal to be confirmed.
2. COT Report – Institutional Positioning (as of May 6, 2025)
Non-Commercials (speculators) added +3,320 long positions and reduced -1,956 shorts, bringing the net long to +7,683 contracts — a strong bullish signal.
Commercials remain net short, but not with increasing aggression.
👉 The net positioning supports continued bullish bias, aligned with the recent technical rebound.
3. USD Index – Opposite Positioning
Non-Commercials increased both longs and shorts slightly on the US Dollar Index, but net positioning remains neutral with a slight bearish tilt.
This suggests a phase of indecision or mild retracement in the dollar, which indirectly supports GBP/USD upside.
4. GBP/USD Seasonality – Historical Behavior in May
According to MarketBulls data, May tends to be neutral-to-weak for the pair:
15-year avg: +0.0023
5-year avg: -0.016
2-year avg: +0.0069
Overall, this supports a ranging or corrective phase — not a high-conviction trending month. A breakout may need more confirmation.
5. Retail Sentiment
Currently, 60% of retail traders are short GBP/USD, with an average price of 1.2959, while only 40% are long from 1.3337.
👉 This imbalance favors a contrarian bullish narrative, especially if the market decides to run stops below 1.3300.
✅ Operational Outlook
GBP/USD is showing bullish consolidation signs, backed by:
Increasing institutional long interest
Contrarian retail sentiment (potential fuel for rallies)
Solid demand near 1.3040–1.3150
However, neutral seasonality and lack of structural breakout advise caution. A pullback towards 1.3200–1.3150 might come before any further upside move toward 1.3500.
🔍 Preferred Play: Wait for a retest of 1.3150 with price action confirmation before entering long. A strong breakout above 1.3350 would be early confirmation of renewed bullish pressure.

How to use Dynamic Market Structure to track market moves🔍 Idea Overview
This chart demonstrates the effectiveness of the Dynamic Market Structure Indicator in live conditions, capturing key Break of Structure (BoS) and Change of Character (ChoCH) points. Each zone dynamically adapts based on price behavior and helps identify crucial turning points.
📌 Highlights from the Chart
• ✅ Early BoS detection led to accurate identification of the bullish breakout before the major rally starting May 7.
• ✅ Multiple successful ChoCH zones indicated potential reversal areas and pause zones during sideways consolidation.
• ✅ The green (BoS) and red (ChoCH) horizontal zones aligned perfectly with price reaction levels, acting as reliable support/resistance.
• ✅ During the pullback post-high, the indicator caught clear bearish ChoCH before price dropped nearly $2,000, showing high responsiveness.
📊 Summary of Performance
• Rally captured from ~95,000 to ~104,000 with early BoS signals.
• Sideways zones around 103,000–104,000 marked with structural shifts that predicted stalling.
• Post-drop behavior accurately highlighted re-test of ChoCH zones before reversal attempts.
⚙️ Indicator Logic (Brief)
• BoS (Green): Confirms trend continuation when structure breaks in the direction of the trend.
• ChoCH (Red): Signals a potential trend reversal with key level break.
No repainting. Zones are locked once confirmed.
In volatile markets like BTC, accurate detection of structural shifts can define risk and opportunity. This indicator consistently tracked evolving zones and highlighted major inflection points — without lag or overfitting.

MSTR (Strategy) coming up to $395, the smaller resistance levelNASDAQ:MSTR has rebounded from the bottom fairly fast compared to other stocks and indexes. It's even performed better than Bitcoin itself. However it should be hitting heavy resistance now near 395-400 and above is only heavier resistance. It's time for a pullback and a breather for MSTR. Target is the Point of Control near $350, before going higher. However we could turn bullish again before reaching $350
I personally know someone who played with fire by buying MSTR options calls while it was dropping before, meaning he was trying to catch a falling knife and got burnt finally. He lost nearly $500,000 because of it. So I don't mess with options personally, however I will margin trade with stocks and trade futures, forex and leverage trade cryptocurrencies.

Altcoins Trading Strategy (Tips)There are many ways to approach the market, many ways to approach Crypto. There are strategies focused on the long-term while others will focus on the short-term. Know this, the market is set to grow very strongly.
Now, you might be conditioned to take certain actions or have a reaction when something happens due to past history. Say you went through the strong 2022 bear market and then within the transition years, 2023 and 2024 and all the way through mid-2025, each time there was some bullish action it invariably ended in a strong correction. So you might be thinking, "Hey, after some growth it is all going to crash!" But no, that is not what is going to happen.
You see, the market moves in cycles and these cycles are four years long. Regardless of the transition period, now is not the time to be taking profits after a 20%-30% bullish jump, which is minimum for Crypto.
Yes, you can approach the market short-term but short-term with the conditions we have present now means 200-300%. That would be short-term. After this much growth, close a trade and move to the next pair.
If you are thinking long-term; less dealing, less clicking, easy profits no stress, then buy and hold. The top will be very clear once it comes. If not clear, you will see your profits grow some 500% to 800% and in some cases even more. When your capital is up by that much, you can consider taking some profits.
Remember another one, keep this one in mind. You don't have to be 100% right.
If you are uncertain if you should secure profits in the coming months, you can always sell just a portion, can be 10% or 20% and wait to see what the market does next. It is not necessary to close a position by 100% thinking "I got the top."
Another one, "near the top," is something to keep in mind. Not the exact top just as we don't need to catch the exact bottom. This can result in stress, anxiety and losses. Just be happy and grateful with whatever you receive.
To close this one, never use a stop-loss when trading spot, never. It is a recipe for disaster, just buy and hold and the market will bless you with money, peace of mind, financial success and love.
If you set a stop-loss order, the whales and trading bots will fill your order and you will secure a losing trade. Rather than putting a sell order below your entry price, put it above, always high up, the higher the better, because the exchanges bots are programmed based on the sell orders that people place. If everybody places their orders really high up, this creates pressure on the programs to buy more and more and more. The higher the resistance zone (your sell orders), the more the market will grow.
When the time for shakeouts and corrections comes, do nothing. Either sell BEFORE the correction happens or be prepared to wait long-term. You have to plan BEFORE, not out of an impulse, because the impulse will push you to make mistakes.
I am wishing you success and profits.
If you enjoy the content, consider giving a follow and leaving a comment.
Namaste.

MSTR - Strategy B fractalsVery interesting patters in MSTR stock when using Fibo levels.
By taking the high of 2021 as the reference (fibo = 1) and projecting it to the current cycle we can see that:
2024 mid year top was 1.618 level and mid year low was 0.786 level.
2024 blow off top was 4.236 level.
Now if we take the 2024 consolidation range and apply fibo to the top and lows of that range, we get also the blow off top at the same level: 4.236, and exactly the same price (around $500).
If we recursively apply this to current blow off top and current low in 2025, we would get a blow off top of around $1,500 if we aim at the 4.236 fibo level.

XAU/USD: Institutional Accumulation or New Bearish Impulse?Technical Context:
The graphical analysis shows that the price of gold (XAU/USD) is currently consolidating within a significant demand zone following the recent bullish impulse. The daily chart shows an attempt to bounce off the 3,300 USD zone, a key psychological level.
Volume and COT Analysis:
The latest COT data (April 29, 2025) indicates a slight reduction in long positions by non-commercial operators (-18,519 contracts), balanced by an increase in commercial long positions (+1,659 contracts), signaling potential institutional accumulation.
On the retail sentiment front, traders are slightly more exposed to the downside (51% short vs. 49% long), which could indicate a potential short squeeze if the price resumes an upward trend.
Seasonal Trends:
According to data, May historically shows mixed performances with an average of +9.83% over the last 10 years, but with significant fluctuations between longer and more recent periods.
Key Levels:
Resistance: 3,380 - 3,400 USD (previous distribution zone)
Support: 3,300 USD (current demand zone) and 3,050 USD (secondary support)
Trading Strategy:
Bullish Scenario: Buy above 3,340 USD with a target at 3,400 USD and a stop loss below 3,300 USD.
Bearish Scenario: Sell below 3,300 USD with a target at 3,050 USD and a stop loss above 3,340 USD.

WULF TeraWulf Options Ahead of EarningsIf you haven`t bought WULF before the rally:
Now analyzing the options chain and the chart patterns of WULF TeraWulf prior to the earnings report this week,
I would consider purchasing the 2usd strike price Puts with
an expiration date of 2026-1-16,
for a premium of approximately $0.43.
If these options prove to be profitable prior to the earnings release, I would sell at least half of them.

GBPNZD: Support Rebound! Target 2.26 on the Horizon? The weekly chart of GBPNZD shows a consolidation phase following a strong bearish impulse. The price has reacted positively from the support area around 2.2200, forming a significant bullish candle that could indicate a rebound towards the resistance area at 2.2600. The positive momentum suggests a possible test of the intermediate resistance at 2.2500, with the RSI gradually rising from an oversold zone.
Fundamental Analysis
According to the COT data updated as of April 29, 2025, we observe an increase in long positions on GBP by institutional traders, with an increment of +10,665 contracts. On the other hand, commercial traders (hedgers) continue to maintain a significant short exposure on GBP. This imbalance may suggest a potential short-term speculative interest in a bullish GBP move.
Regarding NZD, the latest COT report shows a significant increase in commercial long positions (+3,884 contracts), indicating a strengthening of the New Zealand dollar. However, the overall market sentiment shows a prevalence of short positions on GBPNZD (59% short vs. 41% long), suggesting that retail traders might be on the wrong side of the market.
Seasonal Analysis
Historically, in May, GBP tends to show weakness (-0.0076 over the last 20 years), while NZD does not show a clear seasonal pattern. This could reduce the likelihood of a decisive GBP movement during this month.
Operational Strategy
The rebound from 2.2200 could favor the opening of long positions with the first target at 2.2500 and the second target at 2.2600. The stop loss could be placed below the key support at 2.2100. In case of a resistance breakout, an extension towards the 2.2700 area would be plausible.

From $1.37 to $8.48 in 5 hours +518% Massive start of the week with 2 Buy Alerts sent out right before vertical move!
$4.00 confirmed as important line in premarket trading already, then quickly set a strong support above it as soon as market opened and when it came down to re-test it again after initial pop it was showing strong hidden buying in that area which was confirming everything else we were looking and aiming for - power vertical squeeze to new highs.
Biggest stock gainer of the entire stock market today AMEX:GPUS
Get ready for next ones!

They Were 84% Short — Here's What Happened Next on GBPAUDThis is not just a simple breakout — this is what happens when data, price action, and psychology align with surgical precision.
Today, we entered a long position on GBPAUD directly from a well-defined weekly demand zone. The setup was already technically solid, but what made it exceptional was the alignment of multiple institutional-grade factors:
✅ Weekly demand zone respected to the pip, with proven historical sensitivity
✅ Change of structure on the H1 chart, confirming a short-term reversal from a deeply discounted area
✅ COT data showing a clear build-up of commercial long positions on the British pound
✅ AUD net positioning deep in negative territory, with declining open interest and no signs of reversal
✅ Retail sentiment: 84% of traders short on GBPAUD according to MyFxBook → strong contrarian signal
✅ Seasonality: GBP tends to outperform AUD during May and June
The result? A rapid and aggressive bullish impulse that allowed us to move the stop loss to break-even just a few hours after entry.
📌 Current trade status:
➤ Long from the demand zone
➤ SL at BE = zero risk
➤ Monitoring price action above 2.07 for potential continuation
🎯 Mid-term target zone: 2.1150–2.1300, with focus on liquidity clusters and previous inefficiencies as potential magnets.
This is how you build trades that are not just reactive, but proactive — based on multiple layers of confluence and edge, not on emotions or noise.
MICROSTRATEGY: Big 1W MA50 rebound targeting $845 at worst.MicroStrategy is on excellent bullish technicals on its 1D outlook (RSI = 67.412, MACD = 25.350, ADX = 58.097), capitalizing on the double bottom rebound on the 1W MA50 four weeks ago. Technically that was also a HL bottom on the 2 year Channel Up. The minimum rise it delivered on a bullish wave was +263.38%. Based on that, the trade is long, TP = $845.
## If you like our free content follow our profile to get more daily ideas. ##

Strategy $MSTR hits resistance, what will it do?
NASDAQ:MSTR has rebounded from the bottom fairly fast compared to other stocks and indexes. It's even performed better than Bitcoin itself. It is up about 65% from the low we set a few months ago. However it should be hitting heavy resistance now near 395-400 and above is only heavier resistance. It's time for a pullback and a breather for MSTR. Target is the Point of Control near $350, before going higher. However we could turn bullish again before reaching $350.
I personally know someone who played with fire by buying NASDAQ:MSTR options calls while it was dropping before, meaning he was trying to catch a falling knife and got burnt finally. He lost nearly $500,000 because of it. So I don't mess with options personally, however I will margin trade with stocks and trade futures, forex and leverage trade cryptocurrencies.
