WULF TeraWulf Options Ahead of EarningsIf you haven`t bought WULF before the rally:
Now analyzing the options chain and the chart patterns of WULF TeraWulf prior to the earnings report this week,
I would consider purchasing the 2usd strike price Puts with
an expiration date of 2026-1-16,
for a premium of approximately $0.43.
If these options prove to be profitable prior to the earnings release, I would sell at least half of them.
Strategy

GBPNZD: Support Rebound! Target 2.26 on the Horizon? The weekly chart of GBPNZD shows a consolidation phase following a strong bearish impulse. The price has reacted positively from the support area around 2.2200, forming a significant bullish candle that could indicate a rebound towards the resistance area at 2.2600. The positive momentum suggests a possible test of the intermediate resistance at 2.2500, with the RSI gradually rising from an oversold zone.
Fundamental Analysis
According to the COT data updated as of April 29, 2025, we observe an increase in long positions on GBP by institutional traders, with an increment of +10,665 contracts. On the other hand, commercial traders (hedgers) continue to maintain a significant short exposure on GBP. This imbalance may suggest a potential short-term speculative interest in a bullish GBP move.
Regarding NZD, the latest COT report shows a significant increase in commercial long positions (+3,884 contracts), indicating a strengthening of the New Zealand dollar. However, the overall market sentiment shows a prevalence of short positions on GBPNZD (59% short vs. 41% long), suggesting that retail traders might be on the wrong side of the market.
Seasonal Analysis
Historically, in May, GBP tends to show weakness (-0.0076 over the last 20 years), while NZD does not show a clear seasonal pattern. This could reduce the likelihood of a decisive GBP movement during this month.
Operational Strategy
The rebound from 2.2200 could favor the opening of long positions with the first target at 2.2500 and the second target at 2.2600. The stop loss could be placed below the key support at 2.2100. In case of a resistance breakout, an extension towards the 2.2700 area would be plausible.

From $1.37 to $8.48 in 5 hours +518% Massive start of the week with 2 Buy Alerts sent out right before vertical move!
$4.00 confirmed as important line in premarket trading already, then quickly set a strong support above it as soon as market opened and when it came down to re-test it again after initial pop it was showing strong hidden buying in that area which was confirming everything else we were looking and aiming for - power vertical squeeze to new highs.
Biggest stock gainer of the entire stock market today AMEX:GPUS
Get ready for next ones!

They Were 84% Short — Here's What Happened Next on GBPAUDThis is not just a simple breakout — this is what happens when data, price action, and psychology align with surgical precision.
Today, we entered a long position on GBPAUD directly from a well-defined weekly demand zone. The setup was already technically solid, but what made it exceptional was the alignment of multiple institutional-grade factors:
✅ Weekly demand zone respected to the pip, with proven historical sensitivity
✅ Change of structure on the H1 chart, confirming a short-term reversal from a deeply discounted area
✅ COT data showing a clear build-up of commercial long positions on the British pound
✅ AUD net positioning deep in negative territory, with declining open interest and no signs of reversal
✅ Retail sentiment: 84% of traders short on GBPAUD according to MyFxBook → strong contrarian signal
✅ Seasonality: GBP tends to outperform AUD during May and June
The result? A rapid and aggressive bullish impulse that allowed us to move the stop loss to break-even just a few hours after entry.
📌 Current trade status:
➤ Long from the demand zone
➤ SL at BE = zero risk
➤ Monitoring price action above 2.07 for potential continuation
🎯 Mid-term target zone: 2.1150–2.1300, with focus on liquidity clusters and previous inefficiencies as potential magnets.
This is how you build trades that are not just reactive, but proactive — based on multiple layers of confluence and edge, not on emotions or noise.
MICROSTRATEGY: Big 1W MA50 rebound targeting $845 at worst.MicroStrategy is on excellent bullish technicals on its 1D outlook (RSI = 67.412, MACD = 25.350, ADX = 58.097), capitalizing on the double bottom rebound on the 1W MA50 four weeks ago. Technically that was also a HL bottom on the 2 year Channel Up. The minimum rise it delivered on a bullish wave was +263.38%. Based on that, the trade is long, TP = $845.
## If you like our free content follow our profile to get more daily ideas. ##

Strategy $MSTR hits resistance, what will it do?
NASDAQ:MSTR has rebounded from the bottom fairly fast compared to other stocks and indexes. It's even performed better than Bitcoin itself. It is up about 65% from the low we set a few months ago. However it should be hitting heavy resistance now near 395-400 and above is only heavier resistance. It's time for a pullback and a breather for MSTR. Target is the Point of Control near $350, before going higher. However we could turn bullish again before reaching $350.
I personally know someone who played with fire by buying NASDAQ:MSTR options calls while it was dropping before, meaning he was trying to catch a falling knife and got burnt finally. He lost nearly $500,000 because of it. So I don't mess with options personally, however I will margin trade with stocks and trade futures, forex and leverage trade cryptocurrencies.

GOLD (XAU/USD, 4H) updateOn the 4-hour chart, GOLD has broken below the lower boundary of a pennant pattern on increasing volume, signaling potential for continued downside. Despite this, the asset remains within the confines of a bullish megaphone structure, whose boundaries are still intact. The EMA indicators (20/50/100/200) are aligned in a bearish sequence, exerting downward pressure. The price is consolidating below the $3295 level and is approaching key demand zones.
Near-Term Downside Targets:
- $3177 — Intermediate demand zone
- $3063 — Major support level
Technical Highlights:
- Breakdown from bearish pennant confirmed by volume
- Price action continues within the bullish megaphone pattern
- EMA 20/50/100/200 positioned above price, indicating overhead resistance
- Volume increases observed during downward moves
- Key buyer interest zone: $3060–$3080
- Resistance zone: $3295–$3305
Following the breakdown from the consolidation pattern, gold is exhibiting a downward trajectory targeting support zones at $3177 and $3063. The bearish scenario is technically confirmed as long as the price remains below $3295. However, the movement within the bullish megaphone structure warrants close monitoring for potential shifts in momentum.

AMZN Amazon Options Ahead of EarningsIf you haven`t bought AMZN before the previous rally:
Now analyzing the options chain and the chart patterns of AMZN Amazon prior to the earnings report this week,
I would consider purchasing the 210usd strike price Calls with
an expiration date of 2025-6-20,
for a premium of approximately $3.75.
If these options prove to be profitable prior to the earnings release, I would sell at least half of them.
Disclosure: I am part of Trade Nation's Influencer program and receive a monthly fee for using their TradingView charts in my analysis.

S&P500: Rebound or Bull Trap?Over the past week, the S&P500 weekly chart showed a key technical signal: the formation of a bullish engulfing.
This pattern emerged after several weeks of strong monthly bearish pressure, suggesting a potential reversal attempt or, at the very least, a technical rebound.
Analyzing the key levels, the price reacted inside a major demand area (visible on the monthly timeframe), positioned between 5,450 and 5,500 points.
The reaction from this zone reinforces the validity of the engulfing and suggests the market could now aim for the first resistance targets around 5,600 - 5,650.
Further upside targets are located at 5,837 and 6,023, previously marked as high-confluence zones.
From an institutional positioning perspective, the latest COT Report (April 22, 2025) reveals interesting developments:
Commercials (big players) increased their long contracts by +22,226 units, showing strong interest in upside protection.
Non-Commercials (speculators) also increased their longs (+8,754), but added even more to their shorts (+20,667).
The Net Positioning for Non-Commercials remains negative but has stabilized at less extreme levels compared to March, suggesting a possible phase of accumulation or preparation for a sentiment shift.
📊 The Net Positions chart shows a reduction in net short pressure — a warning sign for those still heavily short.
Summary:
The weekly engulfing is a technical signal not to underestimate.
We are trading within a strong monthly demand zone.
COT data suggests a decrease in bearish pressure, although not yet a full sentiment reversal.
However, caution is necessary: a firm break below 5,450 would invalidate the bullish signal and reopen the path toward corrections at 5,200 and 5,000.
Current Strategy:
Slight bullish bias above 5,500.
Short-term target: 5,600 → 5,650.
Next targets: 5,837 and 6,023.
Invalidation level: weekly close below 5,450.
Watching the price action around key resistance levels will be crucial: the market will decide whether this rebound consolidates or becomes just a trap for new buyers.

GBP/JPY at the Edge! Bounce or Breakdown? The weekly chart of GBP/JPY reveals a highly volatile scenario, with a recent bearish expansion pushing the price back toward a key support zone between 185.00 and 188.30 — an area that has been defended multiple times in the past. After an attempted recovery toward the supply zone between 194.00 and 195.00, the pair encountered heavy selling pressure, failing to break out and sharply reversing.
From a technical perspective, the move suggests a possible swing failure above local highs, with the current weekly candle confirming a return below resistance. Price action is now within a critical area: if the current support holds, we could see a technical rebound with interim targets at 191.40 and potentially back toward 194.00. However, a breakdown below 185.00 would open the door to deeper correction, with possible extensions toward 182.00 and 180.00 — both zones marked by previous accumulation.
The RSI, after dipping into oversold territory, is now attempting a reaction, indicating that buyers are trying to regain control, though the structure remains fragile. Strategically, this phase demands caution: aggressive longs may seek confirmation of reversal above current lows, while bearish traders should closely watch for a confirmed breakdown below support. The 188.30 to 191.40 price range will be key to monitoring the next directional move.

GBP/NZD Breakdown Imminent? Smart Money and Seasonality Say YES!🧠 1. Price Action & Technical Structure
Price was firmly rejected from the monthly supply zone between 2.33 – 2.35, marked by strong bearish candles.
A bounce occurred at the weekly demand between 2.20 – 2.22, where accumulation and a short-term reversal formed (dashed white arrow).
Currently, price is trading near the lower bound of a compression range (2.22 – 2.26), sitting below a key intermediate resistance (dark teal zone).
RSI is in the neutral-to-low zone, with no major divergence, leaving room for further downside.
Technical Bias: Neutral to Bearish unless we get a weekly close above 2.26–2.27.
📊 2. COT Data
GBP
Asset Managers remain net short, though improving since January.
Leveraged Money sharply reducing long exposure since early April → Institutional bullish sentiment weakening.
NZD
Asset Managers have been heavily short for over a year, but shorts are being reduced since February → slight sentiment recovery.
Leveraged Money flat, with no clear long build-up yet.
➡️ Combined COT Outlook: The GBP's advantage over NZD is fading. This supports a sideways to slightly bearish outlook on GBP/NZD.
📅 3. Seasonality
April: Historically bearish for GBP/NZD (–0.2971 avg.), aligning with current downward move.
May: Also typically bearish (–0.2964 avg.) → suggesting potential continued weakness.
➡️ Seasonal Bias: Bearish through mid-to-late May.
🧠 4. Retail Sentiment
Around 70% of retail traders are long GBP/NZD → classic contrarian bearish signal.
Average long entry: 2.1800, current price: 2.2246 → many longs in profit.
Potential for profit taking or breakeven pullback adds to bearish pressure.
📌 Trade Plan Summary
Weekly Bias: → Bearish / Range-bound
📉 Short Zones of Interest:
2.26 – 2.27 → key resistance zone
Stop above 2.2850 (H4/H1 close above invalidates setup)
🎯 Targets:
2.2050 → recent demand re-test
2.1850 / 2.1650 → deeper demand zones visible on chart
🧠 Invalidation Level:
Daily close above 2.2850 → structure turns bullish

USDCAD at Risk? COT Turns Bearish📊 COT Overview – CAD & USD Futures
🇨🇦 Canadian Dollar (CAD)
Asset Managers: Still net short, but recovering fast → from -150K to nearly -50K.
Leveraged Money: Strong bullish reversal from -100K to -30K and climbing.
✅ Interpretation: Institutions are flipping bullish on CAD → Bearish pressure on USDCAD.
🇺🇸 US Dollar (USD)
Asset Managers: Cutting long exposure since March.
Leveraged Money: Losing conviction → neutral to slightly long.
⚠️ Interpretation: USD is structurally weakening → adding to the USDCAD bearish bias.
🧠 Technical Analysis
Price has returned to the key demand zone (1.3700–1.3850) for the third test.
Candles are compressing → signal of upcoming volatility.
RSI remains weak, no bullish divergence → no clear reversal yet.
📌 Key Levels:
Support: 1.3700 → A confirmed break opens space toward 1.3550–1.3480.
Resistance: 1.3950–1.4100
🎯 Trade Scenarios
🔻 Breakdown trade below 1.3700 → Target: 1.3480
🔁 Pullback short on rejection from 1.3950–1.4000 → SL above 1.4100
🔼 Long only with a bullish engulfing weekly close + RSI divergence
✅ Summary
COT Bias: Bearish USDCAD → CAD strengthening, USD weakening
Technical Structure: Support under pressure, breakout likely
Preferred Play: Short continuation on breakdown or pullback rejection

$XYZ pullback would be a gift for longsNYSE:XYZ back in bull trend here since tapping the 50 psych level. The 100WMA showing some confluence here with bull flag + trendline break from last month's disaster.
Fibs also coincide with some of the idea here with us currently in the golden zone
Short term, I'd take a stop here below 52.50 as it can get ugly back to 50, and would consider taking another long there at 50.
For now, 53-54 range looks good for long pullback. 54.60 is the 333SMA on the 1HR chart here. Looks like a great spot for starter entries. If the pullback does not come, a break above 57 (pm highs TODAY, 4/23) should see a nice push towards 60 psych level which could see some strong resistance. Targeting 62 if we break 60.
Leaps look great here with all this confluence. Easy stop below that 50 psych.
Targets on chart are assuming we do not get a pullback tomorrow. If we do, the r/r becomes much better to the long side. This chart does not look good for bears. Options flow
Thoughts on XYZ?

MRK Merck Options Ahead of EarningsAnalyzing the options chain and the chart patterns of MRK Merck prior to the earnings report this week,
I would consider purchasing the 80usd strike price Calls with
an expiration date of 2026-1-16,
for a premium of approximately $8.50.
If these options prove to be profitable prior to the earnings release, I would sell at least half of them.

CHTR Charter Communications Options Ahead of EarningsAnalyzing the options chain and the chart patterns of CHTR Charter Communications prior to the earnings report this week,
I would consider purchasing the 360usd strike price Calls with
an expiration date of 2025-9-19,
for a premium of approximately $22.35.
If these options prove to be profitable prior to the earnings release, I would sell at least half of them.

$0.90 to $6.14 or +580% upside in early premarketEarly premarket gets the bird is the saying and definitely true for NASDAQ:GELS
By 4:15 am it was up +500% already
Little dip to $3 and 6:30 am to new highs $6+

USDCAD Ready to Collapse? COT Signals a Bearish Storm!🔎 1. COT Context – Canadian Dollar (CAD)
Asset Managers: Consistently net short for most of the period, but since January 2025, there's been a strong recovery—net positions have become progressively less negative. By mid-April, they’re still short, but significantly less so.
Leveraged Money: Also heavily short in December 2024, but showing a clear bullish reversal starting in early 2025, with net positions turning increasingly positive on CAD.
✅ Interpretation: There's been a clear sentiment shift from bearish to bullish on CAD starting late 2024. This adds downward pressure on USDCAD.
💵 2. COT Context – US Dollar Index (USD)
Asset Managers: Consistently long, but reducing their net exposure since late March 2025.
Leveraged Money: Opposite of CAD – heavily short in December 2024, now recovering, though without strong momentum. Positions are hovering around neutral.
⚠️ Interpretation: While CAD grows stronger, USD shows signs of indecision or profit-taking. This amplifies the bearish bias on USDCAD.
📉 3. Technical Analysis – USDCAD
Current Price: 1.38369, right near a strong demand zone between 1.3700 – 1.3830, which has already been tested multiple times.
The current weekly candle is forming a doji or pin bar, hinting at a potential technical bounce.
Key Resistance: 1.45215 (monthly high).
Key Support: 1.3700. A breakdown below this could trigger a move toward 1.3480.
RSI: Neutral to slightly bearish, no major divergences observed.
🧠 Technical Outlook:
If the 1.3700–1.3830 zone holds, we might see a corrective bounce toward 1.4000–1.4100.
If that zone breaks, expect a bearish continuation toward 1.3580–1.3480.
📊 Trade Summary
Fundamental Bias (COT): Bearish USDCAD → Strong CAD, weakening USD.
Technical Bias: Neutral to bearish, potential for short-term bounce before continuation.
🧭 Trade Plan
🎯 Short on pullback toward 1.4000–1.4100 with stop above 1.4150, targeting 1.3600–1.3500.
🎯 Breakout trade below 1.3700 → Enter on daily close confirmation, target 1.3480.

$2.29 to $11.17 in 45 minutes $UPXI🔥 $2.29 to $11.17 in 45 minutes with Buy Alert sent in trading view chat before $6 with more than enough of time before it went vertical to $12 🚀
While the rest of the world woke up into red, it's great to catch highly predictable trade like this early Monday morning
Been doing it for 20 years, I hope you profited along! You're most welcome 😉
NASDAQ:UPXI

GBP/USD in terminal phase? This zone could flip everything!📊 Technical Analysis
Price is currently trading in a strong weekly/monthly resistance zone around 1.3390–1.3400, marked by a dense multi-layer supply area. Historically, this level has caused sharp rejections.
From the lows, price completed a steep bullish leg, breaking through several structures. However:
Momentum seems overstretched.
RSI shows potential overbought signals.
There's a likely bearish target zone between 1.2950 and 1.2850, which is a key demand area.
📌 Trade Setup:
I’m watching for exhaustion signals or bearish confirmations on H1 to short from the current resistance, targeting the grey and turquoise zones below 1.30.
🧾 COT Report – GBP
Large Speculators (Asset Managers) still hold a net short position, although they've reduced exposure in recent months.
Leverage Funds remain slightly long, but without strong conviction.
💵 COT Report – USD
Leverage Funds have turned significantly net long on the dollar (strong green line upward since March).
This supports a bearish view on GBP/USD, as USD strength returns.
📉 Summary:
Price is at a key decision zone. A technical correction is possible. COT data supports this view:
GBP remains weak on the institutional side.
USD is regaining strength.

EUR/NZD About to Explode? Traders Are Watching THIS Level!📊 General Analysis of EUR/NZD (Higher Timeframe)
1. 📌 Price Context
The price had a strong bounce from a demand zone (highlighted in light blue) around 1.85.
It then broke through multiple supply zones (gray and maroon) to the upside and is currently hovering near 1.91874.
🔍 Key Zones
🔵 Demand Zone (Support)
Range: 1.8430 – 1.8712
This zone has been tested multiple times, with long wicks to the downside → indicating strong buying interest.
A powerful bullish move originated from this area.
🔴 Supply Zone (Resistance)
Current resistance: 1.9187 – 1.9450
This is where the price is currently paused → potential rejection area.
Monthly upper zone (1M): 1.96 – 2.00
A strong long-term resistance. If reached, we might see profit-taking or even a reversal.
🕯️ Candles & Momentum
The large green candle represents a strong bullish breakout.
The weekly candle (labeled "1W") shows indecision → this could be a pause before continuation or the beginning of a pullback.
🔮 Possible Future Scenarios
✅ Bullish Scenario
If the price decisively breaks above 1.9187, the next target is 1.9600 – 2.0000.
⚠️ Bearish Scenario
If price gets rejected at current levels, it may fall back into the support zone 1.8712 – 1.8500, which has previously shown strength.
📈 Lower Indicator (Likely RSI or Wavetrend)
Currently bouncing from an oversold area.
No clear overbought signals → there’s room for more upside.
🧭 Conclusion
Current trend: Bullish (especially in the short to mid term).
Key levels to watch:
Resistance: 1.9187 and 1.96–2.00
Support: 1.8712 and 1.85

GBP/CAD at a crossroads: this key level could trigger the drop!My visual analysis highlights a strong multi-timeframe resistance zone (weekly and monthly) between 1.8662 and 1.8779, where price has reacted sharply multiple times. This area, marked in dark burgundy, signals a significant supply zone.
Currently, price is trading back in the 1.8350–1.8400 region. Based on my note on the chart ("Looking for a short opportunity on H1"), I’m anticipating a potential short entry from lower timeframes—likely triggered by a structural break or bearish candlestick confirmation.
🔻 Bearish Scenario:
If I get a short confirmation around the current area, I’ll be targeting the 1.7900–1.7677 demand zone (highlighted in deep blue), which has previously shown strong bullish reactions.
The RSI is also showing signs of potential divergence or overextension, adding weight to the bearish thesis.
🟢 Alternative Scenario:
If price decisively breaks above the 1.8780 monthly resistance, we could see an extended bullish move towards levels not currently visible on this chart.
📌 Operational Note:
I’ll be looking for entry confirmations on lower timeframes (like H1), with valid reversal patterns or price action triggers, and will manage the position dynamically depending on how price behaves around the 1.79 zone.

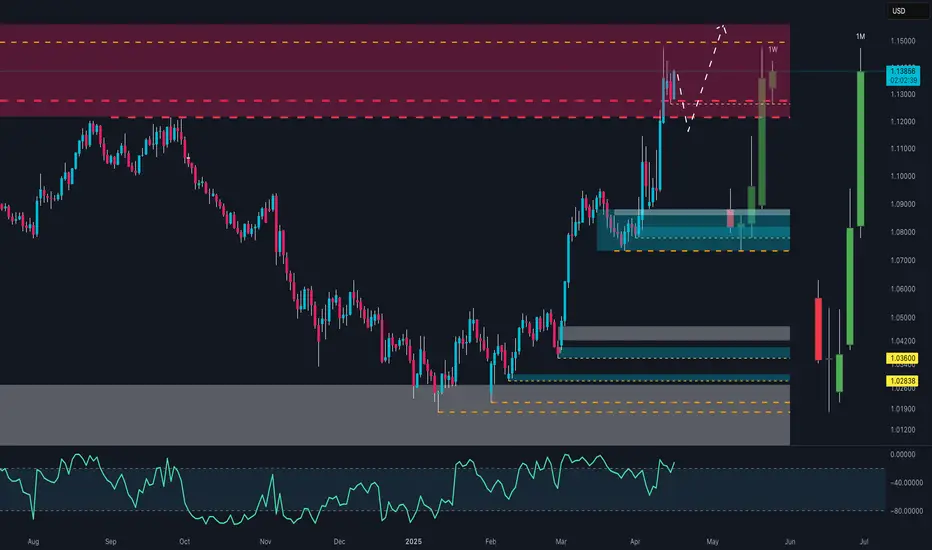
EUR/USD at Key Decision Zone – Breakout or Smart Money Trap?🟢 Current Context
Price: 1.13820 USD
Trend: Strong bullish structure, with impulsive moves especially in April.
Main timeframe: Appears to be daily or weekly, with multi-timeframe zones (1W, 1M marked).
🧱 Key Zones
🔴 Supply Zone (1.13000–1.15000)
Well-defined area of historic selling pressure. Price reacted with a temporary drop but bounced right back into it.
🟦 Demand Zone (1.08500–1.10000)
Major order block where the current rally was initiated. Price used this as a base to launch higher.
⚫ Lower Supports
1.03600: Weekly support
1.02838: Monthly support
Broad accumulation zone (grey box) from which this trend began.
📈 Price Structure
Strong breakout above 1.10–1.11 resistance.
Currently pulling back inside the supply zone – the dashed arrows hint at potential liquidity sweeps before a continuation to 1.15+.
🔍 Momentum Indicator (likely RSI/CCI)
Currently elevated, but not yet in extreme overbought. No clear divergence. Momentum favors bulls.
📊 Scenarios
✅ Bullish:
Clean break above 1.14500–1.15000 opens the door to 1.1600 and 1.1800. Wait for a structural retest for safer long entries.
⚠️ Bearish (corrective):
Strong rejection from the supply zone → potential pullback to 1.10–1.0850 (blue zone).
Only below 1.0850 would a deeper bearish structure toward 1.03600 be confirmed.
🧠 Strategic Note
This is a zone of clear smart money activity: liquidity grabs on both ends.
Watch how this weekly candle closes – we’re either validating above 1.13 or setting up a trap for late longs.
Crypto Risk Management: The Most Overlooked EdgeIn the thrilling yet unforgiving world of crypto, profit potential is massive—but so is the risk. Every trader or investor enters the space with dreams of 10x gains, but without a solid risk management strategy, many exit just as fast—with a trail of losses.
Risk management is the art of protecting your capital while giving yourself the best shot at long-term profitability. It’s not just a skill; it’s a survival strategy.
What Are the Risks in Crypto?
Crypto markets are unique—24/7, global, and driven by emotion, hype, and tech disruption. With that come several risk categories:
Market Risk – Volatile price swings can wipe out unprepared traders.
Liquidity Risk – Low-volume coins can be hard to exit during dumps.
Regulatory Risk – Government crackdowns or bans (e.g., Binance or XRP cases).
Security Risk – Hacks, rug pulls, phishing scams, and smart contract bugs.
Operational Risk – Mistakes like sending funds to the wrong address or using faulty bots.
These risks aren’t just theoretical—think of the LUNA/UST collapse or the FTX debacle. Billions were lost due to poor risk management at multiple levels.
🧠 Core Principles of Risk Management
To stay in the game long-term, you need to adopt some fundamental principles:
Preserve capital first, profit later.
Risk small, aim big.
Never risk more than you can afford to lose.
Think in probabilities, not certainties.
Be consistent, not lucky.
Even the best traders lose—but they survive because they manage their downside better than the rest.
🛠️ Tools & Techniques That Can Save Your Portfolio
1. ✅ Position Sizing
Don’t bet your whole stack on one trade. A common approach is to risk 1–2% of your portfolio per trade. That way, even a streak of bad trades won’t destroy your capital.
2. 🛑 Stop-Loss & Take-Profit
Always have predefined stop-loss levels to cut losses, and take-profit targets to lock in gains. Trading without a stop-loss is like driving without brakes.
3. 📊 Diversification
Spread your investments across different sectors (DeFi, AI, Layer 1s, etc.). Don’t rely on one narrative or one coin.
4. ⚖️ Leverage Control
Leverage can amplify gains—and losses. Avoid high leverage unless you’re an experienced trader with a tight plan.
5. 🔁 Portfolio Rebalancing
Adjust your allocations periodically. If one asset balloons in value, rebalance to lock in gains and manage exposure.
6. 💵 Using Stablecoins
Stablecoins like USDT, USDC, or DAI are great for hedging during volatility. Park profits or prepare dry powder for dips.
🧠 Psychological Risk: The Silent Killer
Many traders don’t lose due to bad analysis—they lose to emotions.
FOMO leads to buying tops.
Fear leads to panic selling bottoms.
Revenge trading after losses leads to bigger losses.
Greed blinds you from taking profits.
The key is discipline. Create a plan, follow it, and review your mistakes objectively.
🚫 Common Mistakes to Avoid
Going all-in on one trade or coin
Holding through massive drawdowns hoping for a recovery
Ignoring stop-losses
Overleveraging small positions to “win it all back”
Risk management is about avoiding unnecessary pain, not killing your gains.
🧭 Final Thoughts
The best traders in crypto aren't those who win big once—they're the ones who survive long enough to win over and over. Risk management is your edge in a market that respects no one.
Whether you’re a scalper, swing trader, or long-term HODLer, never forget: capital is your lifeline. Guard it with your strategy, protect it with your plan, and grow it with patience.
✍️ By Green Crypto
Empowering traders with analysis, tools, and education. Stay sharp. Stay profitable.
