EUR/USD Targeting ResistanceTargeting resistance at 1.1387.
• EUR/USD keeps on pushing higher. Daily
resistance lies at 1.1387 (20/11/2015 high). Hourly
support may be found at 1.0711 (05/01/2016
low). Yet, expected to show further increase.
• In the longer term, the technical structure
favors a bearish bias as long as resistance
holds. Key resistance is located region at 1.1453
(range high) and 1.1640 (11/11/2005 low) is likely
to cap any price appreciation. The current
technical deterioration favors a gradual
decline towards the support at 1.0504 (21/03/2003 Low).
Here at Unique Forex we combine our team's 40+ years of trading experience with our proprietary algorithm to significantly enhance the trading experience. Utilizing the two, we are able to offer some of the most powerful research on an array of currency pairs. Here you will get all of our research on some of the more popular majors like the EURUSD, but if you would like to get access to the rest of our research head over to www.unique4xpro.com
Strength

AUDUSD DAILY COULD GO EITHER WAY KEEP AN EYE ON ITHowdy,
This could go either way so worth keeping an eye on this pair as today's candle has not finished yet
We have as you can see resistance but that could break through and retest as new support to go higher or create a new lower low.
As always any feedback welcome good or bad.....still learning before I go LIVE

XAUUSD inverse H&S, break up of necklineRecently, Gold broke up above intermidiate resistance/neckline. On chart, you can see inverse Head and Shoulders pattern which usually leads to reversal of previous trend. Since Reversal candle on the 1st of January of 2015 it feels much more constructive. Nice 2 days of rally after that actionable signal. Then it broke up resistance at $1,204 which later became our new pivot support. After 3 days of rally we have small reversal candle which may lead to digestion or pullback (reason to cover some if you are long, doesn't mean short) that is healthy as gold already gained 4.5% since the beginnig of new 2015 year.
First area to look for entry Long is $1,223 - break point of neckline and previous swing high. Then we have 21 EMA and bigger support at $1,204.
From fundamental point of view we can see increase in demand, as wedding season takes place in many countries. India is prominent one.
My first intermidiate target is $1,255. Macro target $1,300-$1,330

HOW TO DETERMINE THE STRENGTH OF A CURRENCYOne way to determine the strength of a currency is to add 2 moving averages to the charts, one set to 5 and one set to 12. If both the 5 MA and the 12 MA is pointing upwards, that means +1 and vice versa if both of the MA:s are pointing downwards. If they are pointing against each other, different direction or are flat lined, thats equals 0 as we are most likely in a consolidation.
On the chart above we have determined the daily strength of EUR. Today EUR is moderate or "0".
When we have determined the strength of all major pairs: EUR, USD, GBP, JPY, CAD, NZD, AUD and CHF you will have a clear view of what pairs are strong respective weak. We don't want to be trading pairs that have for example: EUR -5 and CAD -6, because these pairs are both weak and won't move very much, very likely to be in a consolidation. We want to combine the strongest against the weakest and vice versa, example if EUR is +5 and USD is -6, we are then looking for opportunities to go long on EUR/USD.
Remember to use all your knowledge while trading, daily currency strength is a great tool to pick out the best pairs to trade for the day.
Today EUR is 0 and USD is +7, so we are looking of opportunities to go short on EUR/USD and if we take a look at the EUR/USD chart, we can see that we are two legs down, (the market usually moves no more - almost never more than 3 legs before if have to refresh itself. Also if the second leg is bigger than the first, we can expect a third leg. If the third leg is bigger than the second leg, we can expect a test, then market have to refresh itself before it can continue down further) the second leg is pretty much the same size as the first leg, so we can expect a 3d leg to come in, or at least a test. However, we can't enter the trade at the current price so we wait until it pulls back to our expected area of entry and leave a wick indicating its struggling at this area, we then go down to the 240 TF (/ 60 TF) to see if we can count the legs of the pullback and get an ideal entry.
Here is a checklist on how to trade PRICE ACTION with daily currency strength.
1) Check market strength.
2) Look for fresh moves (V Formations).
3) Identify structure priority (Legs).
4) Look for ideal S/R.
5) Estimate R:R.
6) Watch only the view chart pullback until or near the S/R (and leave a wick/tail).
7) Go down one timeframe to see if the legs are visible.
8) Enter trade accordingly to plan of action.
9) Keep sister markets ready.
10) Watch the group of the moving currency to understand areas of halt.
11) Update journal with target information.
NOTE: This is a universal application, meaning that it doesn’t matter what approach or strategy you have to the market, it simply shows you the best pairs to trade so that you can apply your strategy accordingly.
I hope this helps and I will be posting more trades on TradingView so you get a clearer view of how to trade price action with daily currency strength, and increase your profits to the max without being greedy :)
Daily Currency Strength: Pre-Asian, London and New York Opening now available at www.tradingwhales.com

$TSLA, lots of technical resistance, lots of potential$TSLA has a lot of resistance at the current levels. However, if Tesla can reclaim the 50 day, it is a sign of strength, and could lead it to the next high of ~$320.
A reclaim of the 50 day means: Gap is almost filled, $245 resistance broken, regression channel broken, and of course the 50 day is broken, leaving only $265 resistance, which isn't as strong.

WMT poking its head and looks ready to goNice, bull candle closed near highs,that resolved wedge with bunch of inside, choppy and noisy candles.
Lets see to what it leads, need to hold breakout point at $76.90.
As markets recent momentum remains neutral to negative and long-term macro picture in Wal-Mart is neutral it makes probability of this trade lower. I manage probability of trades with tier system. So, may initiate long trade above $77.50 with tier 1.

OBV: Hidden Bullish StrengthIt took double the volume of move A to retrace it fully.
It takes 2 bears to defeat 1 bull sort of speak.
To me this is indicating hidden bullish strength.

MCD Long; 150EMA Support - Risk:Reward Of 62:1This trade setup is pretty simple and doesn't require any rocket science. McDonald's, or MCD, is a component of the DOW30. MCD has been in a trading range on the weekly chart for quite some time now. We are currently at the bottom of this range, providing an excellent opportunity to get long. I'm using covered calls in this name to get long the stock at as cheap a price as possible. The RSI show at label (A) is finding support in the oversold zone we have seen it bounce from before. In addition, we have moved off the 150EMA Weekly, which if you look at the green ellipse has previously held up since about 2007-2008 (not shown in this chart). There are two long possibilities here for me:
1) Buy MCD at 93.68 and Sell the Oct. 100 Call for $0.27 making your cost basis $93.41. With our stop on a close below $93.05 we are risking about $0.36 to make a maximum of $6.59. That's a risk reward of 18:1.
2) 1) Buy MCD at 93.68 and Sell the Oct. 97.5 Call for $0.57 making your cost basis $93.11. With our stop on a close below $93.05 we are risking about $0.07 to make a maximum of $4.39. That's a risk reward of 62:1.
(I traded #2)
The risk reward is assuming we could close out the position on the penny. This of course is not entirely true because we do not know how far below the market can close. It give you an idea however of just how well this trade is setup. You can tailor your stops to your liking. For example from this level, my stop is on a close below $93.05 or a touch of $92.35. This is because I never risk more than 2% on a single trade. I traded play number 2 because it brought my cost basis closer to the EMA reducing risk, while limiting profit. To compensate I doubled the size of my MCD position so the profit would match that of Trade Play #1, with my total risk being less than 2% still, and appropriate stops in play as mentioned. $97.50 is the closest and more likely target, with $102.00 being the top and more extended part of the range. So by using the $97.50 calls and doubling my size, my chances are better yet that I will achieve the same profits as Trading Play #1, simply because it only requires MCD to head towards $97.50 and not $102.00.
Good luck, and may the markets be ever in your favor!

US Oil Short From Bullish Flag; High Risk:Reward RatioUSO has broken it's uptrend a few weeks back, and since has been heading violently lower with no signs of stopping, at least not yet. Not in my eyes. I had a plethora of converging indications, so I've marked them in the chart A - F, and then explained my trade setup. Good luck.
A) RSI has broken above the 35 level, but this is likely because it bounced a bit from being oversold. It remains below 50 which is a bearish indication and still has resistance at the 40 level.
B) The cream of the crop. B marks the head of a head and shoulders pattern in USO. You can see when the neckline was broken here, while simultaneously breaking a series of important EMAs, USO began it's slide. We would expect some sort of throw back to this neckline. This will be important in our trade setup later.
C) Here is our bearish flag and Andrew's Pitchfork. You can see the slight countertrend movement off the lower bollinger band, and what now looks to be a hanging man. This entire move up is hitting resistance in the pitch fork, as well as the flag formation, and has formed entirely on declining volume. That's not a positive sign for continued upward momentum.
D) PSZ (Prior Support Zone) from way back when. I'm expecting a move down into this zone where it will coincide with support at the lower BB or lower median pitchfork line. We may get a bounce down here, or more consolidation.
E) Volume Decline Throughout Bear Flag
F) Declining & Still Negative MACD
The one thing I didn't like here was the RSI, and that the weekly chart shows that we may need a throwback before extended downward momentum. This is where that neckline comes into play. We may very well see a throwback to the 66 area before we are awarded with any serious downside momentum. However the weekly RSI is also in a downtrend, reinforcing our bearish outlook. I'm short a directional diagonal on this play, to take advantage of Theta decay, and let oil slowly drift lower in my favor until we reach that prior support and I debate what the next play will be. More downside, or a retracement? Maybe a renewed uptrend? Who knows?

DIS relative strength during market correctionPrice of Disney's stocks holds nicely during this corrective phase showing relative strength. S&P was up 1% on Friday and gain 6 handles on premarket showing some follow through. This stock could be a good candidate when market buying will resume. Entry ans Stop on chart. It is difficul to say what could be potential target as stock hovering near historical highs, but minimum requirements are 1,5-2 more that risk (makes our target $91.60 - $92.00)

NZDJPY double bottomActually we see this nice simple structure and second time it spikes into previous structure support as you can see in the bigger picture. I am looking at lower timeframes to get an opportunity for a long trade with good risk-reward. The currency relation this week is 1.6 : 1 so that NZD can start to move up in thios area. Let's see :-) If it starts, take care of the potential reversal zones, the first one @ 86,15 around.

NTAP showing relative strength above important levelNetApp holds well above broken resistance level at $38. This is very important level as it is in play since March. We had some clues before break up as buyers managed to build series of higher lows with recent bottom at $36. Below this, idea will loose its luster.
As broad market entered into corrective phase, i like how this specifique stock showing us relative strength and wedging above important level. Sector of Data Storage devices also keeps its buying momentum ($WDC, $STX, $VMW).
Use your trade and risk management rules to keep odds on your side and control risk the same time. I am tier 1 here, add tier 2 if market will find its footing, add tier 3 on break og wedge. If it will go through $39, it will open doors to $41.

TDC found strong support and looks ready to goTeraData has been hot stock during 2010-2012, then it lost its luster after soften in margins. But in terms of net profit and total revenues it is showing us solid numbers.
Stock found strong support at $39-$40. Looks like funds accumulate this stock during last three quarters. Yesterday, it gave us Day #1 (broke of flag and trend line). If the next days it will hold 1/3-1/2 of its range and will go through pivot high $43.65 then it will open doors to upper resistance at $49. With stop below $41.70 (bottom of flag) and more strategical $40 makes this trade acceptable from R/R point of view.
Company will release its earnings on 7th of August before market opens.

FOE major supportFerro Corp is sitting on its major support showing us relative strength, while SPY broke down its intermidiate trend with big, ignited candle. I will be watching for stocks that show us resilience during this corrective phase, as we remain in macro trend. If indexes will find its footing, then we can see an upward move in this stock with resonable risk/reward and high probability of winning.
Trade management is the key. Tier 1 here, close to support. Add when market conditions will be favorable and stock will go through $12.80ish with potential to $13.90ish resistance, then we have $15.

ACN trend bounceAccenture looks ready to move higher, as it bounced off of trend line. Now, it is hovering around all key moving averages. Combine it withh strong market (yesterday it bounced again from active trend line) and that is how you get A+ trades. I am looking for potential move through $81 for additional gains. My mid-term target is $84.50. With stop below previous swing low at $79 - this trade looks attractive from Risk/Reward point of view.
Check my previous idea in this srock in the link below

NOW get long now, part 2This cloud-service company looks ready for another leg higher.
Stock came from $26.33 to $71.80 for one year. Then agressively sold off from high. Pretty deep pullback to $46 which we can measure with fib levels - 61,8% is support - the last chance for bulls to prove that it is not reversal.
I was bullish on it since Reversal on 15 of May (check my thoughts in the link below). Since then, it had nice move through resistance $55-$56 right to $64.61 from where it had 4 days of selloff. It found bottom and formed support on previous resistance around $55.00-$55.60 (previous resistance). I like the way how buyers regrouped and with yesterdays candle it broke up consolidation with bullish close near intraday high.
So, buyers should hold above $58 to keep active traders attention, then we can see some follow through to the top of this wedge. It has some room to $64 and with well-defined risk below $55.60, it makes this trade attractive from Risk/Reward point of view with high probability of winning, as this market stays bullish (active, intermidiate and macro trends are still intact).
We have earnings on July 30 after market close.

SCTY looks ready for move higherSolarCity poked its head off consolidation and looks ready to amke move higher. Overall, stock gained 400% since it became public.
This has largely been driven by its attractive business model, which has allowed it to grow its customer base at a feverish pace. Unlike other installers who require customers to make upfront cash payments, SolarCity foots all the installation costs upfront and then leases the solar system back to the home or business on whose roof it sits.
After it found top at $88, then it was sold off very hardly (lost almost half of its value) and found at $46 -$48. After it broke up descending chanel, it caught momentum buying. Controlled pullback and resuming of buying - that is what we have. Combine it with strong overall markets and that is how you get high probability tardes. Holding above $66.50 could keep its momentum intact for potential move to $74-$76 (previoous high and trend line). Manage this position according to your timeframe and risk management rules. For swing traders, if it will go below $62.50, then it makes this idea invalid. For more active traders, use short term moving averages to judge price action.

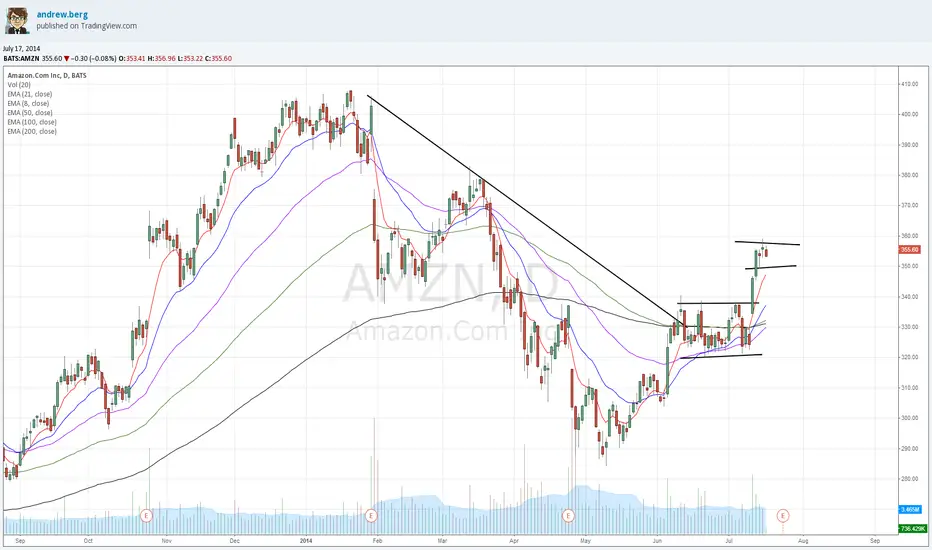
Amazon changing sentiment in front of earningsAmazon was in down trend most part of the time this year but caught some buying after it broke up from $320-$340 consolidation with strong two days continuation to $359.32. Now, it holds nicely near highs. Buyers probably should not gave back more than 1/4-1/3 of this recent move if they want to see quick continuation. I expect to see bull flag and continuation through recent highs some time soon. maybe earnings release on Thursday 24 after market close could be such type of catalyst.
USD/RUB A+ set-up when fundamentals and technicals join togetherthe U.S. and the European Union announced a fresh round of sanctions against Russia on Wednesday 16 of July following the annexation of Crimea back in March and ongoing tensions in the east of Ukraine. The U.S. package was the largest round of penalties so far, with Russia's oil producer Rosneft hit as well as other energy, financial and defense firms.
Technically USD/RUB came into play after new portion of sanctions were announced against Russia. In February 2014, currency pair broke up major resistance level at 33.50 and had nice follow through to 37.00. During this period of mark-up it was nicely controlled and followed by 8 and 21 EMAs. In April price entered into consolidation, after it dropped its 8 and 21 first time since break up. Break down of this range lead to move lower to 200 EMA. Bear chanel was created with series of lower highs and lower lows. But after price bounced off from support which acted like resistance earlier, then broke up this chanel, regained all key moving averages and had a nice 2nd day follow through. Lets see if it can build some construction above 34.43-34.59 support zone - break out point and moving averages. It will be healthy to see some digestion after six days move up in a row. And then it may continue higher. Next reasonable level of resistance is 35.35 - break down point of April's consolidation.

Yen Strength 7/16/14The Yen has been building in strength through the summer. Here price has entered in to a small range(within a larger downtrend), with price being rejected at the .618 fib retracement and the resistance line, which created a confluence of resistance. Recent candle wicks show rejection at the 101.800 level, so I suspect this retracement may becoming to an end.
entry point should be approx. 101.800 area with a stop set in the 102.000 area. This stop placement was chosen since it has been a place of support and resistance in the past, and congestion seems to form there. Take profit would be fluid, evaluate PA and ride the trend down. (monitor the news as BOJ is known to intervene as their currency strengthens)

COST break up of consolidationCostco caught up some buying momentum after it broke up its consolidation resistance at $116.60 and had 2 days of follow through. Price found top at $126 and was sold off to $110 which acts like major support for this stock.
It was out of play for couple of months but for now if it will hold above breakout point it will keep active traders attention.
Higher lows and higher highs tell us that buyers are in control. Next important resistance is at $120 which could be our target.

FTSE100 sitting on major resistance FTSE reached major level of resistance after Reversal Candle, then it regained moving averages and borke bear channel. That attracted many active buyers and we had nice follow through into major resistance 6875-94 that is in tact since May 2013. On Friday, it closed with doji, holding near top. At this point I think we need some kinf of rest or sideways action (upper-level base or flag) before it will break up to new highs. I am watching for tactical short and will use my 8/21 EMAs to measure strength of this recent move. The higher it will hold the higher is probability that it will continue going up.

CRM break up of consolidationThis cloud company was in descending channel in the first half of the year and erased most part of gains from 2013 but then regrouped and regained all key moving averages. With big, ignited, green candle it borke this short period of indecision and have built nice upper level base. Break above $58.63 could trigger an entry with stop below support of consolidation at $56.63. Target could be $63 where previous up trend was broken.
