USD/JPY is in a range currentlyDo not enter the market yet without a strong signal which indicates you can buy or sell.
USD/JPY is bearish.
And now it's not the time yet to enter the market.
Strong

Things are looking Bullish!There's an awful lot of hype surrounding the world of Crypto the past few days, where's it all heading?
We've had a few good trades recently - not excellent, but profit is profit! The markets are almost all at a critical point right now, just tickling a new range, a break upward into these areas we think would signify the start of the Bull run that we've all been anticipating!
Give it a day or two, there may a small decline of 3%-5% in these coming days (so the banks can remove some early long positions and take some profit themselves!), after that, we forecast an upward trend all the way to and through the forthcoming Bitcoin halving; taking the alt-coin market up with it.
We would not be surprised if BTCUSD was at $12,000 within a few weeks, seems like a lot of gains in not much time, would you be surprised?
Good Luck & Happy Trading
-theCrypster

MR may target weekly highsThere are two observations on the weekly chart of Montage Resources.
The first one is we have a bullish divergence on MACD and RSI. The second one is the noticeably increased volume that has established over a whole year.
On the daily chart, we see a breakout with a strong volume that stands out. Price may test previous highs at around $7.5 or so.
Stoploss can be placed below the previous pull back just below the Daily S/R

NYSE: CRM shows Daily Breakout backed by Weekly MomentumNYSE: CRM has broken out in Daily Time Frame backed by strong bullish Weekly momentum.
Entry can be at last daily close or a tick above.

XAUUSD strong Short?So, the price has broken several lines and is now moving down.
I expect her to decline well.
o far, the goal is the closest support line.

EURUSDUSD PAY ROLL is so good so i think in future dollars will be so strong
And Oil is weak ,,,, its help for that

ONT=BreakoutBINANCE:ONTETH is a Strong Buy!
Analysis Method: Wave Theory & Fibonacci
Wave Position: Micro-wave 3
Will update.

MCO-Crypto.com-Strong BuyBINANCE:MCOBNB
Analysis Method: Fibonacci & Wave Theory
Wave Count:
Target: .5
Will update.
-AB


Dash is about to enter the bula hoodThe charts are clear,
beras shall receive no quarter.
3x long, sell at 169 and reload at 132
This is not financial advice.

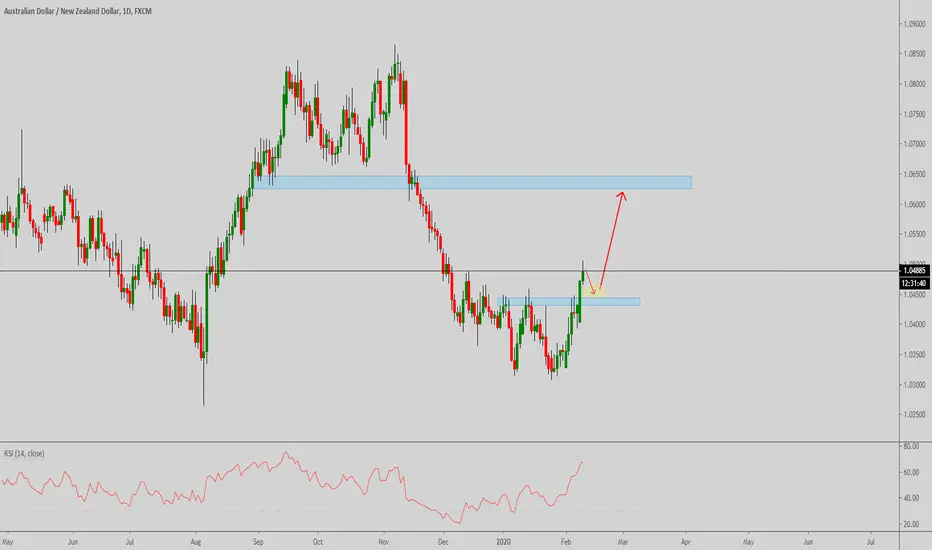
AUDNZD STRONG BUYDear traders,
I posted an idea of AUDNZD to go up. It went up a lot. Now it will go more up. But before going up, its gonna test the previous resistance turned support. Good luck!
__________________________________________________________________________________________________________________________________________________
Guys if you like my ideas, please drop a like and follow me if u like my trades. Post comments about your idea too. We can manage the trade together.
__________________________________________________________________________________________________________________________________________________
DISCLAIMER:
__________
This is just my personal opinion. Every trader is independent. Every trader has the freedom to place a trade in any direction.
Thank you for your support,
FX Specialist
Bitcoin rolling over! WHAT IS BITCOIN DOING???Hey there,
So it seems like Bitcoin doesn't quite know what it wants to do.
Retest swing high, break it, form rising wedges, break them to the upside, then downside...
Nonetheless we have a bearish engulfing candle on the daily chart which is signaling strong
bears for now.
I will look for further downside if bears remain strong shortterm and keep price consolidating
around the current lows. The trendline of this channel is one of my next targets with
a retest of resistance and following break of the channel line and most idealy
a retest of the 200D MA, what I have been preaching for the last weeks.
Keeping it simple and staying away from trading for now, until Bitcoin gives clearer
signals of what could lie ahead of us now.
Uploaded a video so definetly check me out on YouTube at:
Enlightened Trading
if you don't want to miss out on key information.
Also follow me on Instagram @enlightened_trading_
and Tradingview.
Leave a like and comment if you wish so!
Cheers,
Konrad

USDCAD STRONG SELL MAYBE A CRAZY DROP!!!Dear traders,
Double top formation with a crazy selling pressure. It will drop crazy!!!
__________________________________________________________________________________________________________________________________________________
Guys if you like my ideas, please drop a like and follow me if u like my trades. Post comments about your idea too. We can manage the trade together.
__________________________________________________________________________________________________________________________________________________
DISCLAIMER:
__________
This is just my personal opinion. Every trader is independent. Every trader has the freedom to place a trade in any direction.
Thank you for your support,
FX Specialist

Still going strong - Any last targets?Hey there,
basically anything you need to know on my outlook on bitcoin is displayed on this chart.
Our last targets are at 9800 (red box) and 10300 (last swing high).
Bitcoin keeps strong on all time frames, but is a bit overextended on the 4h chart.
Especially when looking at the Bitmex Funding Rate it kinda tells a different story and
displays that bulls are paying the shorts. Fortunately this is a contrarian indicator
and doesn`t always predict price drops/rises.
If you require further information, take a look at my recent posts on which
I explained in detail what I am looking at.
Also check out my YouTube channel: [ b]Enlightened Trading
for further information on my view of the current market.
So far so good. Targets where reached and held nicely.
Bitcoin really seems to change its market structure to bullish long term.
Cheers,
Konrad

Just look at this Crypto is back in 2020 I put my money where my mouth is don't forget there is a lot of potential bear signs to look out for !!!!!!


HOV Linear Regression AnalysisHOV has formed an Adam & Adam double top with a strong downward regression trend (0.81). Downsides probable.

PYPL Linear RegressionPYPL has recently had a nice dip, with the formation of this bowl, upsides are to come as per the regression trend. 0.86 strong regression uptrend. Great long entry. If you aren’t a fan of cryptocurrency ;) Rising wedge also present early.

PNC Linear Regression0.94 Pearsons R value, Linear regression strong uptrend. Various chart patterns identified including, two bump and run tops, a double top, and currently forming an ascending triangle with a possible bullish breakout as a result. PNC is currently trading within a strong upward channel.

SHORT ETHEtherium strong resistance to upward mouvement at 133.80
it will probalbly go down 20 percent.

INFY Parabolic trendINFY has formed a parabolic upward trend with multiple bottom points, including a diamond bottom. Uptrend can be seen to be a strong trend with a regression analysis of .84. Looks overwhelmingly bullish.

EURUSD Possible W Patter Forming ContinueH guys.
Wait for strong push up to confirm long.
Dont forget to give me a like and a comment , Let me know what you think
Good luck!

AUDCAD VERY STRONG LONG/BUY SIGNALIt has broken a very strong down trendline on daily timeframe......Its a beginning of new uptrend.......
