NzdUsdNzdUsd at a decent level of resistance on the 60 minute can give us some relief, RSI massively overbought so I would be cautious with overly aggressive targets.
Structure-trade

EUR/USDFriday we left of with the rejection of our retest of resistance of 1.10250 im expecting to drop back down setting up 1.10182, 1.10023, and 1.09903 as short targets.

Another Short!! (ofcourse)Looks like I am very bearish on every stock!! anyways
Going with the trend on this trade which is down! it is a straightforward setup, no complex pattern or anything.
Price action hit the previous structure + Fib 38.2% zone with confirmation
I did not see this trade early enough i am a day late on this trade but the green candle yesterday is showing me, market is giving me another opportunity to get in.
Trading Plan
1. Trade at open
2. Stop loss outside of the zone as well the 50% fib level.
3. target to be at previous structure low.
Good luck!

UsdJpyUsdJpy can see some relief at this level of support, be wary of the structures looking left just under but if you get a nice conservative entry on lower timeframes it might be worth a pop.

NzdJpyFollowing a decent impulse to the upside on the 60 and not a conflicting bias on from the daily as that is consolidating, I believe price can go higher if not to a retest of the highs too. Came into a minor level of support with fairly safe stop placement. A quick potential day trade which I am involved in.

short Trend trade on lower time frameHigher time frame 60 min shows a strong lower trend by making lower lows. Price has retraced back close to previous highs, which makes a great risk/reward trade, and RSI on the higher time frame shows overbought conditions. I am short taking profits at previous structure lows

AudUsdAudUsd is at a decent level of support and we can see some relief coming in on this pari following a strong bearish move. I would be conservative with targets due to it being a counter trend setup and a strong move.

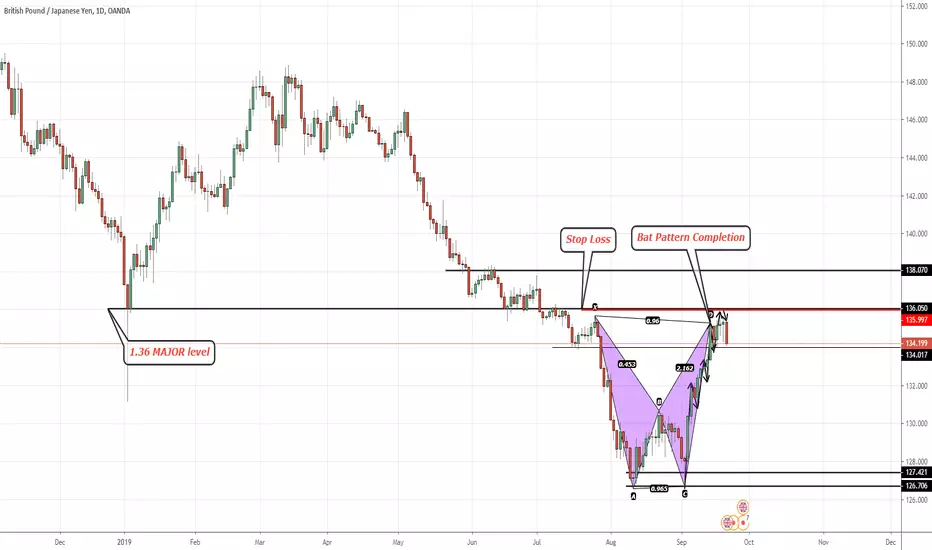
GBPJPY - #Forex #ForexTrader #ForexTrading #ForexChartBat pattern completion
At major resistance @1.36
if you didn't take the bat pattern then look for an entry on the lower TF's
Any questions? happy to help
#PipGainFX
Potential Bearish GartleyHey Traders,
If you analyze this pair on the hourly you would notice that we have recently had a violation of structure, with that said we are unable to confirm a bearish bias till we get that 123 move. However, if price action rallies than there is a trading opportunity to short this market at 0.68367 using an advanced pattern strategy called the Gartley. For traders that are aware of this strategy will know that we enter multiple positions, one target taken off at 38.2 retracement and other at the 61.8. I cannot advise where your stops should go that is down to individuals risk management but all I can say it requires to be above the X leg.
Have prosperous week traders, keep tuned for more trading opportunities.

CADJPY - Short #Forex #ForexTrader #ForexTrading #ForexChartLovely shorting opportunity on the 4 hour.
Previous daily structure for possible reversal
Can trade off of the break out candle - or wait for a pull back to the consolidation zone then enter short
I'm more aggressive so i will be taking the trade depending on how markets open
check on Daily TF you may see if clearer what i am seeing

AUDCAD SHORT.Price bounced around weekly support (0.89500), retracing back to 0.90800 which is our Daily reistance, hope for more bearish to coming and push the price to 0.8700 as our ideal target. which is our monthly support.

AUDCAD #Forex #ForexTrader #ForexTrading #ForexChartPossible shorting opportunity arising on the AUD CAD

EURAUD #Forex #ForexTrader #ForexTrading #ForexChartEURAUD -Long position ready to be taken pull back to structure.

S&P500 pulled back to structure S&P500 pulled back to structure
good to long now
SL : 2900
TP : Follow arrow

AUDUSD structure broken AUDUSD structure broken
wait for pull back to enter
around 0.6830 will be a good area to short
SL : 0.6873
TP : Follow arrow

AudJpy Relief and RetestAudJpy has put in a strong move to the downside and currently at support so we can see some relief but also a retest of the lows due to the strength of the move to the downside.

NzdUsd LongFalling channel at support on the 60 can see some relief to the upside. Daily bias is bullish aswell so confirms nicely. few rejection wicks past the support level too.

Why I'm going SHORT on #GBPJPYOn the technical's this looks like a perfect setup for me. However Bearish JPY in the past hour or so means we could get stopped out rather quickly. So on to my setup!
Reason:
We have Bearish three point moves on the 1D, 4H and 1H.
Price has recently pulled in to my last chance entry zone on the 4H and provided us with a lovely Double Top entry to get short.
Targeting the previous lows (135.553)
As always good luck in the markets,
TradeEasy.

EurChf ReliefSmall potential relief on EurChf coming off resistance with RSI being Overbough and a head and shoulders complete on the 5 minute looking to carry down to at least the green line if not lower

USDCHF pulled back to structure USDCHF pulled back to structure
around 1.01890 will be a good area to short
SL : 1.02190
TP : Follow arrow

Bitcoin Short Term Selling Oppertunity - 4HOUR (240)Classic Gartley 222 pattern is about to complete.
Market is at a well respected level of structure in the past.
Short SELL Opportunity at pattern completion.
Reward/Risk = 2.45


Correlated to ETH -> Long on Demand & StructureVery similar pullback on BTC. Long call with red zone entry level (If you want to time it) or the start of it.
The top of the green zone is where I am to take profit.
