Structure-trade
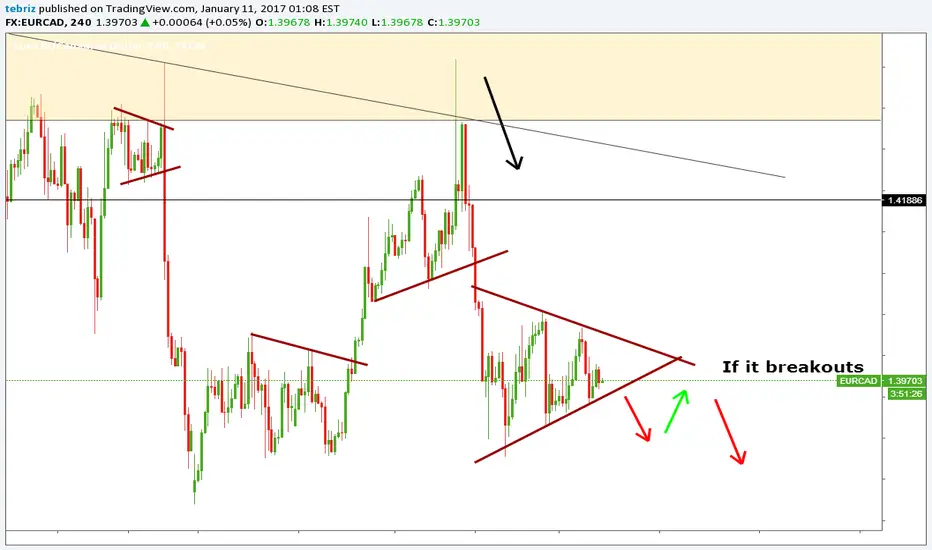
EURCAD LONG Opportunity ?It seems we have an opportunity to LONG this pair, based on Elliott wave count on a wave 3 minuette time period and breakout of structure including use of 0.50 ~ 0.618 fibonacci, which both line up. Stochastic indicates a small move down before moving upwards and MACD 4C indicates the finalising of wave 2 minuette in preparation for a wave 3 minuette.
----------------------------------------------------------------------------------------------------------------------------------------------------------
DISCLAIMER: This chart is for sharing and educational purposes only and is not intended to be a signal service or similar.
Please do not trade this chart if you do not have your own strategy. Trade only with your own strategy.
Some very wise words: Plan your trade and trade your plan... and IF in doubt, stay out.
.....::::: If you like this chart, please click on the THUMBS UP ! :::::.....
----------------------------------------------------------------------------------------------------------------------------------------------------------

Going Bearish on USDJPYNow last week I went short on this pair and banked a couple hundred pips. I just put out a video on how I will be looking to do the same thing this week. youtu.be
I do believe that its not out of the realm of possibility to see this pair retrace down to 111.000. Which as you can see is only a 38.2 Fibonacci retracement of the entire leg up.
Here on the chart we have a potential 2618 setup that can be used to enter on the short side.
I myself will be looking to take off the first half of my position around 115.26. That way I can lock in some profits and then look for some extended targets around 111.05.
Now I know that the popular opinion out there is "Dollar Strength" but I think we might start seeing some relief in the dollar, and I believe that this potential setup my provide a great opportunity.
As always, follow your rules and trade your plan.
Good Luck and Good Trading

USDCAD: APutting In A Potential Right ShoulderDollar weakness in the markets have driven us down over 300 pips before finally looking as if we may see some relief. If you "look left" on this chart you'll see that current price action has made it's way down to an inside level of potential structure support which may also end up being the right shoulder in a potential head & shoulders pattern.
I

AUDJPY Counter trend tradeHey guys,
second analysis today, here on audjpy we can see we are testing a former resistance level. At this point price gave us a long wick to the top candle (selling pressure) followed by an engulfing candle. All seasoned with RSI Divergence.
That's enough for me to trade.
Currently i'm waiting for a pullback in order to enter short.
First target at roughly 1:1 RR, second along with structure.
Stops above the wick.
If you want to share your viewpoint, please do it beneath.
Otherwise, see you in the next chart!

EURUSD Trend Continuation tradeHey guys,
here on EURUSD we have a nice trading setup, since we broke below the most recent low and now we are pulling back to the resistance zone. I've outlined a box (between ex support and actual resistance) and in there i'm looking for a candlestick formation, considering we've already entered an OVERBOUGHT condition.
Trade simple.
If you have any question or remark, please fill the comment section below.
Otherwise, see you in the next chart!


Day 1 Pro Trader WorkshopJust had day 1 of the pro trader workshop. It was a great morning, and we covered a ton of stuff. We will be having day 2 tomorrow morning starting at 8am est and if you missed this mornings stream and you want to watch it, here is the link. youtu.be
One of the things that we will be covering tomorrow morning will be the Technical Scoring System. This is a great example of a TS2 trade.
We have structure, we are going with the overall trend of the higher time frame (daily TF), we have a potential AB=CD pattern with Fibonacci retracement, extension and inversion confluence. Definitely a good setup, if we can get a valid entry signal, if and when we make it up to the kill zone.
Good luck and good trading.
GOLD: The Next Pullback Into A Potential ShortLooking for a simple trend continuation trade here on gold as the market consolidates in it's latest pullback. The "Initial Killzone" that i drew out is a combination of the two bigger killzones that I've identified combined with levels of Fibonacci ratio confluence.
If you were to zoom out to the daily chart you'll also notice a previous level of structure support that may now act as potential resistance rest there as well.
Speaking of the daily, i'm getting somewhat of a mixed signal from the chart. An initial looks shows clear sailing down to 1100-1050's level, however I would suspect that the previous level of inside consolidation won;t make that ride so easy.
Not to mention the unexpectancy that comes with this being a non farms week.

AUDUSD back to test broken support. Could become resistance?Hi traders,
this is my analysis on AUDUSD. Price is coming back to retest a previous broken support. In case like this a broken support could turn into a resistance and provide a good point for reversals. We've identified two levels but i think the first is more important cause, look left, it has proved to be strong two times in the most recent time.
So as usual after we find a good point for reversals we go down to lower timeframes and look for shorting opportunities in form of candlesticks, advanced or simple patterns.
Let's see! If you want to share your standpoint, please comment.
Otherwise, see you in the next chart!

GBPJPY: Some Longer Term Analysis (Long & Short)I apologize for the sloppy chart but this was the trade that I recently discussed in my Forex market Preview video & didn't want to erase anything just yet. (Link to my youtube page is in the "signature" box below)
But essentially there are two potential trading opportunities that I have my eyes on for this pair. A potential counter trend trade (SHORT) if the market were to make it's way up to previous structure resistance.
And a trend continuation trade (LONG) if we were to see some relief, in anticipation of a continued move up towards previous structure resistance.
Either way i'm predicting that the market has room for more bullish movement, the question is "How Will It Get There?" and How/IF I will be able to get involved. We shall see!

EURUSD: Retest of Structure & Retest of Double TopEURUSD is setting up almost identically to the Gold and Silver trading opportunities that we discussed in Tuesday's Syndicate video. Looking at a retest of a previous structure shelf that once was support and now is anticipated to show some resistance.
We've already double topped during the London session, which means that using the 2618 would be the perfect technique for those looking to get involved.
We have another jammed packed day of economic news events being released today especially from the GBP starting at 8am (New York). Thus far this week I've been on the wrong side of most moves but as we demonstrate time in and time out, the only way to get through a drawdown is to trade through it.
Easier said than done this week as I'll probably be shutting down shop soon, but I did get filled the Kiwi position so if I could get a positive win on that, it would be a great start to the drawdown healing process.
Lastly I'll probably be live on Youtube tomorrow during or right after the Non Farm Payroll release.

DXY (4H): Price now at channel top and 127.2% extensionDXY (4H): Price now at the upper trend line of the bull channel as well as at the 127.2% extension and previous resistance.

USDJPY (4H right shoulder of head and shoulder pattern completedUSDJPY (4H): After double bottoming (on Sept 27) at the 100.00 support zone, price moved sharply higher and is now back at previous resistance. Price has broken the rising wedge and has retested the bottom of the wedge as well as the 50 SMA. This is also the right shoulder of the head and shoulder pattern. My downside targets would be the 103.25 (Previous weekly open/swing low) then 102.8x (38.2% retrace/ 127.2 ext/ swing low). I would not buy at this level. I would wait until price break (above 104.64) through and retest the overhead resistance. Or look for buying opportunities if price reaches the previous weekly low at 102.8x.


USOIL (4H) trading at the top of a bull channelUSOIL (4H): After spiking higher oil is trading in a bull channel. It is currently approaching the highs of this bull channel. It has broken the high at $51.57. Will it hold above or will price rotate to the lows of the channel. Note that price is also at the 127.2% extension of a previous swing high. The trend is clearly bullish and I would only be looking for buying opportunities at the low of the channel or on a strong break and pullback of the $51.7x resistance zone. My upside targets are $52.4x (measured move) then $54.00 (127.2% extension). I would only consider selling if price breaks the bull channel as well as trade below $50. I would be looking for a retest of the SMAs. My downside targets are 48.0x (SR zone and 38.2% retrace) then $46.0x (SR zone and 61.8% retracement)

USOIL (Daily) failed at $51.70, trying againUSOIL (Daily): For more than a week oil has broken and held above $50. The next target is resistance at $51.70. It tried to break this level on Oct 11 but failed to do so. Here we are again. The trend is clearly bullish but be careful of buying into resistance.

SPX500 (4H) trying to break resistance at 214xSPX500 (4H): Price bounced off support near 2100 and is currently trying to break through the resistance zone at 214x. This resistance is defined by previous support now resistance as well as the 50 SMA. Buyers who entered in the 212x zone could consider taking partial profits. Those looking to buy should wait for a strong break and retest of this resistance zone. This break should bring prices above the 50 SMA. Sellers should wait for bearish price action and note that there is resistance at 2100 zone. My upside targets are 216x (previous highs) then 218x (previous highs). My downside targets are 212x (previous lows) then 2110 (previous low) then 2100 (round number and 127.2% extension)

SPX500 (Daily) price bounced of support near 2100SPX500 (Daily): Bounced off support in the 2100 zone. This area has acted as resistance for several months before the bulls achieve a clean break. Price has retested this area with the bulls showing their presence. Although the trend is up it should be noted that for the past three months the market has simply chopped sideways. In this situation I would stick to trading from the edges of this consolidation zone. Price is currently trading below the 20 and 50 SMA but until there is a clan break of 2100 I would patiently wait for buying opportunities. Price is also testing the upward trend line.

DXY (4H) trading at lows of spike and channelDXY (4H): Price is trading in a up channel after a sharp upward move. We are currently at the lower trend line of this bull channel. Price is clearly in a up trend. My upside targets are 98.1x (previous high) then 98.5x (upper measure move/previous high). I would not consider shorting until there is a strong breakdown of the up channel that brings price below the 50 SMA. My downside targets are 97.2x (resistance now support) then 96.3x (61.8% retracement, previous SR zone)

DXY (Daily) price approaching bull channel highDXY (Daily): Since breaking higher on Oct 4 the dollar has been particularly strong. It is trading in a bull channel and approaching the top of that channel. Price has recently broke resistance at 97.57 and is currently using this resistance as support. The next resistance zone is at 98.5x (previous high, 127.2% ext and measured move). Due to the strong up move there is significant separation between current price and the 20/50 SMA.

USDCAD (Daily) testing 50 SMA, more support at 1.30000USDCAD (Daily): The USDCAD is in a slight uptrend where it is slowly grinding higher. It has tested the 50 SMA leaving a long lower wick. In this type of price action the up moves are not sustained with deep retracements. Major support is at 1.30000. My upside targets are at 1.327x (previous high) and 1.337x (127.2% ext as well as measured move). My initial downside target would be at 1.30000 (round number) and then 1.284x (previous low). Note: BOC overnight rate remains at 0.50% and Crude oil inventories will be out shortly these could affect volatility.
