Structure based short on GBPJPYA nice level we have been eyeballing in the live room for a short.
Previous structure resistance being tested showing bearish rejection. 2 x 3 Bar Reversals.
Targets at structure
Structure-trade

AUDNZD Long Term Trade on the H1 for a Breakout to the BuyOnce the trade Activates and Hits TP1 - Plz Trail the Trade with a 20 Pip Stop Loss.
**Pending Order**
AUDNZD Buy Stop
Entry - 1.07300
SL - 1.07000
TP1 - 1.07500
TP2 - 1.07675
TP3 - 1.07825
TP4 - 1.08250

DAX 14775.52 + 1.23% SHORT IDEA * PRICE ACTION & STRUCTURE BASEDHELLO EVERYONE
HOPE EVERYONE IS DOING GOOD HAVING A GOOD ONE IN THE MARKET THIS WEEK, HERE'S A LOOK AT THE DAX INDEX.
* follow your entry rules on entries
* significant moves with the bears change the plan.
lets see how it goes.
many stars must align with the plan before executing the trade, kindly follow your rules.
HAPPY TRADING EVERYONE & LET YOUR WINS RUN...
_________________________________________________________________________________________________________________________
ENTRY & SL - FOLLOW YOUR RULES
some rules on exits & entries hope they help.
1. look at structure be it descending channels, pennants and so forth basically price action whats price doing.
2. If you use indicator determine does it align with your play e.g is it overbought/oversold where there market is it in a pull back to structure or continuing does price alighn with your indicator.
3. entries from 30M , 1H, 2H & 4H time-frames the higher the time-frame the more likely it will end up swing or long term.
4. aggressive trades can be executed on the pull back / or at ranges of structure that's when you are a scalper or your trade are Intra - day based
5. price action must definitely align with the plan.'
6. structure definitely
7. FIBONACCI EXTENSIONS AS GUIDELINES FOR SL & TP'S .
9. CANDLE STICK PATTERNS.
That's basically entry & exits plan basic guide lines
RISK-MANAGEMENT
PERIOD - SWING TRADE
__________________________________________________________________________________________________________________________
If this idea helps with your trading plan kindly leave a like definitely appreciate it.

Long opportunities NZDUSD As we see the daily Tf, price was ranging (Forming HL and LH), But recently the structure broken to the upside, while sellers tried to close the price below the 0.72000 psychological level and break the blow, but there wasn't enough sellers to do that,
Expecting a bull move this week for kiwi,

NZDCAD possible short- NZDCAD is currently on a monthly supply
- Pair is retesting structure resistance
- ( Candlestick ) Bearish Signal
- Plan is to short NZDCAD
- Target is plotted dot horizontal lines
- Take the take when your rules are fulfilled
A BEARISH MOVE is probable in this market.

Waiting Gold to retest zones around 1770 for bullish setupBasically, my trading idea is based on weekly chart which you can see clearly the long setup at the bottom is a not bad one.
For the daily chart, it formed a inside bar pattern(so hard to find a good entry) until 20 minutes ago that the structure got violated. Very often, we should wait for opportunities, instead of chasing them.
Until price forms a clearer and high probability pattern to join in. Now, chart is sort of choppy for me at least on the daily and hourly chart.

DAX 14092.7 - 0.11 % * STRUCTURAL IDEA * PRICE ACTIONHEY EVERYONE
Here's a look at the DOLLAR INDEX FOR DIRECTION AND OVERVIEW IDEA ON WHAT PRICE IS DOING hope everyone is having a good day now we taking DAX from the monthly streets which has more or less held an ascending channel currently trading at the roof of this structure and will be looking at price to see if this structure breaks or holds before embarking on trades on the index lets see how it goes.
AS ALWAYS PROPER RISK MANAGEMENT AND A LOT OF PATIENCE & AGAIN many stars must align with the plan before executing the trade, kindly follow your rules.
LET'S SEE HOW IT GOES..
HAPPY TRADING EVERYONE & LET YOUR WINS RUN...
_________________________________________________________________________________________________________________________
ENTRY & SL - FOLLOW YOUR RULES
RISK-MANAGEMENT
PERIOD - SWING TRADE
__________________________________________________________________________________________________________________________
If this idea helps with your trading plan kindly leave a like definitely appreciate it.


Gold SellBased on structure I am looking to sell Gold with a 1:4 ratio. I wont sell at the key level but I am looking to sell in that area.

GBPJPY 138.94 -0.16 % LONG IDEA * STRUCTURE & PRICEHey everyone
Hope you're having a good one here's a look at the POUND YEN looking for structure to hold on this pair from the daily chart as on higher time-frames the pair is net long just broke out of a descending channel looking for momentum to rise with the bulls. On the daily looking for longs on the pair
many stars must align with the plan before executing the trade, kindly follow your rules.
LET'S SEE HOW IT GOES..
HAPPY TRADING EVERYONE & LET YOUR WINS RUN...
_________________________________________________________________________________________________________________________
ENTRY & SL - FOLLOW YOUR RULES
here's some of my rules if they help.
1. look at structure be it descending channels, pennants and so forth.
2. RSI is overbought/oversold so will be looking for a pull back to structure before continuation.
3. will be looking for entries from 30M , 1H, 2H & 4H time-frames if taking the trade long term.
4. aggressive trades can be executed on the pull back
5. price action must definitely align with the plan.'
6. structure definitely
7. the 20 EMA must be respected as support / see a bounce at this structure
8. FIBONACCI EXTENSIONS AS GUIDELINES FOR SL & TP'S .
9. CANDLE STICK PATTERNS.
so i will most like's enter this one in a bit but i hope this idea assists in any way on your trading plan.
RISK-MANAGEMENT
PERIOD - SWING TRADE
__________________________________________________________________________________________________________________________
If this idea helps with your trading plan kindly leave a like definitely appreciate it.


Shorting USD/CAD Shorting Usd/Cad 4H/1H, As overall market is in a bearish run, Found an short setup at level at 1.31187.
1:Overall bearish move market making LL & L.H.
2:Market retesting the previous broken L.L.
3:200 Ema down.
4:Fibs level 61%.
5:1H TF also retesting it's bearish structure.
6:Candles showing strong rejection.

BTCUSD: A Potential FadeReasons to consider getting out of short risk exposure if the highlighted area fails:
Bearish Divergence
Break of Structural Gap
Overextended state
These reasons might trigger some traders to short or sell this pair; however, in terms of probability, the market still favours bullish bias, evidenced by the context to the left.
The break of the highlighted bullish structural gap area can serve as a warning for short risk exposure. If that happens and higher timeframes close below that area, that can be considered as a decent indication towards further downside for short risk exposure.
Constructive discussions are always welcome, just drop a line in the comments section.

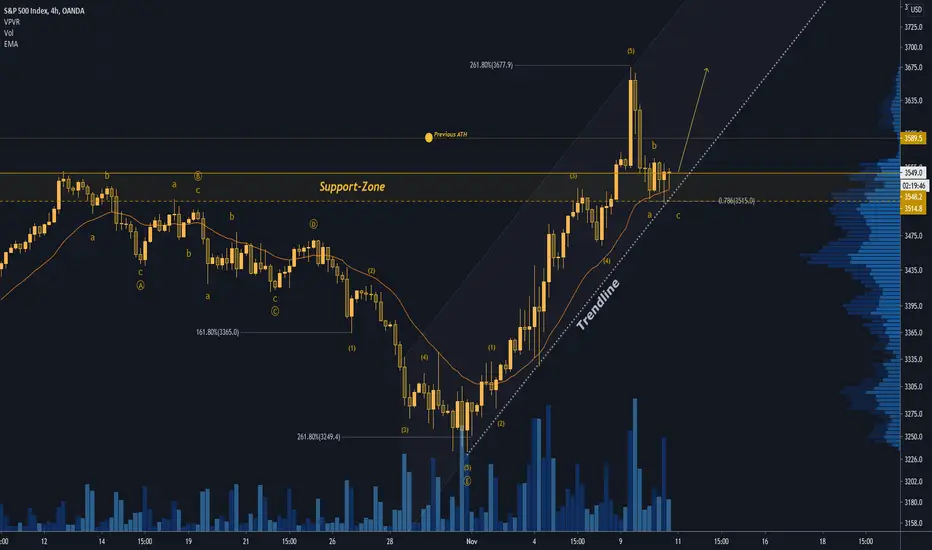
SPX500 should go UP SOONVaccine-Outlook and stimulus.. GRIDLOCK (Tax-Increase will be hard).
All good points for a long. :-)
ETHUSDT is testing weekly support 🦐ETHUSDT is testing weekly support as support.
We need to see another daily close above this structure and According to Plancton's strategy, we can set a nice order
Weekly
–––––
Follow the Shrimp 🦐
Keep in mind.
🟣 Purple structure -> Monthly structure.
🔴 Red structure -> Weekly structure.
🔵 Blue structure -> Daily structure.
🟡 Yellow structure -> 4h structure.
⚫️ Black structure -> <4h structure.
Here is the Plancton0618 technical analysis, please comment below if you have any question.
The ENTRY in the market will be taken only if the condition of the Plancton0618 strategy will trigger.

NASDAQ- LONG - Follow up on previous & plan for todayYesterday's analysis was very successful, I have a follow up on that and I have shared what I am looking at today. REMEMBER, you follow my advise at your own risk.


USOIL 39.86 + 0.21% FUNDAMENTAL AND STRUCTURE IDEA HEY EVERYONE
HOPE THIS IDEA WILL ASSIST IN ANYWAY ON YOUR TRADING OF THE CRUDE OR BRENT OIL.
The writings are on the wall as they say on this one.
LET'S SEE HOW IT GOES..
HAPPY TRADING EVERYONE
_________________________________________________________________________________________________________________________
ENTRY & SL - FOLLOW YOUR RULES
RISK-MANAGEMENT
PERIOD - SWING TRADE
__________________________________________________________________________________________________________________________
If this idea helps with your trading plan kindly leave a like definitely appreciate it.

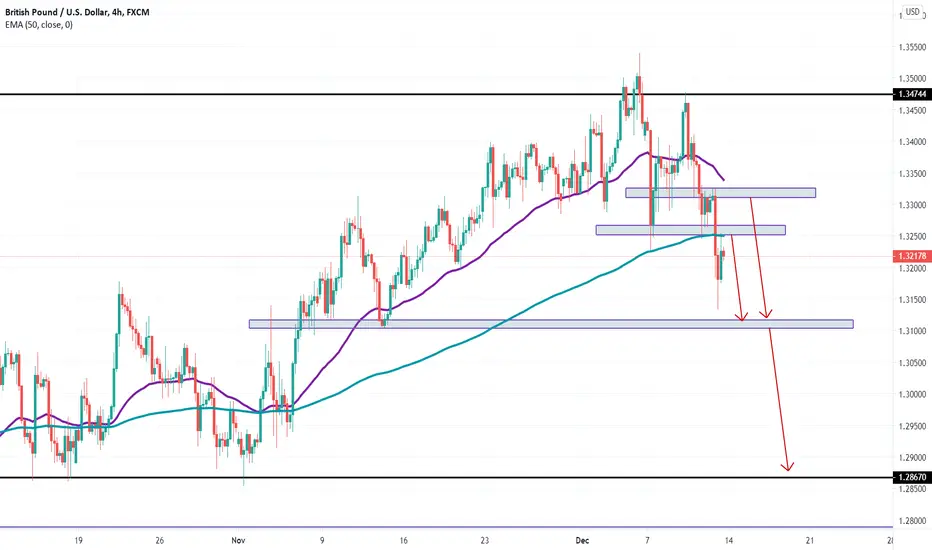
GBPUSD 1.29188 + 0.39 STRUCTURE & PRICE ACTION IDEAHELLO EVERYONE
Here's an idea on the DOLLAR/POUND that broke out of the descending channel structure pushed up with the bulls then came down to retest structure and is currently trading in a nice recovery candle with the bull. looking at what price will do or rather will it break previous previous swing high and push up has will be watching price in my trigger area and a break above the 50 M.A would be one of those nice confirmations that trend momentum is shifting with the bulls. hope this idea assists in a way with your trading of the DOLLAR / POUND.
LET'S SEE HOW IT GOES..
HAPPY TRADING EVERYONE
_________________________________________________________________________________________________________________________
ENTRY & SL - FOLLOW YOUR RULES
RISK-MANAGEMENT
PERIOD - SWING TRADE
__________________________________________________________________________________________________________________________
If this idea helps with your trading plan kindly leave a like definitely appreciate it.

AUDJPY, Potential SellPrice is currently in the making of a triple top as it rejects the Key S/R level unable to break it for the third time it reaches that level, it also is at the trendline level to add to the confluence. Currently on the 1HR looking for price to break it's support level, retests, rejects the level and head to the down side to the neckline. Taking action if price decides to break the support level then retests. In that process it should also break the 50 EMA to add to the confluence.
#newbietrader
Feedback is helpful

EURUSD 1.17845 + 0.6 % SHORT IDEA ^ PRICE ACTION AND STRUCTURAL HELLO EVERONE
Here's an idea on the EURO/ DOLLAR the writings are on the wall kindly check it out.
should structure not hold and we experience momentum with the bulls the whole trading plan changes.
hope this idea assists in any way.
LET'S SEE HOW IT GOES..
HAPPY TRADING EVERYONE
_________________________________________________________________________________________________________________________
ENTRY & SL - FOLLOW YOUR RULES
RISK-MANAGEMENT
PERIOD - SWING TRADE
__________________________________________________________________________________________________________________________
If this idea helps with your trading plan kindly leave a like definitely appreciate it.

USOIL 37.01 - 4.02% * SHORT IDEA CONTINUATION PTTNS & STRUCTR GOOD DAY EVERYONE
Here's an idea on the USOIL which closed at 37.01 looking at the monthly chart the oil just broke the 61.8 % fib testing resistance level 43. 27 where it was rejected and pushed down with the bears by almost 5% , currently trading at a significant level waiting to see a break of this level to see continuation with the bears targeting support level 35.24. fundamentally this move is highly possible and from higher time-frames the sentiment is fairly bearish so waiting for price to indicate and will be looking for entries on lower time-frames. hope this idea assists in any way on your trades on oil.
LET'S SEE HOW IT GOES..
HAPPY TRADING EVERYONE
_________________________________________________________________________________________________________________________
ENTRY & SL - FOLLOW YOUR RULES
RISK-MANAGEMENT
PERIOD - SWING TRADE
__________________________________________________________________________________________________________________________
If this idea helps with your trading plan kindly leave a like definitely appreciate it.
