Institutional Demand: EUR/AUD LongHi trader!
Lovely momentum on CPI today, with price-action starting to chop a bit, but ending up with clean moves! Of course, I try to share as much charts as possible, but that's not really doable here on TradingView...
However, I found the time to share a few this week, and now EUR/AUD is added to that list!
I really like how price is shaping up within our beautiful demand area, I'll be waiting for the 4hour time-frame to close nicely, and take this hybrid trade when it met all my criteria!
Kind regards,
Max Nieveld
Structure

Institutional Supply: AUD/JPY ShortHappy monday!
Just finished my weekly live webinar and now it's time to share some of the charts with you here! One of them is AUD/JPY, very similar to the previous ideas I've shared last week on TradingView.
AUD/JPY is getting a bit over-extended, but more importantly AUD/JPY is moving to a very nice supply zone for me! When price reaches this area, we'll be patiently waiting for clear 4hour confirmation to take this one lower with our fixed 1:3 risk to reward strategy.
Kind regards,
Max Nieveld

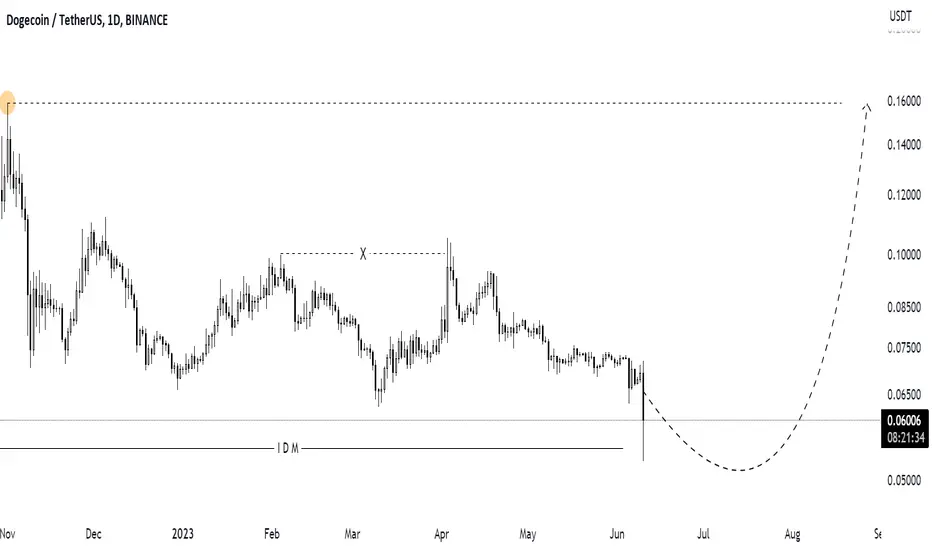
Buy opportunity on DOGEUSDTas you can see Doge grabed IDM liquidity and if this candle closes above the IDM , then we can buy until 0.157 on structure high.
This is not a financial advice and its just my analysis based TrueSMC
Institutional Supply: AUD/USD ShortHappy Friday,
Look - the next pair on my watch list is definitely AUD/USD, now that the DXY is showing some weakness, this one is flying towards our key area of supply. A beautiful area to look at for a nice push lower for the AUD pairs.
I'll be waiting until the zone is hit, and my alerts trigger. From that point, it is just watching the 4hour chart for me to confirm my higher time-frame bias and look for a nice 1:3 play lower. If it starts falling, of course scale-in opportunities are next for those that understand my type of trading.
Kind regards,
Max Nieveld

USDJPY ceases to create lower lowsAfter an indecision pullback to retest a 4H bullish engulfing, I took a long position based on the higher high and retest of the 30MIN. I'm taking long positions based on the 23.6 retracement of the daily chart. I expect for price to continue to make higher highs as I believe this uptrend is still strong.

DOTUSDTDOTUSDT was trading in range from sometime , and recently broke through the range and now testing the broken level. It also facing the pressure from declining trendline.
Will it head even lower ?

AUDUSD pivots suggest a short scalp`I believe that price is retracing bearish for its 4H higher low, in the meantime, intraday swings on a lower timeframe must correlate with becoming bearish. The 1H has already began creating lower lows and a lower high. I will monitor to see if price creates a higher high of gets rejected at a key neckline, resistance, trendline, and reversal area. There's a lot confluence in this area.
Currently price is relatively close to breaching the bearish correction, indecision is needed, along with volatility and indecision or a reversal at a key area.

Buying Ethereum once moreEthereum is on its journey of creating many higher highs along with bullish reversal candlesticks to initiate the move. The Daily has retraced to a key level on the daily chart. This is our first signal to go long. A morning star on top of structure and support. The 4H chart will inform us on whether price is still retracing bearish or if its time to get in long NOW.

EURAUD I Approaching daily structure and strong demandWelcome back! Let me know your thoughts in the comments!
** GBPUSD Analysis - Listen to video!
We recommend that you keep this pair on your watchlist and enter when the entry criteria of your strategy is met.
Please support this idea with a LIKE and COMMENT if you find it useful and Click "Follow" on our profile if you'd like these trade ideas delivered straight to your email in the future.
Thanks for your continued support!

Going short on us30 the whole weekEntry at a 4H candle break of high/low depending on the trend on the trendline stoploss as a whole 4H candle, risking 1:1/ 1:1.5 and also i am following the trend you can see that in my previous post so i did a little tweak here and there
As i hate taking forever to pass a challenge

CHFJPY I It will rise from supportWelcome back! Let me know your thoughts in the comments!
** CHFJPY Analysis - Listen to video!
We recommend that you keep this pair on your watchlist and enter when the entry criteria of your strategy is met.
Please support this idea with a LIKE and COMMENT if you find it useful and Click "Follow" on our profile if you'd like these trade ideas delivered straight to your email in the future.
Thanks for your continued support!

GBPAUD ShortUsually I like to go long but this short was calling my name, lots of downside targets that need to be hit, and since momentum has brought the price up I'm looking for a retracement point to. The golden pocket lines up with confluence W/ an imbalance and market structure and manipulation area. Very confident in this one

GBPCADGBPCAD recently form bearish flag pattern. And then break through flag , now retesting the broken flag. Will it continue its trajectory to downside?

Part 1 of catching a reversal is to trust structureI noticed that Ethereum was re-testing the neckline of an inverted head and shoulders pattern while at the bottom of a range and on top of support. Price provided an indecision candle on top of support as well as 61.8 fib. I anticipate that price will push back higher to retest a prz level. we have to get there first. It could begin with this purchase at a higher low.

I'm correcting errors mid-weekI decided to publish a video about the recent trades taken and the aftermath. I believe that I see structure clearly, however my bias changes depending on the timeframe. I'll be ultimately bearish on Sunday and Monday, then decide I want to be bullish Monday night to trade up to the sell. I understand that counter trend trading is dangerous to the risk: reward portfolio. This video will be watched back 2-3 times by myself as I learn more about the market from "teaching" it. I'll also be posting more videos regarding pre analysis, leading up the decision to take the trade.

USDCAD: Detailed Structure Analysis 🇺🇸🇨🇦
Here is my latest structure analysis for USDCAD pair.
Horizontal Key Levels:
Support 1: 1.3260 - 1.3340 area
Resistance 1: 1.3636 - 1.3667 area
Resistance 2: 1.3765 - 1.3815 area
Resistance 3: 1.3830 - 1.3860 area
Vertical Key Levels:
Vertical Support 1: Rising trend line
Vertical Resistance 1: Falling trend line
Consider these structures for pullback/breakout trading.
❤️Please, support my work with like, thank you!❤️

CADJPY - DAILY - Bullish Breakout & Continuation TradeTechnical analysis of a potential breakout & trend continuation trade using price action analysis, Fibonacci, structure & volume to predict the direction of the breakout & the ideal location for placing profit targets.
If you have any questions or comments about anything discussed in the video, please leave them below & before you leave DO ME A FAVOR & show your support by hitting that LIKE BUTTON.
I hope you guys have a great weekend!
Your Trading Coach - Akil

GBPNZD I Impulse flag and continuation
Welcome back! Let me know your thoughts in the comments!
** GBPNZD Analysis - Listen to video!
We recommend that you keep this pair on your watchlist and enter when the entry criteria of your strategy is met.
Please support this idea with a LIKE and COMMENT if you find it useful and Click "Follow" on our profile if you'd like these trade ideas delivered straight to your email in the future.
Thanks for your continued support!

The Yen to take a Dump vs the Dollar. BUY UJ tomorrow AMUSDJPY is overwhelmingly bullish now that price has retraced on the Daily timeframe to form a Higher Low. From the top down its very evident that higher highs are on the horizon. There was some weekly indecision at the high last week at a strong resistance level. After a Daily bullish correction trendline was broken price retraced bearish to re-test the back of a trendline, 78.6 Fibonacci level, as well as a 3rd trendline bounce. This is all confluence for a long set-up. Last Thursday (5/4) and Friday 5/5) created two indecision candles on top of structure as well as a reversal signal in the mix. This is a recipe for a Long bias. A clear daily set up. Higher high. Higher low. Indecision on top of support. Price is currently on the buy side of two strong trendlines. I'm looking for a re-test to go long. for another Higher high, potentially to the next weekly Level.

A Four Hour Evening Star Formed at 38.2Weekly momentum may suggests that intraday momentum is bullish. Last week closed out a very strong bullish engulfing from the low of a weekly range. However The Daily is currently at a key reversal area despite its attempt to create a higher high. The 4 hour has been uptrending with high highs and higher lows despite many weak bullish candles. I believe price is relativelty close to topping out at its high for a reversal given that a confirmed evening star formed at a zone, resistance and the major 38.2 level. The one hour has already broken a bullish correction trendline and the 8MA has crossed to the downside of the 21SMA. 0.67872 is a key area for a short re-test as well as the wick of the evening star. There a monthly resistance right above this new high. I'll be monitoring the 4 hour timeframe for more signs of bear strenth. I'll be looking to enter on a 30MIN or 1 hour set up.

Bitcoin bearish swing setupYeah I believe that if price can start breaking down of the structure then 26k-25k are imminent.
Although I’ll happily let the market prove me wrong if not anyway.
Happy Trading !!!

Potential buy for GBPJPYPrice has potential for the upside upon the retest of the broken previous high and the recently formed low, wait for lower timeframe confirmation to confirm the move.

Potential buy for CADJPYPrice has potential for the upside upon the retest of the broken previous high and the recently formed low, wait for lower timeframe confirmation to confirm the move.
