07.04.25 Morning ForecastPairs on Watch -
FX:EURUSD
FX:GBPUSD
FX:EURGBP
FX:GBPCAD
A short overview of the instruments I am looking at for today, multi-timeframe analysis down to what I will be looking at for an entry. Enjoy!
Structure

04.04.25 Morning ForecastPairs on Watch -
FX:GBPUSD
FX:USDJPY
FX:NZDUSD
A short overview of the instruments I am looking at for today, multi-timeframe analysis down to what I will be looking at for an entry. Enjoy!

AUDJPY - Follow The Bears!Hello TradingView Family / Fellow Traders. This is Richard, also known as theSignalyst.
📈AUDJPY has been bearish trading within the falling channel in red.
Currently, AUDJPY is approaching the upper bound of the channel.
Moreover, it is retesting a strong structure marked in orange.
🏹 Thus, the highlighted red circle is a strong area to look for sell setups as it is the intersection of the structure and upper red trendline.
📚 As per my trading style:
As #AUDJPY is around the red circle zone, I will be looking for bearish reversal setups (like a double top pattern, trendline break , and so on...)
📚 Always follow your trading plan regarding entry, risk management, and trade management.
Good luck!
All Strategies Are Good; If Managed Properly!
~Rich
Disclosure: I am part of Trade Nation's Influencer program and receive a monthly fee for using their TradingView charts in my analysis.

03.04.25 Morning ForecastPairs on Watch -
FX:EURAUD
FX:GBPAUD
A short overview of the instruments I am looking at for today, multi-timeframe analysis down to what I will be looking at for an entry. Enjoy!

02.04.25 Morning ForecastPairs on Watch -
FX:CADJPY
A short overview of the instruments I am looking at for today, multi-timeframe analysis down to what I will be looking at for an entry. Enjoy!

01.04.25 Morning ForecastPairs on Watch -
FX:GBPAUD
TVC:USOIL
A short overview of the instruments I am looking at for today, multi-timeframe analysis down to what I will be looking at for an entry. Enjoy!

31.03.25 Morning ForecastPairs on Watch -
FX:EURUSD
FX:GBPJPY
A short overview of the instruments I am looking at for today, multi-timeframe analysis down to what I will be looking at for an entry. Enjoy!

BTC Swing Points (Linear Scale) ISTRUCTURAL AWARENESS
This analysis seeks to provide structural insights by identifying key levels and understanding historical price patterns to anticipate the limits potential future scale of price movements.
Indicators in use:
I'd start with retrieving HH LH HL LL points by script I've designed based on Pivot Points to be as aware as possible of key levels of the historic structure:
Adding altered Zig Zag that shows only percentage change of the swings. This would be another layer of the historic pattern capture:
BOTTOMS:
Wave analysis from '22 - '24
Logarithmic Trendline: It looks like a curve on linear scale, which we will use to link the composite but significant lows and extend it to the right. This gives a sense of a low levels which we assume would be hard to break anytime soon because of the price is a range away:
Breaking below and staying under that level for more than a few bars would signal a bearish trend, depending on emerging patterns at smaller scales as price nears the curve.
Since a Double Top pattern could develop, an additional line curve aligned with the HL and passing through the next bottom (black dashed curve) is necessary. If price breaches the main curve’s orange dotted line, it may descend toward the secondary curve, a significant lower boundary derived from historical curvature. A break below this level would require an even stronger bearish effort to actually keep it below because of high volatility and existing frequency of reversals.
Adding short-term trendlines which would be easier to break (Red and dark orange dotted continuation of the lines)
TOPS:
To anticipate how high it can grow, we'll connect the extreme tops as well.
2021 ATH ➡︎ 2024 ATH
2021 TOPS
2017 ATH ➡︎ 2021 1st TOP
Price breaking above "2017 ATH ➡︎ 2021 1st TOP" is a sign to switch to log scale where identical distance resembles identical % change to capture a bigger scale move relative to the structure.

28.03.25 Morning ForecastPairs on Watch -
FX:EURAUD
FX:AUDJPY
A short overview of the instruments I am looking at for today, multi-timeframe analysis down to what I will be looking at for an entry. Enjoy!

27.03.25 Morning ForecastPairs on Watch -
FX:NZDCAD
OANDA:XAGUSD
FX:NZDUSD
A short overview of the instruments I am looking at for today, multi-timeframe analysis down to what I will be looking at for an entry. Enjoy!

26.03.25 Morning ForecastPairs on Watch -
OANDA:XAGUSD
FX:EURUSD
FX:NZDUSD
A short overview of the instruments I am looking at for today, multi-timeframe analysis down to what I will be looking at for an entry. Enjoy!

24.03.25 Morning ForecastPairs on Watch -
FX:AUDJPY
FX:EURUSD
FX:GBPAUD
A short overview of the instruments I am looking at for today, multi-timeframe analysis down to what I will be looking at for an entry. Enjoy!

EUR/GBP - Precision in ChaosPrice action may be wild, but structure is structure—no noise, just levels. The 4H major LH is broken, giving a clear bullish outlook. Liquidity hasn’t been taken yet, nor has order flow fully played out, so the setup is still in motion.
Dropping to the 30M, I spotted a clean OB mitigation, confirming continuation potential. Now, it’s all about execution—on the 5M, I’m waiting for a CHoCH sweep and retrace for my entry. Simple, clean, and calculated.
For clarity, I’ll be showing the 15M chart, and I’ll be posting updates throughout the week to track how the markets play out. Stay tuned—blessings and precision trading ahead.
Bless Trading!

AUD/ USD - Playing the Bullish Wave with Precision The 4H is holding bullish structure, but liquidity and the order block (OB) haven’t been tapped yet. That doesn’t stop the play—I’m riding the bullish continuation on lower timeframes until price tells me otherwise.
Dropping to the 30M, I’ve spotted a clean OB mitigation. Now, it’s all about refinement—switching to the 5M, waiting for a clear CHoCH, and letting price retrace back into the OB after liquidity is taken. No chasing, just precise execution. Let’s see how it plays out.
Bless Trading!

XAU/USD - Riding the Momentum with Precision
The 4H is holding bullish structure, but a liquidity sweep is still on the table. Instead of sitting on the sidelines waiting, I’m taking action—riding the bullish continuation on the 30M until structure shows signs of failure.
My focus? Playing the 30M buys smartly, tracking momentum until price either sweeps 4H liquidity or gives signs of exhaustion. For clarity, I’m showcasing the 2H chart—clean, precise, and straight to the point. Let’s see how gold moves.
Bless Trading!

SOL/USD - Smart Plays in Motion The 4H is printing bearish structure, signaling strong selling intent—but there’s a key detail: liquidity hasn’t been swept yet. That tells me there’s still room for a bullish retracement before the next major move.
On the 30M, I’ll be riding the bullish momentum, looking for continuation buys until price reaches the nearby 30M supply. That’s where my attention shifts—once price mitigates that area, I’ll be ready for the next play. Let’s see how it unfolds.
Bless Trading!

USD/JPY - Playing the Retracement SmartThe 4H is locked in a bearish structure, breaking a major recent low—confirming downside intent. But before further drops, I see a play. Liquidity needs to be grabbed, and that means a bullish retracement is on the table.
Dropping to the 30M, I’m looking for confirmation to ride the bulls up into the 4H supply zone—the red zone where sellers are likely waiting. Precision over impulse, patience over noise. Let’s see how price delivers.
Bless Trading!

EUR/USD - Precision Trading in MotionThe 4H is flexing strong bullish momentum, pushing through structure with authority. I’ve spotted a near liquidity sweep, signaling the potential for the 4H high to get taken next. Now, it’s all about timing the entry.
Dropping to the 30M, I’m patiently waiting for a clear shift in price direction—once it’s confirmed, I’ll ride the bullish wave straight to the highs. No rush, no guessing—just executing with precision. Let’s see how it plays out.
Bless Trading!
NASDAQ - Precision in Motion The 4H is locked into bearish intent, printing clear bearish structure and breaking a major low, setting the stage for further downside. But before the continuation, I see an opportunity—price needs to sweep liquidity. Instead of forcing shorts prematurely, I’m riding the bullish retracement into 4H supply, where the real decision-making happens.
For clarity, I’m dialing into the 2H—perfectly balanced for precision and structure, giving you all a crystal-clear view of how this setup unfolds. The game is patience, execution is key. Let’s see how price plays its hand.
Bless Trading!

BTC - Let's Keep It Simple!Hello TradingView Family / Fellow Traders. This is Richard, also known as theSignalyst.
🏢BTC Building Blocks:
📉 Short-Term Bearish:
BTC is currently trading within a short-term bearish block between $81,200 and $87,500.
📉 Long-Term Bullish:
If the $81,200 low is broken to the downside, BTC is expected to enter the long-term bearish block.
📈 Short-Term Bullish:
If BTC breaks above the short-term bullish block at $87,500, it will enter a short-term bullosh block phase towards the $95,000 structure.
📈 Long-Term Bullish:
If the $95,000 level is broken to the upside, a long-term bullish movement toward the all-time high would be expected.
📚 Always follow your trading plan regarding entry, risk management, and trade management.
Good luck!
All Strategies Are Good; If Managed Properly!
~Rich

21.03.25 Morning ForecastPairs on Watch -
FX:NZDJPY
FX:AUDJPY
FX:EURUSD
FX:GBPUSD
A short overview of the instruments I am looking at for today, multi-timeframe analysis down to what I will be looking at for an entry. Enjoy!

18.03.25 Morning ForecastPairs on Watch -
FX:EURNZD
FX:GBPNZD
FX:GBPUSD
A short overview of the instruments I am looking at for today, multi-timeframe analysis down to what I will be looking at for an entry. Enjoy!

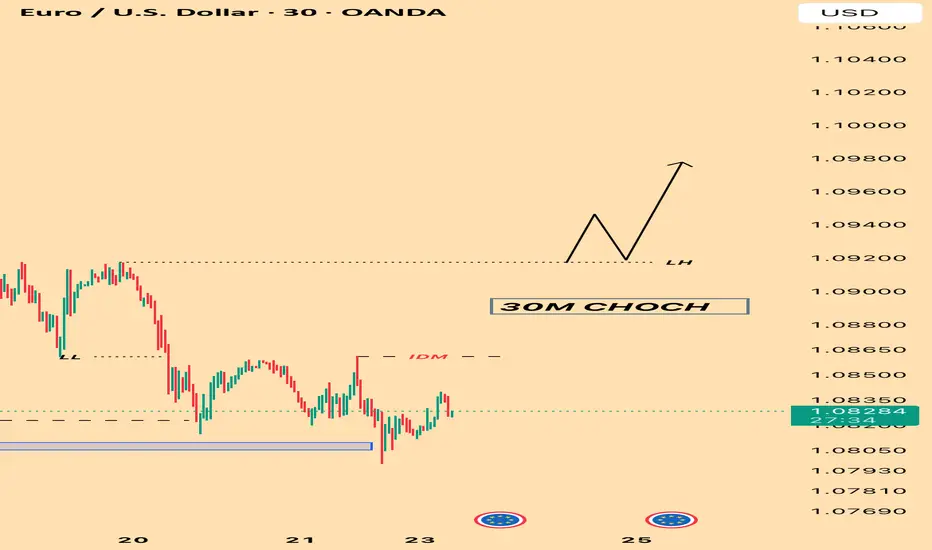
“USD/JPY | 30M CHoch > inducement > 4H Play”30M just gave a clean CHoCH, breaking a major LH, signaling bullish intent—at least for now. I’m waiting for inducement to be taken before price taps into my order block, lining up with the 4H move. The goal? Ride price up into 4H supply, then look for the sell-off from mitigation. Letting price show its hand first.
Bless Trading!
