#GBPJPY near 4h timeframe resistive area one againlook where price is one more time at an area where rejected clearly twice before plus it's a structural point too ( it use to be support but changed to resistance ) if you look at the left side of the chart. this cluster of resistance add to the importance of the area.
But the thing is matter most is not to rush into a trade as we have CPI news today and depends on what the numbers going to be it can cause price to break the resistance to the upside or to reject from.
If you want to have more comprehensive idea about what to expect of news are going to be released today and tomorrow I would recommend you to read the idea linked to this article.
But in summery, if CPI comes out equal or lower the prediction it would be good JPY and we can expect the downside move from GBPJPY .
Structureanalysis
#EURJPY selling position opportunityAs we discussed before in #JPYBASKET analysis ( you can see it in related ideas ) we believe JPY is aiming for higher prices due to technical and fundamental analysis, and in order to take advantage of this move we can sell other currencies against JPY.
Price currently in EURJPY pair is moving down and has formed bearish channel in 4H timeframe which can be tested one more time during today trading time or tomorrow. moreover, price managed to get very close to 4H timeframe high and base on market structure analysis if price want to continue moving downward in 4H timeframe it shouldn't close above this area.
In conclusion, for taking a short position on this pair base on 4H time frame we need to see price tap into any of two line drove above the price but fail to close above it. and then get rejected from the area. which can prove that sellers are in the market and also the capitulation move is over too. Also for more validation you can wait to see market structure in lower timeframe also shifted in the favor of the downside move.
#CHFJPY possible short opportunitySince JPY index shown potential upside move and already break above a bearish Daily channel as well as forming a reverse Head & Shoulder formation it gave us the idea of to be looking for a shorting opportunity on different JPY pairs like CHFJPY.
If JPY index keep going up to reach its one to one Head & Shoulder target projection then we can expect any upside rally on different JPY pairs can lead to another drop.
With all this being said now if you take a look at CHFJPY chart you can see price formed a bearish impulsive move and as a result of that move formed a new low. since then price been correcting that down side move and now it reached the static resistance area which you can call it structural point too and also 61.8% of Fibonacci level and 1H EMA. which all together can give us a resistive cluster.
moreover, price also did reject from the area just recently and formed two bearish 1H candles, which shows that sellers are there. but in order for us to be able to sell we need another bullish move in lower time frame. but unable to goes above the recent top and 1H EMA or at least wont close above it.
#AUDJPY sell opportunityPrice clear bearish structure in 1H timeframe, price shows reaction to structural point ( previously acting as a support but now its acting as a resistance area ).
Now for a short position we need price to comes up one more time and reject from the area and forming a kind of toping formation like double top which is possible in lower timeframe to be able to sell.
Also price taking out liquidity from above the arrow but failing to close above them is another great signal to take a sell position on this pair.
#USDCAD another sell opportunityPrice has formed a V-TOP chart pattern formation as you can see in 4H timeframe and also managed to close below 4H low which means that our structure now turned to bearish again. due to V-TOP formation price formed a bearish engulfing candle in Daily timeframe which is a strong signal for bearish move and also as we can see we are in overall in bearish move so we can interpret this daily candle as an continuation signal for higher wave cycle.
Now that we have bearish bias we should be looking for areas which potentially price can tap into in lower timeframe like 1H or lower, take out some liquidity and turn to the downside again.
#JPYbasket bullish move confirmationsyesterday red candle was not only a retest to a broken bearish channel upper line, but also head and shoulder neckline. in addition to these two confluence we should be aware that JPY index suffers a lot through past month during rate hike cycle of central banks and fall massively like never before.
But now that we have some confluences that we are close to end of rate hike cycle JPY has found some room to appreciate against other currencies and as a result in technical aspect we can see it had formed and broke bullish chart pattern and its no longer trading in bearish channel.
with the look at the text book chart pattern target we can see that price can come all the way up to the oldest bearish channel midline and from there we should be looking for other confirmation and change in macro-economy.
#EURCHF bearish move possibility from 2 areaAs you can see in the chart bearish impulsive move followed by a corrective bullish move which shows price intention of moving lower after completing its corrective move. now in this case we need to be looking for an area where corrective move may end.
for a bearish move to resume price need to take out enough liquidity in order to move down, as it can be seen in the chart 2 areas are close to price with enough liquidity resting above it. the closer is above the previous candle in the form of bearish engulfing and the further out area is a local top which formed in the bullish corrective move which price already test it twice and there are huge amount of liquidity there.
For taking a position from any of these 2 areas you need to remember:
that price need to tap into a area clearly. but unable to close above the area.
also it is possible that price fail to reach the zone but to engage in a position it should fit your strategy.
#GBPJPY selling opportunityprice bearish impulsive move broke market structure as well as short term bullish trendline to the downside. price is now below 1H, 30M, 15M EMA 200, and in last hour price formed a bearish engulfing candle which shows that sellers are now into the market after a short term bullish corrective move.
now that we have different confluence for bearish scenario we can sell this pair if following happen:
1- price fail to close above the arrow
2- price forming double top or failure swing formation. (both of the formations shows price failing to goes higher)
3- bearish engulfing candle stick formation
US500 BUY SETUPUS500 Structure is pushing upside, we can discern price approaching a Flip Zone aligning with Equilibrium fib level. I expect a continuation from this area
STRUCTURE - The key to success!STRUCTURING - The key to success! (Part 1)
That structuring and order is the key to success, most will have already heard and partially applied in their own lives.
- Chart analysis is no exception and after correct application the results are even monetarily noticeable.
- How this can be implemented specifically in "TradingView", I present to you in this article.
TABLE OF CONTENTS
1st Part = THE PROBLEM
2nd Part = THE SOLUTION
3rd Part = CONCLUSION
PART 1 = THE PROBLEM
"EVERYONE WILL KNOW THE EXPERIENCE,
TO HAVE SET A TRADE, TO BE SURE OF VICTORY,
ONLY TO BE MERCILESSLY STOPPED OUT."
In hindsight, you analyze your failed trade and realize that in another "Time Frame" an important support/resistance level was below/above your "Stop Loss" and the "Trade Idea" was already - BEFORE - INVALIDATED.
-> So one could have saved the "LOSS".
Most of us will analyze several "Time Frames" to know - which levels are strong/weak and relevant.
-> Regardless of the preferred "Time Frame", one will include the next larger/smaller "Time Frames" in one's analysis.
-> The more "Time Frames" you analyze and include in your final decision, the more confusing it gets.
-> The chart looks like a battlefield and the probability to make a profitable decision diminishes - significantly.
The time spent to put together the individual pieces of the puzzle to the big whole is no longer presentable.
= Headaches and a bad decision are pre-programmed.
To avoid this problem and to make the "Multi-Time-Frame" analysis as effective as possible. I have tested the possibilities provided by "TradingView" and worked out solutions that work for me.
-> I will present these in the following posts to inspire you and possibly provide a solution for an already existing problem.
The benefits of a working structure are:
"LONG-TERM TIME SAVINGS" + "SIGNIFICANTLY BETTER DECISIONS".
2. PART = THE SOLUTION
2.1. INTEGRATION OF THE OBJECT TREE
The platform provides an "element" overview - of all objects drawn in.
-> this option is an excellent way to structure all the objects located in the chart.
- If you haven't used this option before, you will probably belong to the majority.
- Unfortunately, this tool has not been sufficiently promoted by "TradingView", which is why it is unknown to many.
You can find the "Object tree" on the right side, at the very bottom. (Image 1)
If you have never used / structured the object tree before, it will look similar to our "UN-ORDERLY" example. (Image 2)
In the third image, you can see how it can be once you take the time to add order. (Image 3)
To get an overview, you can sort the drawn objects into groups and label them, depending on your own preference / structure.
- This works with a simple right click on the object (e.g. Fib-Retracement).
- There is then the selection "CREATE A GROUP OF DRAWINGS".
Once several groups have been created, you may need a placeholder.
Any is not provided by the program, but can be easily created yourself.
= Simply draw a point with the BRUSH tool.
-> switch off all Time Frames at Visibility
-> create own folder for this point with e.g. "- - - - - - -".
3. PART = CONCLUSION
With a little effort, order and structure can be provided here in the "much" edited charts.
How you want to set up this structure is entirely up to you. In case you need a little inspiration, you can take the one I created.
- - - - - - - - - - - - - - -
IDT - Supply&Demand
IDT - Fibonacci
IDT - Trendlines
IDT - Point of interest
IDT - Market Structure Break
- - - - - - - - - - - - - - -
HTF - Supply&Demand
HTF - Fibonacci
HTF - Trendlines
HTF - Point of interest
HTF - Market Structure Break
HTF – Volume level
- - - - - - - - - - - - - - -
LONG IDEA
SHORT IDEA
- - - - - - - - - - - - - - -
IDT = Intraday
HTF = Higher Time Frame
If this idea and explanation has added value to you, I would be very happy about a review of the idea.
Thank you and happy trading!
EURGBP Slow moving but likely to fall to supportWelcome back! Let me know your thoughts in the comments!
**EURGBP - Listen to video!
We recommend that you keep this pair on your watchlist and enter when the entry criteria of your strategy is met.
Please support this idea with a LIKE and COMMENT if you find it useful and Click "Follow" on our profile if you'd like these trade ideas delivered straight to your email in the future.
Thanks for your continued support!
Brian & Kenya Horton, BK Forex Academy
US500 Short SetupUS500 is structure is bearish, trend is pushing down and right now we can discern price gravitating back to 1H order block. Let's wait and watch how price will react from this point of interest. Goodluck!
GBPCAD I Structure Trade I Short from Resistance 200 PipsWelcome back! Let me know your thoughts in the comments!
**GBPCAD - Listen to video!
We recommend that you keep this pair on your watchlist and enter when the entry criteria of your strategy is met.
Please support this idea with a LIKE and COMMENT if you find it useful and Click "Follow" on our profile if you'd like these trade ideas delivered straight to your email in the future.
Thanks for your continued support!
Brian & Kenya Horton, BK Forex Academy
EURCAD Detailed Trading Plan! Let's GO!Welcome back! Let me know your thoughts in the comments!
**EURCAD - Listen to video!
We recommend that you keep this pair on your watchlist and enter when the entry criteria of your strategy is met.
Please support this idea with a LIKE and COMMENT if you find it useful and Click "Follow" on our profile if you'd like these trade ideas delivered straight to your email in the future.
Thanks for your continued support!
Brian & Kenya Horton, BK Forex Academy
EURGBP New rising trend line +80 Pips Welcome back! Let me know your thoughts in the comments!
**EURGBP - Listen to video!
We recommend that you keep this pair on your watchlist and enter when the entry criteria of your strategy is met.
Please support this idea with a LIKE and COMMENT if you find it useful and Click "Follow" on our profile if you'd like these trade ideas delivered straight to your email in the future.
Thanks for your continued support!
Brian & Kenya Horton, BK Forex Academy
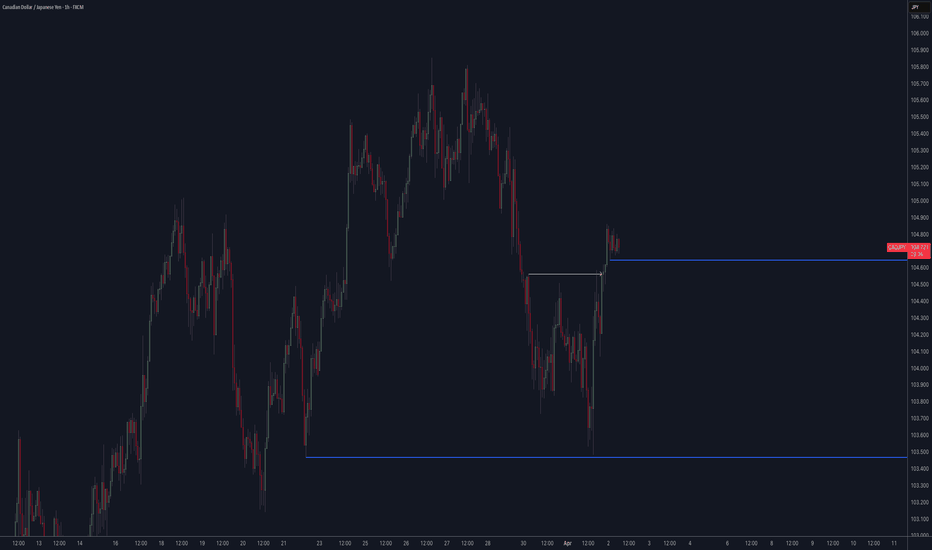
CADJPY Swing Upwards +100 PipsWelcome back! Let me know your thoughts in the comments!
**CADJPY - Listen to video!
We recommend that you keep this pair on your watchlist and enter when the entry criteria of your strategy is met.
Please support this idea with a LIKE and COMMENT if you find it useful and Click "Follow" on our profile if you'd like these trade ideas delivered straight to your email in the future.
Thanks for your continued support!
Brian & Kenya Horton, BK Forex Academy
USDCHF possible SHORT SETUPUSDCHF structure is bearish, price has approached our point of interest (POI)... we can see some reaction on 61.8% fib level taken from previous lower-high to lower-low and a trendline adding a confluence of resistance. I expect this pair to continue down as indicated on the chart