Stellar Lumens (XLM/USDT | STR/USDT)Technicals:
87 Weekly BBands have opened and the price is continuing on its parabolic movement with upper BBand trailing below as support
If the 2017 fractal is in play, then drawing a fib extension from Oct'20 provides a glimpse into what prices could potentially reach into May 2021
Previously, the price extended to the 3.0 and 3.272 fib levels back in 2017. If history repeats, prices could reach a range of 3.7-5.4 USD per Stellar
Strusd

STELLAR - Our Small ChartOur updated small chart with key points.
Our analysis shows possible rise is likely to happen next.

STRUSD (XLM): Rising flagSTRUSD (XLM): Rising flag
Buying in the area of 0.2915 - 0.2395
Targets in the region of 0.3495 - 0.446
Stop, fixing below 0.226
✅ f you like what I do, put 👍 and subscribe
Waiting for your comment, what do you think about this?

STRUSD (XLM)STRUSD (XLM)
Buy in the region of 0.153 - 0.1136
Goal 1 - 0.197
Goal 2 - 0.272
Goal 3 - 0.446
Goal 4 - 0.610
Stop, fixing below 0.1
✅ f you like what I do, put 👍 and subscribe
Waiting for your comment, what do you think about this?

STELLAR / US DOLLAR (STRUSD) WeeklyDates in the future with the greatest probability for a price high or price low.
The Djinn Predictive Indicators are simple mathematical equations. Once an equation is given to Siri the algorithm provides the future price swing date. Djinn Indicators work on all charts, for any asset category and in all time frames. Occasionally a Djinn Predictive Indicator will miss its prediction date by one candlestick. If multiple Djinn prediction dates are missed and are plowed through by same color Henikin Ashi candles the asset is being "reset". The "reset" is complete when Henikin Ashi candles are back in sync with Djinn price high or low prediction dates.
One way the Djinn Indicator is used to enter and exit trades:
For best results trade in the direction of the trend.
The Linear Regression channel is used to determine trend direction. The Linear Regression is set at 2 -2 30.
When a green Henikin Ashi candle intersects with the linear regression upper deviation line (green line) and both indicators intersect with a Djinn prediction date a sell is triggered.
When a red Henikin Ashi candle intersects with the linear regression lower deviation line (red line) and both indicators intersect with a Djinn prediction date a buy is triggered.
This trading strategy works on daily, weekly and Monthly Djinn Predictive charts.
This is not trading advice. Trade at your own risk.

STELLAR / US DOLLAR (STRUSD) MonthlyDates in the future with the greatest probability for a price high or price low.
The Djinn Predictive Indicators are simple mathematical equations. Once an equation is given to Siri the algorithm provides the future price swing date. Djinn Indicators work on all charts, for any asset category and in all time frames. Occasionally a Djinn Predictive Indicator will miss its prediction date by one candlestick. If multiple Djinn prediction dates are missed and are plowed through by same color Henikin Ashi candles the asset is being "reset". The "reset" is complete when Henikin Ashi candles are back in sync with Djinn price high or low prediction dates.
One way the Djinn Indicator is used to enter and exit trades:
For best results trade in the direction of the trend.
The Linear Regression channel is used to determine trend direction. The Linear Regression is set at 2 -2 30.
When a green Henikin Ashi candle intersects with the linear regression upper deviation line (green line) and both indicators intersect with a Djinn prediction date a sell is triggered.
When a red Henikin Ashi candle intersects with the linear regression lower deviation line (red line) and both indicators intersect with a Djinn prediction date a buy is triggered.
This trading strategy works on daily, weekly and Monthly Djinn Predictive charts.
This is not trading advice. Trade at your own risk.

Watch the RSI for bounce.In my previous TA I showed you the H&S pattern which completed. This fall (both BTC and XLM) was very obvious based on the trend and other circumstances worldwide.
We should wait now to see if RSI falls into that low 20s area and set up buys. Nothing falls forever and looking at previous we should have good support here. Historically .04c is a level that we should not go under.
Safe trading.

XLMUSD : Head and Shoulders, Buyers BewareTextbook head and shoulders pattern. BTC/USD Chart ( ) shows very similar pattern which could mean lower prices to come. Watch chart closely but to me this looks like a time to wait it out and buy in at lower prices.

StellarGuys, if you like the idea please put like button, this will be the best thanks. Thank you for your support, I appreciate it.

Stellar Lumens - $XLM - Clean Count$XLM is one of the coins with a clean count. I will use it as a guideline to look for similar setups.
What's noticeable is the fact that there's bearish div on hourly timeframes so we'll range a bit now.
The second subwave of iii was simple so 4 will be complex.
#CRYPTO #XLM $STR #STELLAR #STELLARLUMENS

Stellar Lumens - $XLM - Let it play out... Allowing the wave (2) low is in place at 0.05140.
XLM has continued its decline. Wave ((2)) has a downside limit of 0.0620. A breach wouldn't necessarily rule out a bullish count, but we would have to rethink it.
Key Levels: 0.05140, 0.05693, 0.0620, 0.0890
GOOD LUCK!
We go together
Together we are stronger
Share and like
I am not Bearish long term. I am a Bull of Bulls.
Thanks
God bless you!
Proverbs 19:8
8. The one who gets wisdom loves life;
the one who cherishes understanding will soon prosper.
===============================================================================
BlackMEX - PREMIUM
We are a BITMEX specialized channel.
Our philosophy focuses on capital preservation and good risk/return operations.
We'll share our analysis, calls, and share studies that can help you be a better trader.
Enjoy! ** 2 weeks free sign up
Telegram > t.me
===============================================================================
Twitter > twitter.com
===============================================================================
===============================================================================
CAUTION!
DISCLAIMER
Trading is risky.
Here s a small explanation about why Im giving insight into my trades. Crypto is all about trust and transparency and that is what ID like to bring. Dont expect me to tell you how much crypto I actually own because thats none of your business. But I Will tell you how big my position will be in regard to my trading portfolio.
Secondly and actually the main reason im doiing this, is to proof to all the HALTERS out there that you can earn money with trading crypto. Most people are skeptical about trading because they heard horror stories about people who lost all their money. Follow my journey and let me proof therm wrong.
At the end of the day, the most important thing is how good are you at risk control.
Booking some losses during trading is perfectly normal, so im not afraid to show those losses. Most traders dont give any insight in what they because they perfectly know they suck and dont have a clue what they are doing in regard to risk management.
Risk comes from not knowing what you're doing.
Just like every trader, Ive seen ups and downs in my journey. I started trading stocks. And you can guess what that meant for my portfolio. Yes thats right, it was almost completely wiped out.
But I pressed on, learned a lot about technical analysis and here we are. I have experience in trading stocks, options, and commodities .
So you can assume that I know how to deal with risks.
===============================================================================
$BTC $BCH $BNB $XLM $EOS $ETH $ADA $LTC $TRX $XRP $IOTA $LINK $XTZ $BTT $XMR $NEO $BTT $MATIC $XMR $MRK $XEM $ONT $DASH $BAT $ZRX $LSK $NANO $REP
#altcoins #bitcointrading #cryptocurrency #cryptotrading #CRYPTO #STELLAR #XLM #BuyTheFear #BuyTheDip

There is a trading opportunity to buy in STRUSDTechnical analysis:
. Stellar/Dollar is in a range bound and the beginning of uptrend is expected.
. The price is below the 21-Day WEMA which acts as a dynamic resistance.
. The RSI is at 40.
Trading suggestion:
. There is a possibility of temporary retracement to suggested support zone (0.04950000 to 0.03500000). if so, traders can set orders based on Price Action and expect to reach short-term targets.
Beginning of entry zone (0.04950000)
Ending of entry zone (0.03500000)
Entry signal:
Signal to enter the market occurs when the price comes to " Buy zone " then forms one of the reversal patterns, whether " Bullish Engulfing ", " Hammer " or " Valley " in other words, NO entry signal when the price comes to the zone BUT after any of reversal patterns is formed in the zone. To learn more about " Entry signal " and the special version of our " Price Action " strategy FOLLOW our lessons :
Take Profits:
TP1= @ 0.06570000
TP2= @ 0.08260000
TP3= @ 0.10200000
TP4= @ 0.11930000
TP5= @ 0.13700000
TP6= @ 0.15620000
TP7= @ 0.18010000
TP8= @ 0.22210000
TP9= @ 0.27550000
TP10= @ 0.32880000
TP11= Free

There is a possibility for the beginning of an uptrend in STRUSDTechnical analysis:
. Stellar/Dollar is in a range bound and the beginning of uptrend is expected.
. The price is below the 21-Day WEMA which acts as a dynamic resistance.
. The RSI is at 43.
Trading suggestion:
. There is a possibility of temporary retracement to suggested support zone (0.04950000 to 0.03500000). if so, traders can set orders based on Price Action and expect to reach short-term targets.
Beginning of entry zone (0.04950000)
Ending of entry zone (0.03500000)
Entry signal:
Signal to enter the market occurs when the price comes to " Buy zone " then forms one of the reversal patterns, whether " Bullish Engulfing ", " Hammer " or " Valley " in other words, NO entry signal when the price comes to the zone BUT after any of reversal patterns is formed in the zone. To learn more about " Entry signal " and the special version of our " Price Action " strategy FOLLOW our lessons :
Take Profits:
TP1= @ 0.07100000
TP2= @ 0.08500000
TP3= @ 0.10200000
TP4= @ 0.11930000
TP5= @ 0.13700000
TP6= @ 0.15620000
TP7= @ 0.18010000
TP8= @ 0.22210000
TP9= @ 0.27550000
TP10= @ 0.32880000
TP11= Free

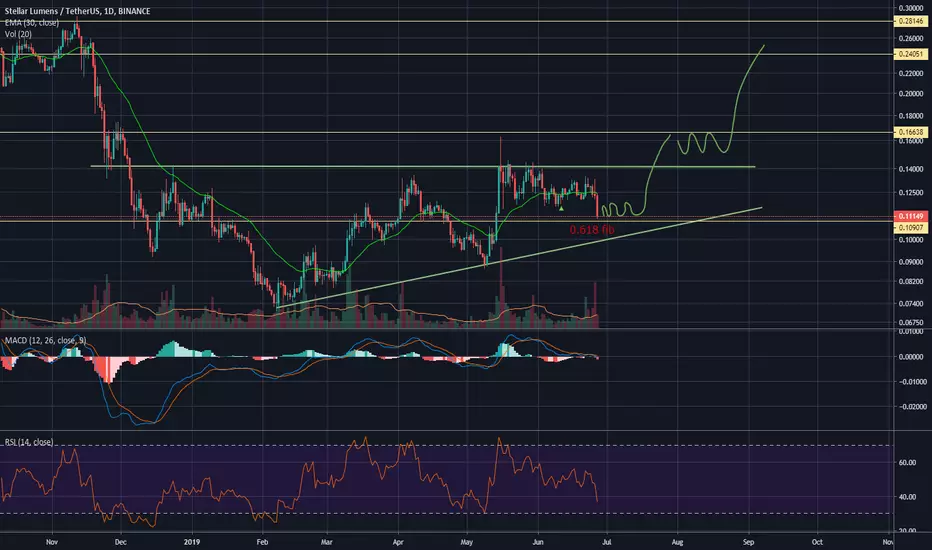
STRUSD - Buy a breakout in Stellar LumensSTRUSD is in an uptrend previously reached its 3rd progression. Until now it retraced 50% since the last top and reached both a valid horizontal resistance zone and the ascending blue trendline.
The idea is to buy a breakout over both the descending orange trendline of the consolidation since the last top and the green line, especially if this coincides with a significant increase in volume.
A stoploss should be applied unter the red line. If the weekly uptrend continues a new high should eventually be reached.

There is a possibility for the beginning of an uptrend in STRUSDTechnical analysis:
. Stellar/Dollar is in a range bound and the beginning of uptrend is expected.
.The price is below the 21-Day WEMA which acts as a dynamic resistance.
. The RSI is at 39.
Trading suggestion:
. There is a possibility of temporary retracement to suggested support zone (0.08495 to 0.07211). if so, traders can set orders based on Price Action and expect to reach short-term targets.
Beginning of entry zone (0.08495)
Ending of entry zone (0.07211)
Entry signal:
Signal to enter the market occurs when the price comes to "Buy zone" then forms one of the reversal patterns, whether "Bullish Engulfing" , "Hammer" or "Valley" in other words,
NO entry signal when the price comes to the zone BUT after any of the reversal patterns is formed in the zone.
To learn more about "Entry signal" and the special version of our "Price Action" strategy FOLLOW our lessons:
Take Profits:
TP1= @ 0.10213
TP2= @ 0.11930
TP3= @ 0.13400
TP4= @ 0.14993
TP5= @ 0.17345
TP6= @ 0.20730
TP7= @ 0.23610
TP8= @ 0.28670
TP9= @ 0.33745
TP10= Free

Xlm/btc About to reverseStellar lumens forming a bottom with bull divergence on rsi, getting ready to reverse the trend. will also perform really good against dolar pair.

There is a trading opportunity to buy in STRUSDTechnical analysis:
. Stellar/Dollar is in a range bound and the beginning of uptrend is expected.
. The price is below the 21-Day WEMA which acts as a dynamic resistance.
. The RSI is at 46.
. While the RSI downtrend and the price downtrend in the daily chart are not broken, bearish wave in price would continue.
Trading suggestion:
. There is a possibility of temporary retracement to suggested support zone (0.09934000 to 0.08942000). if so, traders can set orders based on Price Action and expect to reach short-term targets.
Beginning of entry zone (0.09934000)
Ending of entry zone (0.08942000)
Entry signal:
Signal to enter the market occurs when the price comes to " Buy zone " then forms one of the reversal patterns, whether " Bullish Engulfing ", " Hammer " or " Valley " in other words,
NO entry signal when the price comes to the zone BUT after any of the reversal patterns is formed in the zone.
To learn more about " Entry signal " and the special version of our " Price Action " strategy FOLLOW our lessons:
Take Profits:
TP1= @ 0.11930000
TP2= @ 0.13400000
TP3= @ 0.14770000
TP4= @ 0.17342000
TP5= @ 0.18912000
TP6= @ 0.20730000
TP7= @ 0.23610000
TP8= @ 0.28670000
TP9= @ 0.33745000
TP10= Free
