EURUSD Short Position (1Hr Timeframe)Potential short position as trend breaks support and makes bullish move to retest previous support which I believe will lead to bearish move although there is no indication from my technical indicators.
Student

NZDUSD Long PositionPotential long position as trend has broken through resistance and could continue to bullish movement

EURUSD Potential Short Position (4hr Timeframe)Potential short as trend retests previous support line to then gather momentum to continue bearish move which could potentially reach monthly support line at 1.07746

GBPNZD Short Position (1Hr Time Frame)Potential Short Position as trend breaks out support and retests new resistance which I believe will lead to a bearish move as indicated by ADX

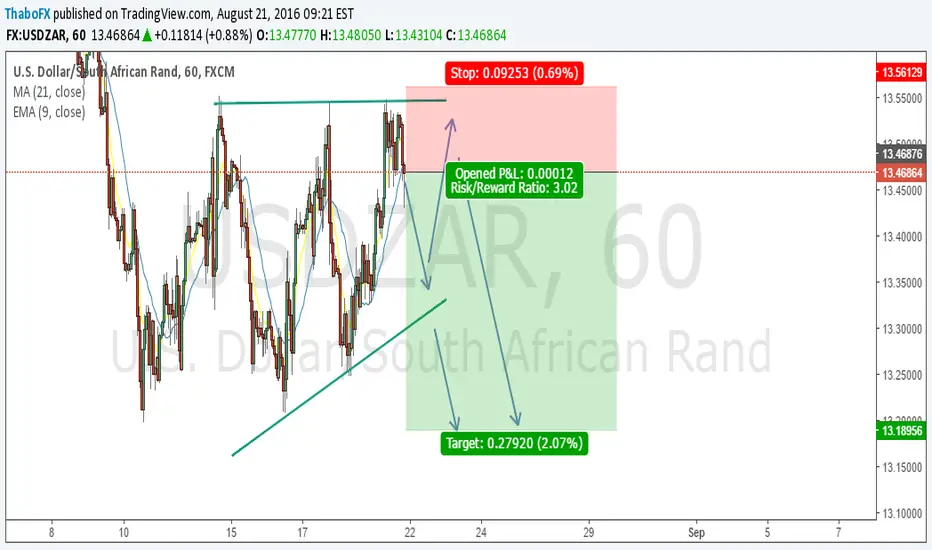
USDZAR Potential Short Position (1Hr Time frame)Potential Short position as trend retests area of resistance and begins bearish move as indicated by ADX
GBPUSD Short Postion 4Hr TimeframePotential short position as trend begins to breakout from area of support

EURGBP Shortpotential short as indicated by RSI indicator as well as the strength of the trend indicated by ADX

EURCAD Potential Long PositionPotential retracement to hit 21-period moving average as support to continue bullish movement following the earlier reaction to the economic news in germany. (note: ADX also lies above 15 level signal strong trend)
www.dailyfx.com

USDJPY Long PositionPotential long position as trend begins bullish movement towards daily resistance. However, whether the trend breakouts the resistance or not is dependent on tomorrow's economic news in Japan

EURUSD Potential ShortPotential Short position to continue downward trend with potential retracement

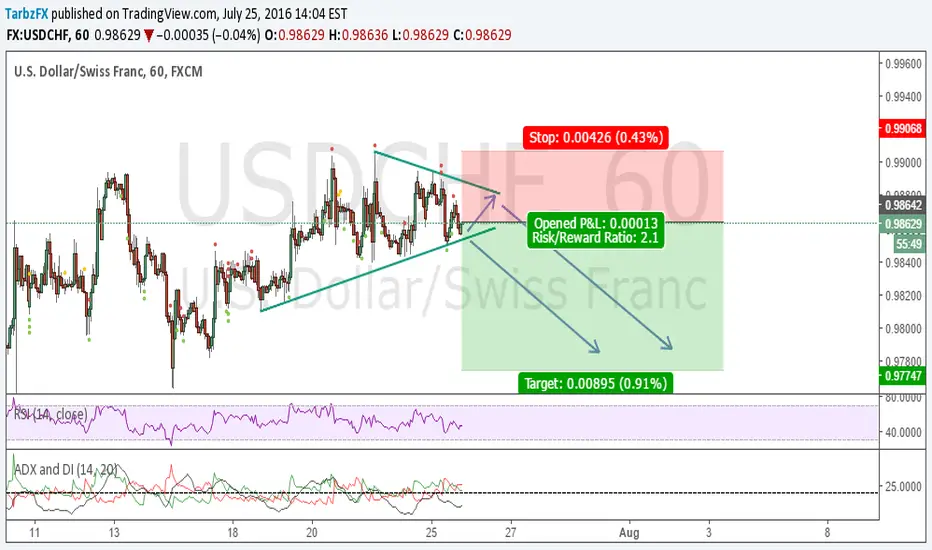
USDCHF Potential Short Position (1Hr Timeframe)Potential short position due to candlestick analysis as RSI and ADX don't indicate anything
(p.s I have stopped using the Ichimoku indicator as I was experience in inaccurate analysis gaining false signals)
EURJPY Long Position (3hr Timeframe)Potential Long position as indicators is above the Ichimoku cloud as well as potential bullish movement indicated by ADX

USDJPY Potential Short (1hr Timeframe)Potential Short position as indicated by ADX indicator as well as Ichimoku indicator due to chikou span crossover as price action begins to move below the Ichimoku clouds.
(Note: This is my first time using the Ichimoku indicator)

USDCAD Potential ShortPotential short setup following the previous idea, as I believe the trend will continue towards the daily support, however, there could potentially be a retracement as indicated by the MACD before continuing its bearish move.

USDJPY Potential Long Setup (1hr Timeframe)Potential retracement as indicated by MACD which I believe will continue bullish movement after initial retracement.

EURCAD Potential Short (1hr timeframe)Potential continuation of bearish movement as I believe the trend will rebound from daily support line

USDCAD Long PositionCurrent trend approaches the weekly support which I believe will cause a potential reversal as RSI indicates oversold as well as MACD


EURUSD Potential long positions (30 minute timeframe)Potential continuation of the trend, however, could break 0.382 fib level into a bearish move


USDCHF Long Position (1 hour Time frame)Potential rebound off weekly support line with a rally towards the monthly resistance or a breakout of the weekly support in the future

EUR/USD LONGChanged my bias towards the eurodollar at the end of Friday's close after i got completely stopped out. first technical loss but i went back to the charts to see where i went wrong and i realized that i didn't look at the smaller time-frames. But lesson learnt. So i went back to the drawing board on Sunday and spent quite a few hours analysing. Wrote most of my technical points on my note pad but i took the trade straight from open as i had quite a good conviction it was gonna pierce through the 1.1500 barrier which it did breaking out of the range of which it was trading for a long time which is good to see. But expecting the pair to push to 1.1600/s and 1.1700/s respectively and highly likely to push even further in the long run. Also good to see since i'm a student that a lot of other traders who have a lot more experience have gone for the same bias. Gives me more confidence in my strategy, although it might look complicated on screen. In the coming weeks i'll be breaking down analysis with more description, talking key zones etc etc. But for now enjoy my bias and open up your own chart and apply your little touch to make it yours.

EUR/USD SHORTSo, EUR/USD broke april support level creating a lower low for the month with a shooting star followed by a bearish engulfing. Im expecting a slight pullback at 1.11445 to around the 1.1170's area before a continuation towards the downside. Pair is currently sitting on the 0.618% retracement also commonly known as the pivot on the retracement.
i've set a few take profit targets, TP1 at 1.11445, TP2 at 1.10697, TP3 at 1.09830 and TP4 at 1.08204 respectively
