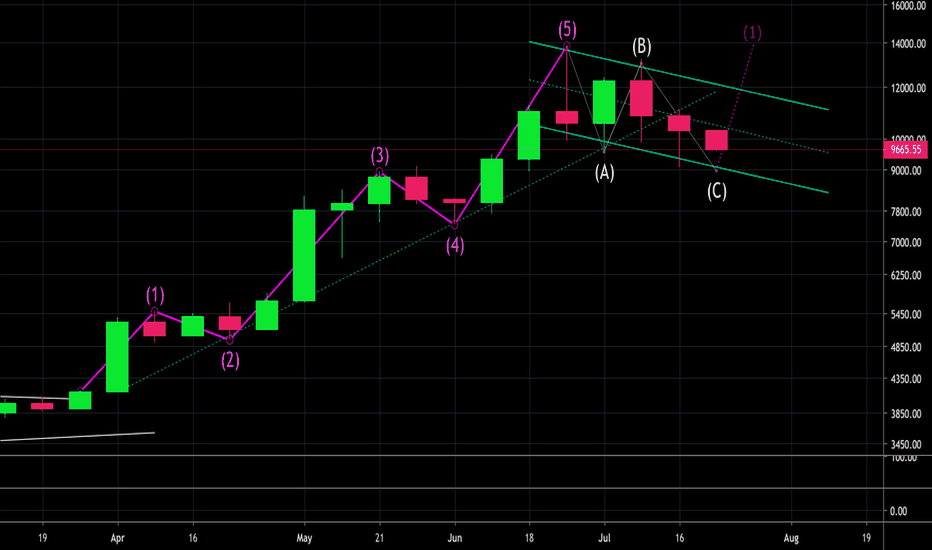
Bitcoin // Elliot wave study // 7D+DHello,
This is only a test on the Elliot wave principle. I am not too familiar with the theory, yet. However, I am very intrigued and will continue studying it.
I did not bring wave c to support at wave 4 because the corrective ABC waves are playing well within the current bullish channel.
Any thoughts, suggestions, or constructive criticism is welcome. Thank you.
- B
Daily:
Study
RSHistorically on a big ramp down this traces back up by about 50% so 6.82 resistance is the best I will give it. currently such a low float (less than 1m) good pr and this will move very fast. but management sucks so I expect them to announce an offering on a good pop up IMO. overall picture is more down trend, you can play both sides FYI.
broke bullishalright everybody. good close and broke bullish for er Monday. breaking rule hear to hold through ER. Be UP EARLY!
thoughts going forwardthis is what I would like to see going forward to next week. Previous RS. catalyst Thursday. looking for a good ramp up IMO. this is not a recommendation to buy or sell.
$TSLA Study with predictions.Key Notes!
MA's & EMA's:
- Weekly 356 Day Moving Average = $220.50
- Weekly 300 Day Moving Average = $252.50
- Weekly 300 Exponential Moving Average = $234.50 *
DASHED:
- 3 Month Breakout Candle 50% level = $249.18
- 3 Month Candle (BULL STANCE) 50% level = $228.73
- 3 Month (If shit hits the fan) 50% of (January 2014 important candle) = $200.84
- Strongest Support @ 3 Month 2013 candle = $149.50
SOLID:
- 1 Month Breakout Candle 50% = $234.71 *
- 1 Month BULL STANCE BREAKOUT 50% = $217.18
- 1 Month Pivot (bulls take control) 50% = $201.90
High Flying Momentum Stock Just Getting Started Today!High Flying Momentum Stock Just Getting Started Today!
$18 is the next target within a couple of days then $19.60 for a double top.
Get more alerts at www.TheTechnicalTraders.com
Two Price targets on the way to being reached - mega double topUsing simple price patterns and fib extensions we get two targets wit juicy gains.
This is much like my NIO 21.7% trade
and also like ROKU 18% trade


