Pennant — Trend Is Your Best Friend 🚩 Pennant — Trend Is Your Best Friend 📈
drive.google.com
🔍 Introduction
The Pennant is a trend continuation pattern, resembling a small triangle that forms after a strong initial move (known as the “flagpole”). It is similar to the Flag pattern, but with one key difference: the body of the Pennant is formed by two converging trendlines, rather than parallel ones.
📐 Pattern Description
The Pennant forms after a strong, impulsive price move, indicating that the trend is likely to continue after a short pause.
Like the Flag, the Pennant consists of two main components:
The flagpole — a sharp, directional move (either bullish or bearish)
The Pennant body — a brief consolidation shaped like a symmetrical triangle 🔺
🟢 A bullish pennant forms after a strong upward move
🔴 A bearish pennant follows a strong downward move
🧠 Market psychology behind the pattern:
After a big move, many traders expect a reversal and begin taking counter-trend positions. But when the breakout occurs in the direction of the original trend, it triggers a wave of new orders, pushing price even further. That’s why the Pennant is often used to enter trades in the direction of the dominant trend.
📉 Volume behavior is also key:
High volume during the initial move
Low volume during the Pennant’s consolidation
Rising volume on the breakout
This volume pattern reflects renewed trader interest and often leads to a more explosive breakout compared to a Flag, due to the tightening nature of the consolidation.
⚠️ A weak or sloppy move before the Pennant weakens the signal and increases the risk of false breakouts.
🎯 Entry & Stop-Loss Strategy
📥 Entry: After a confirmed breakout above the Pennant’s resistance (or below it for bearish setups)
🛑 Stop-loss: Placed just below the last local low before breakout
💰 Profit Target:
Partial take profit at the top of the flagpole
Full target = the height of the flagpole projected from the breakout point (aka the Measured Move)
Always account for key support/resistance levels to define the potential range
💡 The Pennant often offers great risk/reward due to its tight structure and explosive potential.
💡 My Pro Tips for Trading Pennants
✅ Pennant Pattern Criteria
Trend continuation pattern
A strong, nearly vertical move preceding the Pennant
Triangle-shaped consolidation (two converging lines)
The Pennant body must be shorter than the flagpole
The lowest point of the Pennant should not exceed half the length of the flagpole
Breakouts should happen in the direction of the initial trend
Tight range before breakout increases accuracy
📈 What Strengthens the Signal
Sharp, clean, directional initial move (strong flagpole) ⚡
High volume on the initial move, and volume surge on breakout 💥
⚠️ What Weakens the Signal
Choppy or weak price action before the Pennant 🫤
Lack of volume during the flagpole or breakout 💤
✅ Examples of My Winning Pennant Setups
🔗 EURUSD Bearish Pennant — Ready to Drop
❌ Examples of My Losing Setups
🔗 XAUUSD Bullish Pennant — Failed Follow-through
💬 Do You Trade Pennants?
They’re one of the most powerful continuation patterns when paired with clean price action and volume confirmation. What’s your experience with Pennants? Share your wins — and fails — below 👇👇
Studyanalysis

Wedge Pattern: A Key to Trend Reversals and Continuations📈 Wedge Pattern: A Key to Trend Reversals and Continuations
A wedge pattern is a technical chart formation that signals a potential reversal or continuation in the market. It’s formed when price moves between two converging trendlines — either sloping upward or downward — creating a narrowing range over time.
There are two main types of wedge patterns:
🔻 Falling Wedge (Bullish)
Formed during a downtrend or as a correction in an uptrend.
Characterized by lower highs and lower lows, with the slope of the support line steeper than the resistance line.
Typically signals a bullish reversal as momentum builds for a breakout to the upside.
✅ Confirmation: Break above the resistance line with volume surge.
🔺 Rising Wedge (Bearish)
Appears during an uptrend or as a correction in a downtrend.
Shows higher highs and higher lows, but the support line is steeper than the resistance line.
Often leads to a bearish reversal, especially when volume declines into the pattern.
⚠️ Confirmation: Break below the support line with increasing volume.
🧠 Key Characteristics
Volume tends to decrease as the pattern forms, indicating a pause in momentum.
The breakout direction (up or down) determines whether it’s a continuation or reversal signal.
Wedges can appear on any time frame and are useful for both day traders and long-term investors.
📊 Trading Tip
Always wait for confirmation of the breakout before entering a trade. False breakouts can be common, especially in low-volume environments

EURUSD FORMED BEARISH PENNANT. THE PRICE IS READY TO DROP.EURUSD FORMED BEARISH PENNANT. THE PRICE IS READY TO DROP.
EURUSD has been trading sideways within the last day, showing lower highs and higher lows. Eventually, the price has formed the pennant chart pattern.
What is a pennant?
A pennant chart pattern is a short-term continuation pattern in technical analysis, resembling a small symmetrical triangle, formed after a strong price movement (flagpole). It consists of converging trendlines, indicating a brief consolidation before the trend resumes. Bullish pennants form after an uptrend, bearish pennants after a downtrend.
The price is expected to decline towards 1.14500 support level

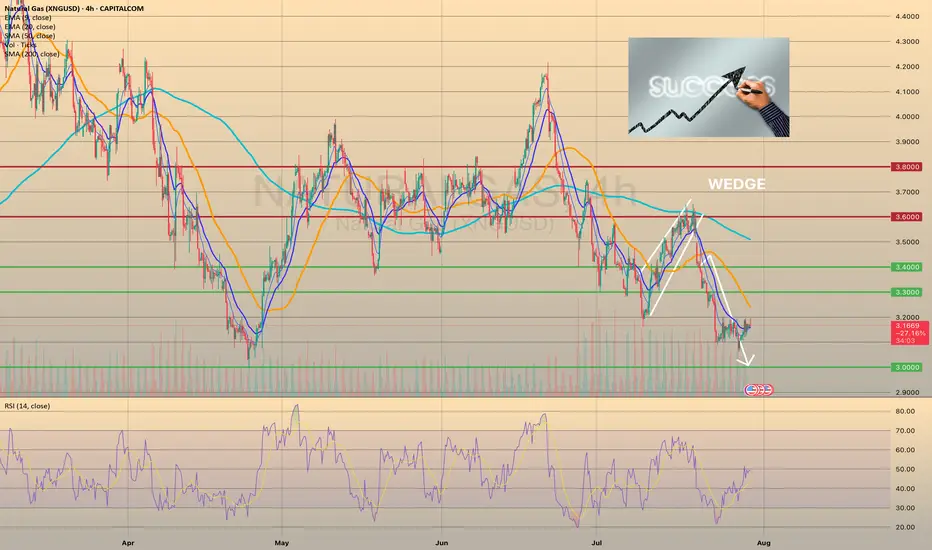
Wedge Pattern — A Key to Trend Movements📐 Wedge Pattern — A Key to Trend Movements 📈
🔍 Introduction
The Wedge is a chart pattern that represents a phase of directional consolidation following a trending move. It can act as a continuation 🔄 or a reversal 🔃 signal, depending on the context. The structure consists of two converging trendlines, both sloping in the same direction.
🧩 Pattern Description
Unlike the Flag pattern 🚩, the Wedge has no flagpole and doesn’t depend on the direction of the previous move. The direction of the wedge body determines its type:
A falling wedge ⬇️ is bullish 🟢 (buy signal)
A rising wedge ⬆️ is bearish 🔴 (sell signal)
The breakout is the key point to watch. The two trendlines slope in the same direction but at different angles, causing them to converge. This reflects a loss of momentum ⚠️ and typically indicates that buyers or sellers are preparing to take control.
This pattern can act as:
A continuation signal 🧭 — appearing at the end of a correction
A reversal signal 🔄 — forming at the end of a strong trend
📉 Volume is usually low during the wedge and rises on breakout. A low-volume breakout increases the risk of a false breakout ❗. Often, price retests the breakout level 🔁, giving traders a second chance to enter.
🎯 Entry & Stop-Loss Strategy
📥 Entry: On breakout confirmation
🛑 Stop-loss: Below the pattern’s low (bullish) or above its high (bearish), or under/above the most recent local swing point
🎯 Target: Project the height of the widest part of the wedge from the breakout point. Alternatively, use key price levels 📊 or a trailing stop 🔂 to lock in profits.
💡 My Pro Tips for Trading the Wedge
✅ Pattern Criteria
Two converging trendlines ➡️➕➡️
Clearly defined structure ✏️
Prior trending move before the wedge 🚀
Low volume within the wedge 📉, high volume on breakout 📈
Retest of breakout level = confirmation 🔁
🔥 Factors That Strengthen the Signal
Breakout on strong volume 📊💥
Appears after an extended trend 🧭📉📈
More touches = stronger pattern ✍️
Breakout occurs close to the apex 🎯
⚠️ Factors That Weaken the Signal
Low volume on breakout 😐
Poorly defined trendlines 🫥
Few touches on lines
Early breakout (too far from apex) ⏱️
No prior trend / appears in a range-bound market 📏
✅ Examples of My Successful Wedge Trades
📸
❌Examples of Failed Wedge Overview
💥
💬 Do you use the wedge pattern in your trading?
It’s a powerful pattern, especially when confirmed by volume and market structure. Share your favorite wedge setups or ask questions below 👇👇
prediction on VBL Strong support on right time with consolidation Long time but as per fundamental good pick

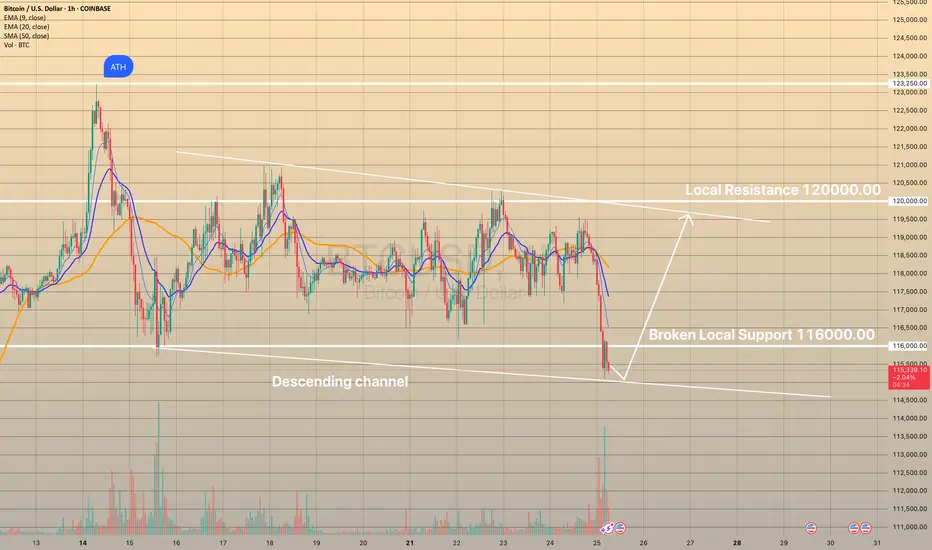
BTCUSD DROPPED BELOW LOCAL SUPPORTBTCUSD DROPPED BELOW LOCAL SUPPORT📉
Today bitcoin dropped below the level of 116,000.00 on high volume. However, the price didn't go somewhere far downwards and consolidates slightly below this level. Presumably, descending channel may be formed.
What is a descending channel?
A descending channel is a bearish chart pattern formed by two downward-sloping parallel trendlines connecting lower highs and lower lows in a pair’s price, indicating a consistent downtrend. It shows sellers are in control, with prices declining within a defined range.
Here I presume the price to rebound from lower border of the descending channel with possible movement towards upper border slightly below the 120,000.00 level.
EURUSD HOLDS BULLISH MOMENTUMEURUSD HOLDS BULLISH MOMENTUM📈
24 July I wrote about bearish divergence in EURUSD. Now we see that this resulted into decline towards sma200 on 30-m chart. Currently the price is rebounding from this moving average.
What is the sma200?
The sma200 is a technical indicator that calculates the average closing price of a forex pair or crypto over the past 200 trading periods. It’s used to identify long-term trends, smooth out short-term price fluctuations, and determine potential support or resistance levels.
There is high possibility that the price will continue its way towards local resistance of 1.18300.

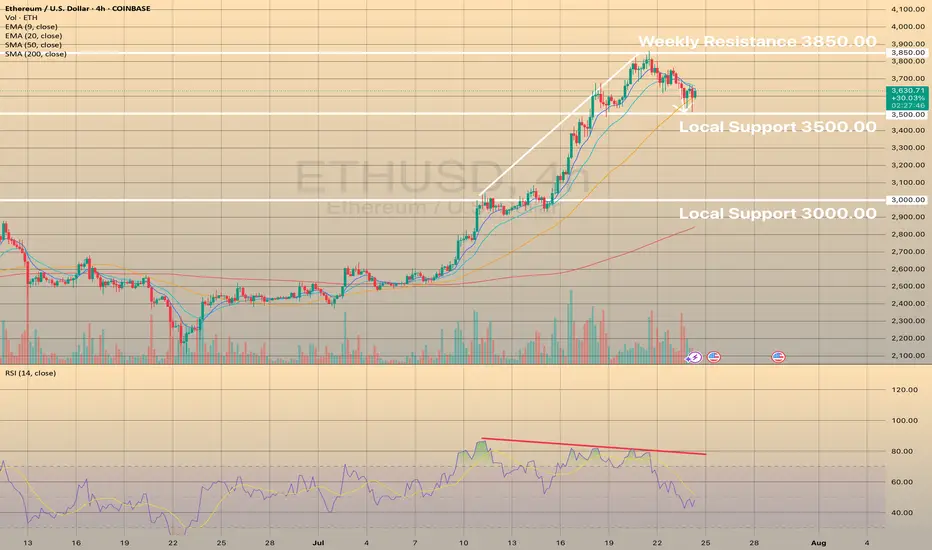
ETHUSD, XRPUSD - BEARISH DIVERGENCE SUCCESSFULLY WORKED OUT
ETHUSD, XRPUSD - BEARISH DIVERGENCE SUCCESSFULLY WORKED OUT
On these 2 graphs you may observe ethereum and ripple declining after strong bearish divergence showed up on both of these instruments. Here, the bearish divergence proved to be a success. In both cases the price has almost reached first targets: 3,500.00 for ETHUSD and 3.00000 for XRPUSD.
What will be next?
It looks like downwards correction still persists and we may observe some deeper than now decline with possible targets of 3,000.00 for the ETHUSD and 2.60000 for the XRPUSD.
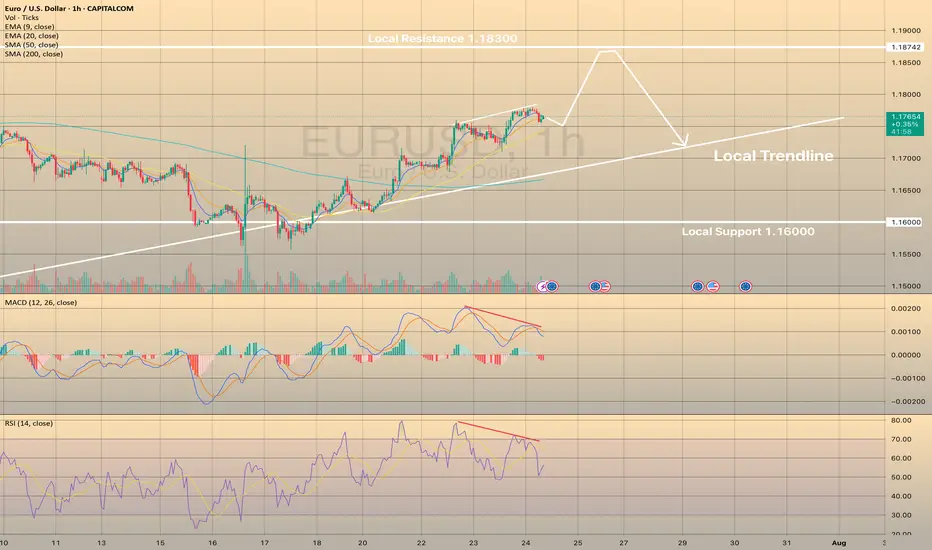
EURUSD IS ON ITS WAY TO LOCAL HIGHSEURUSD IS ON ITS WAY TO LOCAL HIGHS
EURUSD successfully rebounded from local support of 1.16000 and since then continues to rise towards local resistance of 1.18300. Recently the price has started to show the bearish divergence on RSI and Macd indicators. MACD went into the red zone.
What is the bearish divergence?
Bearish divergence is a technical analysis pattern where the price makes higher highs in an uptrend, but a momentum indicator (e.g., RSI, MACD) forms lower highs, signaling weakening bullish momentum and a potential downward reversal. To trade, identify the divergence in a clear uptrend with the indicator showing lower highs (e.g., RSI above 70). Sell or short when the price confirms a reversal (e.g., breaks below a support level or trendline) with increased volume. Set a stop-loss above the recent high. Target the next support level.
Generally speaking, it doesn't necessarily mean that EURUSD will drop immediately, the price may even grow a bit. However, it highlights some short opportunities.
BTCUSD LOST SHORT-TERM BULLISH POTENTIALBTCUSD LOST SHORT-TERM BULLISH POTENTIAL
Bitcoin has been trading sideways since July 15th within a range of 116,000.00-120,000.00. Indicators show no signs of a new bullish/bearish trend.
How to trade sideways movements or range?
It is better to wait for a price to come close to one of the levels (support or resistance), then open buy/sell order. Or just pace a limit order and wait. Take-profit may be above/below the support/resistance levels with a stop-loss behind these levels (below for the support and above for the resistance).
So, the price decline towards 116,000.00 is expected, where potentially the price may rebound once again.

$AINot financial advice.
NYSE:AI
Scenario #1
Break white line of wedge will confirm bull side.
Scenario #2
Fail to break wedge will go for a double bottom or lower.
Like and follow for more ideas.
Thanks.

Nifty today pre market views dated 27april2021Hi!, this is my personal study and analysis on nifty market( NSE ), Disclaimer : Consult your financial advisor before investing ...
These analysis expressed here is only for observation only...
As of now nifty is volatile but expected to see nifty at 14000 levels this week .... as data show ... my plan is to look for 14000 levels from higher zone as pattern shows down trend in near future . thanks for reading ... its pre-market analysis time 9:10 AM
