Stacks longStacks broke trough the descending trendline. Asset broke trough the resistance level. Bullish movement to resistance level at 0.98 is expected to happen.
STX

STX 4H BUYSTX 4H support is now at $0.72
Enter 50% at the current price
and try to set some BUY orders near the support zone
If STX stays above the trendline,
the Take-Profit target would be 5%, 10%, and 15% from your entry
Cheers

STX Long & Short Ideaeverything is explained on the chart, comment if you doubt anything.
STX will fly once it breaks out the trendline. however, be aware of losing the ascending bottoms..
you can flip short as we are heading to the week if ONLY it breaks down the SL mentioned on the chart.
feel free to share your thoughts!
GL ALL.

STX/USDT end of retracementTime to get back into STX. The very clear double bottom serves as confirmation of the trend reversal.
I'd expect it to move up rapidly from here, so unless and until there's any suggestion otherwise, knock yourself out.
STX : INCREASE VIEWSTX is in an uptrend at this moment on the last volume counting range.
We will follow STX coming time to see if it's able to gain
Stx Breaking Falling Wedge Seems like Ready another Bullish Move Breaking Falling wedge In H8 timeframe incase OF successful breakout expecting Move Towards 1.30$

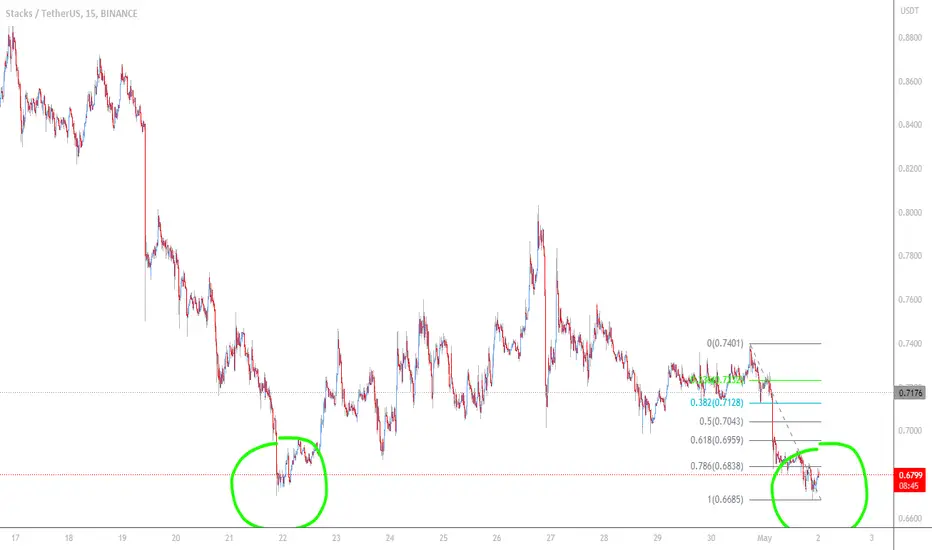
$STX: Anticipated Breakout; Divergence Signals, and Fib zones
On the daily, the RSI is within a symmetrical triangle, indicating an anticipated breakout by May 11.
It would be ideal if STX closes the daily candle above $0.82 today, as it aligns with my previous Fibonacci expectations, as indicated on my TradingView chart (link: ).
My divergence indicator shows a divergence based on the commodity channel index and identified support zones.
Being transparent, I cannot provide a clear guideline at the moment. While I lean towards quick upward price movement, there are multiple factors at play, and a broader perspective is needed. It all depends on the king (referring to Bitcoin), which is currently experiencing resistance at 30.4k and has corrected to the baseline of the Bollinger Bands. If it can establish a baseline there and continue its upward momentum to FWB:36K , we might see a bottom forming soon and some quick price developments.


STX- Stacks Possible position trade Good day, fellow traders
As you can see STX is in a nice position for a possible reversal and further upward movement. The position is favorable, with better management of risk reward.
A wave 5 is surely on the cards.
As always trade safe and nobody can see the order book.
P.S BTC movement will help or stall
Good luck and have Fun

stxusdtFor spot buying in two areas, with the specified loss limit. If you made the purchase in the first area, and you wanted to average, the second area and the second loss limit will be activated.

Stx | Breaking Out Falling Wedge Stxusdt
Breaking Out Falling Wedge Pattern in 4H Timeframe
In the event of a successful breakout and retest, we anticipate a 30-50% bullish move.Once confirmed, we will wait for a retest of the breakout level to establish support before entering a long position. Our target for this trade will be set at a 30-50% move to the upside. Risk management measures will be put in place to mitigate any potential losses.
Please keep in mind that our ideas are based on our experience and knowledge, and may not be completely accurate as the market is always unpredictable and anything can happen at any time. It is essential to conduct your own research and use your own knowledge when trading. If you are happy with our work, join us

STX price action finding support on the 4hr 200maSTX posted 4-9-23 +14% gains ... so far
here is another entry idea ( if you missed it ) or to add to entry ( scaling into the trade )
on 4-9-23 hidden bearish div played out and support bounce off of yellow dotted line played out
wait for break of 1.0156 with volume confirmation for entry / or retest of 1.0156
price action finding support on the 4hr 200ma
if price action ( PA ) pulls back and bounces of blue trendline , this would be a nice entry
Market Cap: 1.3B
Category: DeFi / Metaverse
Target 1: 1.2223
Target 2: 1.3965
Target 3: 1.5420
Stop Loss: 0.8475
Manage Risk - have a stop loss in place
Not Financial Advice
This is for Entertainment Only

STACKS - Unstoppable One of my favorites and a reliable choice for a very good 3 successful trades.
If you are not aware of what STACKS is you should def look into it as it has immense potential going forward.
STX is a Bitcoin layer for smart contracts
What Is Stacks (STX)?
Stacks is a Bitcoin Layer for smart contracts; it enables smart contracts and decentralized applications to use Bitcoin as an asset and settle transactions on the Bitcoin blockchain.
Bitcoin is the largest, most valuable, and most durable decentralized asset. The Stacks layer unlocks $500B in BTC capital using the Bitcoin L1 as settlement for decentralized applications.
Stacks has knowledge of the full Bitcoin state, thanks to its Proof of Transfer consensus and Clarity language, enabling it to read from Bitcoin at any time.
All transactions on the Stacks layer are automatically hashed and settled on the Bitcoin L1. Stacks blocks are secured by 100% Bitcoin hashpower. In order to re-order Stacks blocks/transactions, an attacker would have to reorg Bitcoin.
My spot holding have grown from 20 cents to almost x5 and the leveraged trades went even better...
Only Bullish on this one as i see 10-18 range for the next 2 years.
One Love,
The FXPROFESSOR

Stx Looks Ready for Bullish impulse Seems Like ready for bullish impulse
Falling wedge Breakout has already confirmed expecting 40 to 45% bullish Move

Where Will the Pullback on STX End?Stacks (STX) has been one of the best-performing coins on the market this year. The token soared by nearly 500% from January 1st to its high of $1.31 only 18 days ago. However, like most cryptocurrencies, STX is now experiencing a pullback. In this analysis, we'll take a closer look at what's happening with STX and what investors can expect in the coming weeks.
What is STX? Stacks is a Bitcoin layer for smart contracts, allowing decentralized applications to use Bitcoin as an asset and settle transactions on the Bitcoin blockchain. It unlocks $500B in BTC capital and has knowledge of the full Bitcoin state, with transactions automatically hashed and settled on the Bitcoin L1. Stacks blocks are secured by 100% Bitcoin hashpower, making it difficult for hackers to re-order transactions.
STX managed to break above the $1.00 resistance level that was previously identified in our analysis. However, it was unable to hold the price above this key level, so now it's coming back down. STX’s inability to sustain its price above resistance may indicate that the price level was too high for the market at the moment to sustain.
Where does the pullback end?
While STX is going through a pullback, the 100 Simple Moving Average (SMA) may halt the downturn. The 100 SMA acts as mobile support, preventing the price from falling below it in most cases. If the 100 SMA breaks, the next support level is around $0.50.
It's essential to remember that the current pullback is a normal occurrence in the cryptocurrency market. After massive gains, most cryptocurrencies tend to experience a correction. Typically, coins that start a bull run strongly are the ones that advance the most overall. As such, investors should keep an eye on STX for the potential for another bull run coming in 2024-2025.
Bottom Line: Stacks (STX) has been a high-performing cryptocurrency this year, but like all cryptocurrencies, it's experiencing a pullback. However, this is a normal occurrence in the crypto market, and investors should keep a close eye on the support levels and moving averages.

STX time to fly "Long", looks very pureHello there...
what we see hre in STX that the price over the bottom trendline, and we will get profits atleast 40% withen next few weeks, so thunk and becarfull before you start open position,
trade save and good luck


#STXA long position can be used to pullback to the upward trend line and complete the head and shoulder pattern, as well as forming a stop in the current range.

STX/USDTSTX is starting to look like it will break down soon.
It already broke down from the distribution range and now I'm expecting expansion.
It held up pretty well last few weeks, so I'm expect it will go down pretty hard when panic steps in.
My main target is at $0.345. Will sell and compound on the way down.

#STXSuspect of forming a head and shoulders pattern to complete the pullback. It can be a corrective wave 2 for the ascending wave 3 and complete the pattern

Deviated above nasty bearish weekly candle $0.6 to be tested in coming weeks, I keep the chart simple, no complex chart even kids can read it

#STX Diagonal Ending PatternIt is moving according to the daily analysis provided. The diagonal ending pattern is broken and pulling back. The range of 1.062 should be considered for breaking the structure and short position.

Located in an important volume profile sectionHello?
Traders, welcome.
If you "Follow", you can always get new information quickly.
Please also click "Boost".
Have a good day.
-------------------------------------
(STXUSDT chart)
The key is whether it can be supported around 0.8395-0.9983.
If it is supported in the 0.8395-0.9983 interval,
1st: 1.5327
2nd: 2.0316
It is expected to rise around the 1st and 2nd.
but,
Looking at the 1W chart, since the 1.2520 point has been serving as support and resistance for a long time, we need to see if we can break through this point upwards.
If it falls below 0.8395,
1st: 0.6560
2nd: 0.4010
You need to check if it is supported in the vicinity of the 1st and 2nd order.
The current price level is in the important support and resistance zone, so if it moves sideways in this zone, it is important whether the HA-High indicator on the 1W or 1M chart is created by a decline.
-------------------------------------------------- -------------------------------------------
** All descriptions are for reference only and do not guarantee profit or loss in investment.
** Even if you know other people's know-how, it takes a considerable period of time to make it your own.
** This is a chart created with my know-how.
---------------------------------
