STX DOUBLE PLAY - Preparing for anythingcurrent entry is at 1.0977
took profit already so now letting the rest ride. if it breaks and retests then ill add more.
if it breaks, false brekout, ill open up a small margin short and then see what happens
playing both sides
what is your plan?
STX

✴️ Stacks To Hit New All-Time High?If Stacks goes to a new All-Time High it is likely that the other Altcoins will do the same.
Why do I mention this?
Because of the volume... Look at the incredibly high volume.
Is all this buying just to sell in a few days?
Or likely whales loading up knowing something we don't know?
We do know the market is set to grow, we just don't know by how much.
Still, this is really high volume.
Be prepare for anything and everything.
Just as thing can get really bad out of nowhere, by surprise, things can also get really good out of nowhere, by surprise.
Just think Covid, we were all really happy an then the pandemic hit.
Now, something else might show up...
Yes the banks are burning but out of the ashes something good might be borne.
Namaste.
STX: Resistance BreakoutTrade setup : Price bounced off of $0.60 support and broke above $1.05 resistance where it got rejected in February. That indicates that buyers are still in control and price resumed its Uptrend. Next major resistance is around $1.75 and then $2.75.
Trend : Uptrend across all time horizons (Short- Medium- and Long-Term).
Momentum is Bullish ( MACD Line is above MACD Signal Line and RSI is above 55).
Support and Resistance : Nearest Support Zone is $0.60, then $0.40. The nearest Resistance Zone is $1.05, which it broke.

✳️ Bullish Continuation = Bullish Confirmation | Stacks New HighSTXBTC (Stacks) hit a peak in late February to end a 285% bullish wave.
We would normally expect a correction at this point as usual but no.
The week late Feb. closed as a shooting star, a bearish candlestick pattern which was followed by a hammer.
So prices did move lower but all losses were quickly recovered and STXBTC managed to close green, after green and now... Continues green.
A new week and a new high is being hit.
A very strong bullish continuation.
This is not bear market type of action.
Bullish continuation = bullish confirmation.
Cryptocurrency is in a long-term growth path no doubt about that.
We have higher lows since early 2020 and we will continue to experience higher lows and higher highs, for years to come.
Namaste.

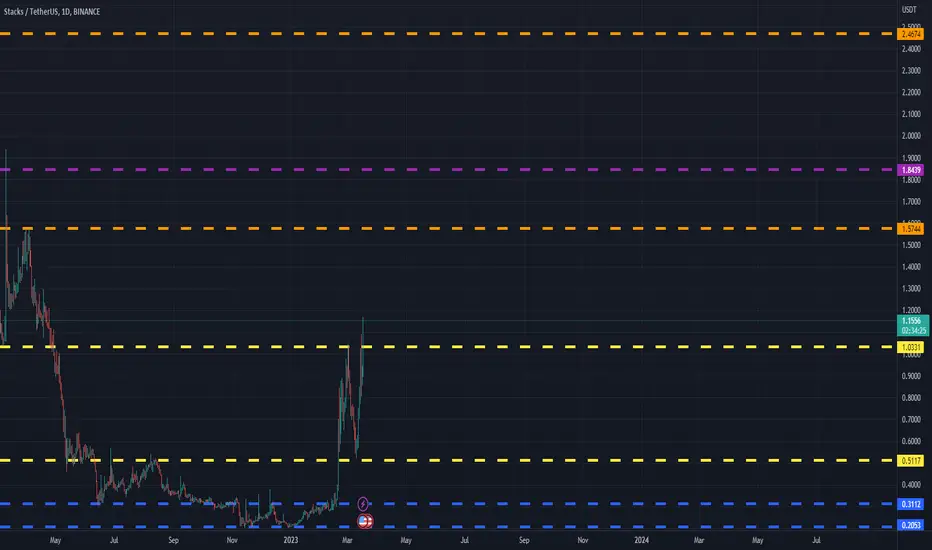
STXUSDT(Stacks) Daily tf Range Updated till 18-03-23STXUSDT(Stacks) Daily timeframe range. it got some good volume now trying for a clean break above #1.0331. its 3rd attempt here, a close above open a space till #1.5744 but need to keep at this buying power or back to lower levels.
STX POTENTIAL 15% SHORTprice rising on low volume
money flow is decreasing while price decreases
idk what else to think but for it to retest Weekly High

STX: Approaching ResistanceTrade setup : Price bounced off of $0.60 support and is again trying to break above $1.05 resistance where it got rejected in February. Wait for price to either 1) break and close above $1.05 to resume uptrend, or 2) pull back near $0.60 support for another swing entry. Fibonacci retracement levels (potential support) are $0.73 (38.2%) and $0.63 (50%).
Trend : Uptrend across all time horizons (Short- Medium- and Long-Term).
Momentum is Bullish ( MACD Line is above MACD Signal Line and RSI is above 55).
Support and Resistance : Nearest Support Zone is $0.60, then $0.40. The nearest Resistance Zone is $1.05, which it broke.

stx short ideastx short target is in above risk to reward
stx money flow over bought and rsi also over bought .
on daily bearish divergence


STXUSD Strong rebound on MA50 (1d). 1.7500 targeted.STXUSD is rebounding on the MA50 (1d) and Support (1) after a rejection 2 weeks ago near Fibonacci 0.618.
Golden Cross already completed 3 weeks ago.
Trading Plan:
1. Buy on the current market price.
Targets:
1. 1.75000 (under Fibonacci 0.786 and Resistance 2).
Tips:
1. RSI (1d) is on a Rising Support. It has accurately caught all three bottom buys.
Please like, follow and comment!!

STX: Pullback in UptrendTrade setup : After sizeable gains (~400% YTD 2023), price was met with selling pressure around $1.05 resistance area. Pullback near $0.60 support could be a swing entry. Momentum (MACD Histogram) has also inflected bullish again. Fibonacci retracement levels (potential support) are $0.73 (38.2%) and $0.63 (50%).
Trend : Neutral on Short-Term basis and Uptrend on Medium- and Long-Term basis.
Momentum is Mixed as MACD Line is below MACD Signal Line (Bearish) but RSI ~ 50 (Neutral).
Support and Resistance : Nearest Support Zone is $0.60, then $0.40. The nearest Resistance Zone is $1.05.

$STX/USDT 2h (#Bybit) Rising wedge breakdown and retestStacks seems locally topped here and a retracement down to 100EMA would make sense.
⚡️⚡️ #STX/USDT ⚡️⚡️
Exchanges: ByBit USDT
Signal Type: Regular (Short)
Leverage: Isolated (3.0X)
Amount: 5.0%
Current Price:
0.94020
Entry Targets:
1) 0.95080
Take-Profit Targets:
1) 0.76145
Stop Targets:
1) 1.07745
Published By: @Zblaba
$STX #STXUSDT #Stacks #PoX
Risk/Reward= 1:1.5
Expected Profit= +59.7%
Possible Loss= -40.0%
www.stacks.co

Stacks STX price predictionThis is what I see, I drew the big wave, I skipped small waves
thxxxxxxxxxxxxxxxxxxx


STX: Approaching SupportTrade setup : After sizeable gains (~400% YTD 2023), price was met with selling pressure around $1.05 resistance area. Now we wait for price to find support level and for momentum to inflect bullish again (MACD Histogram rising). Fibonacci retracement levels (potential support) are $0.73 (38.2%), $0.63 (50%), and $0.63 (78.6%).
Trend : Neutral on Short-Term basis and Uptrend on Medium- and Long-Term basis.
Momentum is Mixed as MACD Line is below MACD Signal Line (Bearish) but RSI > 55 (Bullish).
Support and Resistance : Nearest Support Zone is $0.80, which it broke, then $0.60, and $0.40. The nearest Resistance Zone is $1.05.

STX 8X POTENTIAL LONG SCALP - 30MIN
CIPHER makes a higher high
AO in the green
1% risk, 8% gain potential

✴️ This Isn't Over... 425% Is Just The Beginning!Let's go back to Stacks because I already showed you literally hundreds of different charts and there is no point in looking for new ones, more opportunities available than the ones that we can take.
This will give further strength to our bullish position.
First, notice the ultra-high volume.
This tells us that things are only getting started.
The RSI goes super high just as it happened in August 2020.
The MACD enters the bullish moving north for the first time ever.
We have a long-term higher low.
A higher high is possible next.
Above $4 is the potential... More or less!
Projection for new All-Time Highs in 2024 for the Altcoins or 2025.
And 2025 for Bitcoin.
We are still early even after 425% of growth.
People will be joining months for now, years from now...
By the time retail buying, traders will be selling.
That's the great advantage of reading this, of being here, now!
Namaste.

The Altcoins Bull Market | Proof In The NumbersHere we have Stacks, STXBTC, producing some serious growth, some really nice numbers.
This is bull-market type of action; let me explain.
From early January to 20-February STXBTC grew by 200%.
In a bear market, this type of move would happen much faster in the form of a short-squeeze.
As soon as the peak is hit, we would immediately see a major crash that would lead to a lower low.
Currently, after 20-Feb. we have little consolidation followed by additional growth.
STXBTC is hitting new highs, including a new high today for a total of 285% since the last low.
The more it grows...
The longer this bullish wave continues, the stronger the upcoming higher low.
This is bull-market type of action.
Based on what we are seeing now, when the major correction comes we will end up with a higher low.
Higher highs and higher lows... That's bull-market action.
It has been happening for a while now.
Adapt and change.
There is room for additional growth.
Namaste.

1-Hour Order Block and Market Structure Break for $STXIt's a high probability setup with a decent return.

STXUSD Extremely high potential after 1D Golden Cross.Stacks (STXUSD) is on an amazing parabolic rally, having broken above its 1W MA50 (red trend-line). On top of that, the 1D MA50 (blue trend-line) and the 1D MA200 (orange trend-line) formed the Golden Cross, a technically very bullish formation for the long-term.
With the 1D RSI though hitting 90.00 (extremely overbought levels) and the price filling the 0.5 Fibonacci retracement level, it is more probable technically to witness a pull-back and medium-term sideways trading until the 1D MA50 at least makes contact. We are buying either on this pull-back or if the price breaks above the 0.618 Fibonacci first. The Channel Fibs draw an additional Channel framework to work within. Our target by the end of June is the 0.786 Channel Fib, at at least 2.5500.
-------------------------------------------------------------------------------
** Please LIKE 👍, FOLLOW ✅, SHARE 🙌 and COMMENT ✍ if you enjoy this idea! Also share your ideas and charts in the comments section below! **
-------------------------------------------------------------------------------
💸💸💸💸💸💸
👇 👇 👇 👇 👇 👇

STX/USDT headed to $1.00+ STX/USDT is headed to a psychological $1 (I think).
Note the Purple Candles by Sam indicator (purple candles). The indicator is here on TradingView.
Have a trailing take profit just before $1 - as it might run past that.
Squeeze indicator looking strong and DI/ADX is turning up.

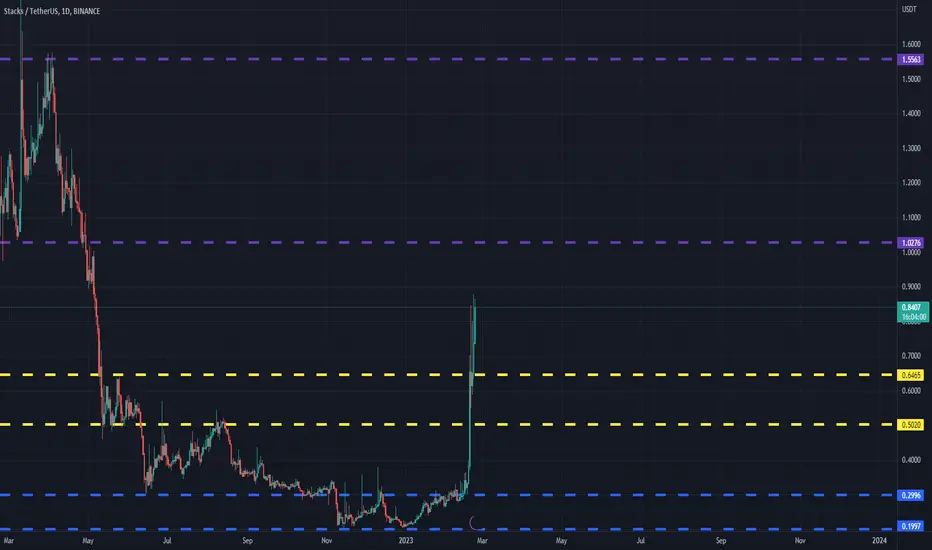
STXUSDT(Stacks) Daily tf Range Updated till 23-02-23STXUSDT(Stacks) Daily timeframe range. from its local low it retraced back to 320%+ thats actually quite insane. it needs little bit more volume to push toward 1.0276#. after that it got midrange which is 1.300#.but that depends how retail interest keeps up.
STX is at resistance again.Blockstack PBC, a software business that seeks to establish a decentralized internet, developed the cryptocurrency STX. The native coin of the Blockstack network, which employs a particular blockchain created to support safe, decentralized apps, is called STX.
The Blockstack ecosystem, which includes the Stacks blockchain and the decentralized apps developed on top of it, is powered by STX. STX is a key component of Blockstack's vision of a user-centric internet where people control their data and identities.
Within the Blockstack ecosystem, STX may be utilized for several things, including:
Using the Stacks blockchain and paying transaction costs
Participating in the Blockstack consensus method through stake
By rewarding users for contributing to the network and participating in governance procedures, the network can encourage developers to create new decentralized apps.
There are two support levels on the way down, and two resistance zones on the way up. One of the resistance levels is very strong and can push the price down for now.
Let me know if you guys have any questions;
I will be more than happy to help.
Good luck, and thank you.
