Stacks Crypto Breakout: Must-Watch Resistance and Support LevelsBINANCE:STXUSDT has shown notable upward momentum in recent trading sessions, with closing prices rising consistently. Closing prices have progressed from $1.508 to $1.65, indicating a strong bullish trend. Meanwhile, the 9 Exponential Moving Average (EMA) is currently at $1.5437, while the 20 EMA stands at $1.4816. The positioning of these EMAs suggests that the shorter-term trend is outpacing the longer-term trend, reinforcing the bullish sentiment.
Concurrently, the Moving Average Convergence Divergence (MACD) further supports this bullish outlook. The MACD line has remained above the signal line, with the histogram displaying positive values, highlighting strong upward momentum. Currently, the MACD histogram is at 0.0316, reflecting increasing buying pressure.
Relative Strength Index (RSI) values have surged from 64.65 to 77.09, indicating that STX is approaching overbought territory. This suggests that while the bullish trend is strong, traders should be cautious of potential pullbacks or consolidation phases.
Key levels to watch include immediate resistance at $1.657. A breakout above this level could propel the Stacks crypto price towards the next resistance points at $1.675 and $1.69. These levels are critical, as a successful breach could signal continued upward movement and potentially attract more buyers.
On the downside, support levels are observed at $1.635 and $1.621. Should the price retrace, these levels could provide strong buying opportunities. A further drop might see support at $1.605, which could be crucial in maintaining the overall bullish structure.
For traders looking to capitalize on this trend, potential entry points for long positions could be around the support levels at $1.635 and $1.621, with exit targets set near the resistance levels at $1.675 and $1.69. Conversely, short traders might consider entries near the resistance levels, with exit targets at the immediate support zones to capture potential pullbacks.
In conclusion, the technical indicators for STX on the 4-hour chart exhibit a predominantly bullish outlook. Traders should monitor key resistance and support levels for potential entry and exit points to maximize their trading strategies.
STX

STX Daily Analysis: Anticipating a Breakout📅 Let's dive into today's analysis in the crypto market. Today's coin is STX, one of the coins that gave significant returns during Bitcoin's surge from 16k to 73k. We won't analyze Bitcoin today since I will provide a complete analysis of Bitcoin tomorrow.
🔍 Analysis of STX
Project Overview
STX is a layer-2 solution for Bitcoin, similar to other layer-2 solutions, it increases network speed and reduces transaction fees. Additionally, STX provides infrastructure on the Bitcoin network for building decentralized applications (DAPPs). Many well-known DAPP projects use this platform and protocol for their infrastructure.
🎲 Chart Analysis
The analysis is conducted in the daily time frame. As you can see, STX had a powerful upward trend and, after reaching the resistance of 3.686 and concurrently with Bitcoin reaching its peak of 73k, it started to retrace. This retracement has been marked by a curved trendline and a trendline from the price bottom, leading the price down to the 1.316 area.
🧩 Key Support Level
The support level at 1.316 is quite strong. It is significant not only from a price action perspective but also because it coincides with the 0.5 Fibonacci level, adding to its importance.
📊 Volume Analysis
During the last upward wave from 1.316 to 3.686, the volume of green candles began to decrease, indicating a weakening trend that was visible on the chart. After this, and during the correction phase down to 1.316, the volume continued to decrease, suggesting that traders did not engage in buying within the range of 1.316 to 3.686. This indicates that the resistance at 3.686 is not very strong, and the price is likely to test this area again.
🧲 Trendlines and Breakout Scenarios
The trendlines that have brought the price down from 3.686 to 1.316 are nearing their end. The price will soon break either the upper or lower trendline. If the curved trendline is broken and its trigger is activated, the price could rise back to the 3.686 peak with a significant influx of buying volume. Conversely, if the trendline from the price bottom is broken, there are two potential scenarios:
If selling volume enters the market and Bitcoin loses its 55k support, we can expect a strong bearish momentum. Breaking the 33.44 support on the RSI can confirm this momentum entering the market.
If the trendline is broken but Bitcoin maintains its support and selling volume does not enter the market, we might see the bearish trend exhaust, and the price could move back above the 1.316 support level.
💥 Bitcoin's Influence
The reason Bitcoin's support and resistance are crucial for this coin's movement is that STX is a layer-2 solution for Bitcoin. Layer-2 projects generally have a high correlation with their primary projects. Additionally, with Bitcoin's dominance at 54%, Bitcoin naturally influences all altcoins, especially one that serves as a layer-2 solution for Bitcoin.
🛒 Buying Strategy in Spot
The safest trigger for buying this coin in the spot market is 3.686, which is the all-time high (ATH) for this coin. If the price stabilizes above this level, it could move towards new targets. However, this trigger is 130% away from the current market price, which is quite a distance. Until the price reaches 3.686, there are other triggers that, upon stabilizing above these levels, the price could move upwards. Naturally, these triggers are riskier than 3.686, and the probability of hitting a stop loss is higher. The first trigger is 1.801, which is the peak of the Low Wave Cycle (LWC). Since the price is in a High Wave Cycle (HWC) uptrend, you can consider entering in the LWC. The next trigger for buying is 2.422, which is the MWC resistance. After breaking and stabilizing above this area, we can move towards the 3.686 peak.
📝 Conclusion
STX, a layer-2 solution for Bitcoin, is currently at a critical support level of 1.316, which is significant both in price action and Fibonacci terms. With decreasing volume indicating a potential test of the 3.686 resistance level again, traders should watch for key breakouts and Bitcoin's influence on the market. Considering the triggers and support levels mentioned, strategic entries can be made with proper risk management.
🧠💼 Always remember that trading futures involves inherent risks, and improper risk management can lead to margin calls. Stick to your capital management principles and use stop-loss orders, aiming for an initial risk-to-reward ratio of 2.
🫶 If you found this analysis helpful and want to support me, please like and share this analysis. Feel free to leave your comments or suggest a coin you'd like me to analyze next.

STX ANALYSISSTX's bearish structure is well visible
We have liquidity pools at the bottom of the chart.
We have a supply range that we considered as a POI.
If the price reaches this supply, we will look for sell/short positions
We will also look for buy/long positions in the demand range.
Closing a daily candle above the invalidation level will violate the analysis
Note that the financial market is risky, so:
Do not enter a position without setting a stop and capital management and confirmation and trigger.
When we reach the first TP, save some profit and try to move the stop continuously in the direction of your profit.
If you have any comments please post them, comments will help us improve our performance
Thanks

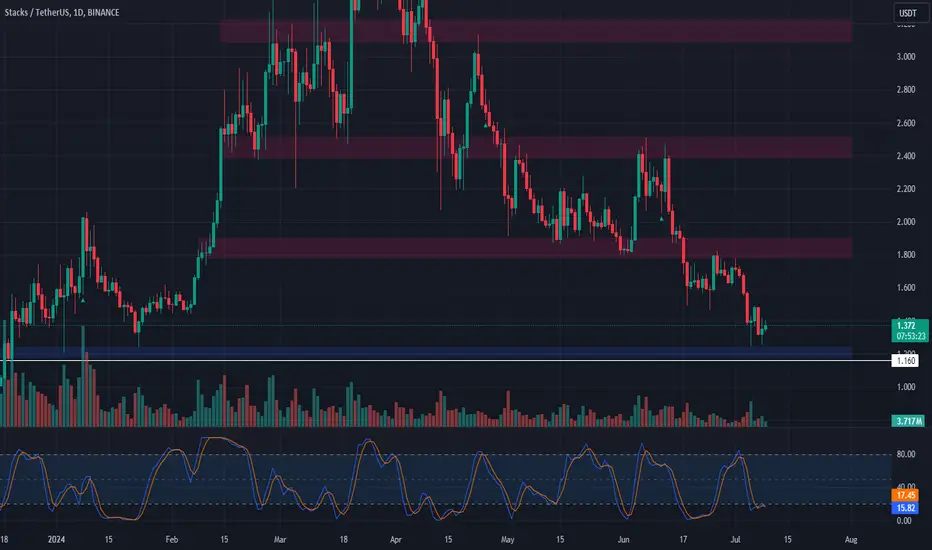
Trade Setup: STX Double Bottom FormationMarket Context:
STX has shown a significant rally of 200% the last time it touched this support level. With the price forming a double bottom and BTC expected to rally, this presents an opportunity for both a spot position and a shorter-term trade.
Trade Setup:
Entry: Enter a trade at $1.37.
Take Profit: Set profit targets at $1.80 and $1.98.
Stop Loss: Place the stop loss at $1.16 (on a daily close).
📊 Monitor BTC's performance closely and adjust your strategy as needed! #STX #CryptoTrading #DoubleBottomFormation 🎯
STX buy setupWe already caught good swings from STX.
Now we have determined the best demand range on the chart. We will look for buy/long positions in this range.
If the price reaches the green range, we will enter the position
Closing a daily candle below the invalidation level will violate the analysis.
For risk management, please don't forget stop loss and capital management
Comment if you have any questions
Thank You

Time to scale in.... STXRetracement is near completion. BTC sweeping the lows @ 58k. I could still see 1.25 in play for #STX but now would be a good time to stock up on STX while its on sale. Im targeting a couple levels between 5.50 and 10.00 with a mid point around 7.00 Again just my thoughts
Lets stack up on Stacks.....

Alikze »» SOL |Corrective leg C scenario🔍 Technical analysis: Corrective leg C scenario
- In the weekly time frame, wave 5 continued up to the 2.618 Fibo area.
-After that, it entered a combined cycle correction. According to the selling pressure candle in the supply area in time 1W, it can be considered that the upward corrective wave B has ended.
- In the analysis of the previous post, the details of the corrections in the weekly time frame have been reviewed.
- After the instability above the PRZ zone, the correction extended to the green box and the size of the Fibo 1.618 of the previous wave.
Due to the completion of the short-term structural reform, this demand can extend to the supply area after retesting the areas.
Therefore, any upward correction will continue until it breaks the supply zone and can retest the second green box of the liquidity zone.
- If this correction ends flat or if wave C is completed higher than wave A, the correction process can end.
- Otherwise, the minimum correction will continue up to the $100 range.
💎 Possible scenario: we should witness an upward correction, and if the supply zone does not break, after that, it should be faced with selling pressure, which can extend and stretch the correction leg C to the $100 range.
💎 In addition, if the supply area of break and above stabilizes, the bearish scenario ends and needs to be re-examined and updated.
🛑 Resistances: 150 - 163 - 175
🟩 Support: 100-113-125
»»»«««»»»«««»»»«««
Please support this idea with a LIKE and COMMENT if you find it useful and Click "Follow" on our profile if you'd like these trade ideas delivered straight to your email in the future.
Thanks for your continued support.
Best Regards,❤️
Alikze.
»»»«««»»»«««»»»«««

STX: Approaching ResistanceTrade setup : Price is in a downtrend, trading below its 200-day moving average. It's also broke below $2.00 support and made a Lower Low, which is also a sign of a downtrend. Price needs to break back above those key levels to resume it's uptrend. Stacks (STX) is a platform for scaling and building on top of Bitcoin. Read our research report.
Pattern : Price is Approaching Support , which is a level where it could pause or reverse its recent decline, at least temporarily. Support is often a level where price has bounced up in the past, or potentially prior Resistance level that was broken. (concept known as polarity). Once price breaks below support, it can move lower to the next support level. Learn to trade key levels in Lesson 7.
Trend : Short-term trend is Down, Medium-term trend is Strong Down and Long-term trend is Strong Down.
Momentum : Price is neither overbought nor oversold currently, based on RSI-14 levels (RSI > 30 and RSI < 70).
Support and Resistance : Nearest Support Zone is $1.50, then $1.30. Nearest Resistance Zone is $2.00, then $2.50.

STX/USDT Chart UpdateHello everyone, I’m Cryptorphic.
For the past seven years, I’ve been sharing insightful charts and analysis.
Follow me for:
~ Unbiased analyses on trending altcoins.
~ Identifying altcoins with 10x-50x potential.
~ Futures trade setups.
~ Daily updates on Bitcoin and Ethereum.
~ High time frame (HTF) market bottom and top calls.
~ Short-term market movements.
~ Charts supported by critical fundamentals.
Now, let’s dive into this chart analysis:
#STX/USDT is currently experiencing a correction within a larger bullish trend. The price is likely to continue if STX fails to hold the initial support level at $1.7.
Key Observations:
~ Initial Support: The price has an initial support level of $1.7, as highlighted in the chart.
~ High Liquidity Range with Strong Support: A significant support zone is identified between $1 to $1.2. This range is marked with a green rectangle and is noted for its high liquidity and strong support characteristics.
~ Moving Average: The 100EMA is an initial resistance for STX. A breakout above it will likely trigger the bullish trend and a rejection will continue the correction phase.
~ Projected Price Movement: The chart projects a potential price drop towards the high liquidity range, suggesting a dip to around $1 to $1.2 before a strong rebound.
After reaching the support zone, a bullish reversal is expected, with the price potentially aiming for the upper boundary of the channel, targeting around $7.
Best Entry: $1 to $1.2.
Targets:
T1- $2.42
T2- $3.53
T3- $4.38
T4- $5.74
T5- $6.82
DYOR. NFA.
Please hit the like button to support my content and share your thoughts in the comment section. Feel free to request any chart analysis you’d like to see!
Thank you!
#PEACE

Moving towards the top of the channelThe trend is bullish in the current timeframe, but overall it is ranging. There is an ascending channel where STX is fluctuating, showing good volatility.
The scenario involves moving towards the top of the channel, and we can aim for this movement with strong confirmations.

Alikze »» LPT | Pullback to the broken ceiling🔍 Technical analysis: Pullback to the broken ceiling
- In the 4H, 8H time frames, it is moving in an ascending channel.
- It is currently in the middle of the channel above the green support box area.
If it stabilizes above this area, it can continue up to the supply area and the ceiling of the growth channel.
💎 Alternative scenario: If the green box is broken, it can have a correction to the bottom of the channel with targets of 20.36 and then 18.75.
»»»«««»»»«««»»»«««
Please support this idea with a LIKE and COMMENT if you find it useful and Click "Follow" on our profile if you'd like these trade ideas delivered straight to your email in the future.
Thanks for your continued support.
Sincerely.❤️
»»»«««»»»«««»»»«««

STX Price AnalysisThe STX/USDT daily chart presents a comprehensive look at the current market dynamics, indicating significant levels of support and resistance, as well as a falling wedge that has been broken out and in play since April.
After breakout from the falling wedge the price pumped 25% and rejected from a blue zone at $2.441 multiple times, after a pullback price now near weekly support zone (Green) at $1.726 - $1.833.
If the price bounced back from the green zone and trend line after a confirm retest we could see a massive pull back and it will form a new highs.That’s a bullish scenario.
In a bearish scenario, if a green zone did not holds the price of STX we could see it to test the next levels and finally the yellow zone at $1.162 - $1.282.
If the price reached the yellow zone that is the best place for loading our bags.
According to our analysis we are in favor of the price will bounce back from the green zone and trend line after retesting.
Remember, always use stop loss to secure your funds.

STX Long Trade SetupCurrent Situation:
Trend: STX has been in a downtrend since April 2nd but recently experienced a change of character (CHOC) after retesting the 0.618 Fibonacci level.
200-day EMA: This is an important level to watch, marked by the red line on the chart.
Trade Strategy:
Entry Criteria:
Support Confirmation: Watch the price action around the 200-day EMA to confirm it flips from resistance to support.
Entry Point: Enter a long position at $2.
Take Profit Targets:
Primary Target: $2.50
Secondary Target: $3.00
Stop Loss: Set a stop loss at a daily close below $1.80 to manage risk.
Summary:
For STX, after experiencing a change of character and forming a higher high, look for a higher low in the discovery phase. Enter a long position at $2, targeting $2.50 and $3.00 for profits. Watch the 200-day EMA for support confirmation and set a stop loss at a daily close below $1.80 to limit potential losses.

STX StructureOur market structure indicator is showing a new bullish trend on STX after a 50% pullback. One of the better looking altcoin setups in the market.

Potential for another decline towards the lower boundarySTX is currently in a ranging trend, though it exhibits a tendency towards more downward movements. The price action is confined within a large descending channel. Recently, STX reached the upper boundary of this channel after an extended period of consolidation near the lower boundary.

#STX/USDT#STX
The price is moving within a descending channel pattern on the 12-hour frame, which is a retracement pattern
We have a bounce from a green support area at 1.80
We have a tendency to stabilize above the Moving Average 100
We have a downtrend on the RSI indicator that supports the rise and gives greater momentum
Entry price 1.84
The first goal is 2.20
The second goal is 2.45
The third goal is 2.70

(STX) Stacks "long running trend"The trend lines on Stacks have not crossed for a long time, about a half a year. Image indicator offers a view of no red line connecting the moving average lines. blue dotted lines representing time on a floating axis to replicate those pesky triangles people draw only these triangles are based on the information inside the chart. I draw the dashed lines previously and have those lines matched up with the indicator.

Alikze »»STX | Ascending channel 1HIn time 1H, it is moving in an ascending channel.
💎 The last bullish leg after an unsuccessful break in the supply area of the previous wave has been corrected, which has extended to the green box.
💎 If the area is maintained, it can grow first to the middle of the channel to break the swing and then to the 2.24 range. In the future, it can continue this growth by maintaining the middle of the channel to the top of the channel.
💎 Alternative scenario: In addition, if the green box area is broken, it can continue the correction to the bottom of the channel and then to the range of $1.95.
»»»«««»»»«««»»»«««
Please support this idea with a LIKE and COMMENT if you find it useful and Click "Follow" on our profile if you'd like these trade ideas delivered straight to your email in the future.
Thanks for your continued support.
Sincerely.❤️
»»»«««»»»«««»»»«««

$STX Stacks after over 50% retracement... What Next?NASDAQ:STX STACKS has recently done over a 50% retracement from an all time high of about $3.8
Current Price: $2.2
Stacks current price action is currently trying to break out of its falling channel for higher prices
Up resistances: 2.4, 2.9, 3.3, 3.6 then possibly new price discovery at 4.0, 4.4, 4.7, 5.1
A failed breakout of channel will lead to retest of support at 1.8

STX: Falling Wedge BreakoutTrade setup : Bullish breakout from Falling Wedge could signal resumption of uptrend, with +25% potential upside to $2.50 thereafter. Breakout was confirmed as price broke above $2.00 horizontal resistance and above 200-day moving average ($2.06). Stacks (STX) is a platform for scaling and building on top of Bitcoin. Read our research report.
Patterns : Falling Wedge Usually results in a bullish breakout . When price breaks the upper trend line the price is expected to trend higher. Emerging patterns (before a breakout occurs) can be traded by swing traders between the convergence lines; however, most traders should wait for a completed pattern with a breakout and then place a BUY order. Learn to trade chart patterns in Lesson 8.
Trend : Short-term trend is Neutral, Medium-term trend is Strong Down and Long-term trend is Down.
Momentum : Price is neither overbought nor oversold currently, based on RSI-14 levels (RSI > 30 and RSI < 70).
Support and Resistance : Nearest Support Zone is $2.00, then $1.30. Nearest Resistance Zone is $2.50, then $3.50.

STX/USDT Breakout Alert!! This is can be bullish momentum💎 Paradisers, STX is indeed exhibiting intriguing movements that warrant close attention.
💎 Having successfully broken out of the falling wedge pattern, STX has signaled bullish momentum for its next movement. There's potential for a retest around the 2.1 to 2.0 area before resuming its upward trajectory towards the resistance zone between 2.375 and 2.51.
💎 A successful breakout above this resistance would confirm STX's return to a bullish trend in the mid-term, potentially leading to significant upward movement towards our target strong resistance area.
💎 However, if STX fails to break above the resistance and experiences a strong rejection indicated by a bearish candle, the price may retreat back to the demand area, possibly around 1.75, to gather new momentum for another attempt at breaking the resistance.
💎 It's crucial for STX to bounce from the demand area and resume its upward movement. Failure to do so, especially if STX shows weakness and sideways movement, could signal a bearish turn, particularly if the demand level at 1.75 is breached.
MyCryptoParadise
iFeel the success🌴

Stacks / STX The price of Stacks is $0.76 today with a 24hour trading volume of 250 million dollars. This represents a 12% price increase in the last 24 hours and a 160% price increase in the past 14 days
Stacks is a layer1 blockchain solution that is designed to bring smart contracts and decentralized applications to Bitcoin. These smart contracts are brought to Bitcoin without changing any of the features that make it so powerful, including its security and stability. Stacks was initially funded by a range of prominent venture capital funds, including Y Combinator, Digital Currency Group and Winklevoss Capital. It was developed by Blockstack PBC, which has its headquarters in New York.
Next Stacks upgrade is slated for March 20th, with the larger Nakamoto upgrade planned for later this year. Stacks 2.1 can enable more efficient Bitcoin yield via Stacking, make bridges to other networks more robust, simplify the ways developers can link and trigger interactions between Stacks and Bitcoin, and lay some helpful groundwork for Subnets which can bring additional speed and scalability to the network when launched.
if you are scalper be careful because as you can see those shadows are huge and STX whales are ruthless , 0.65 is good support and opportunity for buying the dip or long
STX next targets are 0.81, 0.85 and 0.89$

STX/USDT Ready to Breakout From the Falling Wedge | STX Analysis💎#STXUSDT is navigating through a falling wedge and is poised to retest the channel's lower support at $1.80. We anticipate this key support level to hold firm, setting the stage for a bullish reversal that could propel the asset toward the channel's upper resistance.
💎However, if #Stacks falters and breaches below the $1.80 support, it may signal an extension of the bearish trend, steering the asset toward the next significant demand zone at $1.636. This level is known for its vigorous liquidity and history of prompting notable upward trends.
💎If NASDAQ:STX revisits this demand zone, securing a robust rebound is essential for sustaining support. Any failure to achieve this rebound could intensify bearish momentum, worsen market sentiment, and potentially trigger additional price declines.
💎Stay agile and vigilant, Paradisers. Your ParadiseTeam is diligently monitoring the market and is ready to guide you through the dynamic shifts in the #Stacks market.
MyCryptoParadise
iFeel the success
