Stacks STX price has entered powerful liquidity zone, what next?The STXUSDT price has entered a powerful liquidity zone - the global highs of 2021.
Now, you should be careful with Stacks longs, as there has already been a redistribution of capital and a trend change in the $1,75-2.50 range twice.
A confident medium-term STX long is possible either when the price is firmly established above $2.50 or after a correction around $0.90.
The global target for the STX growth wave is $8.50-10.50, the only question is whether it will be a blue or white route?
STX

STXUSD: One more green week and then correction.This is a direct update to our initial long signal on Stacks (see chart at the bottom), which is so far going according to plan. It just turned overbought on the 1D timeframe (RSI = 72.109) but it is the 1W that is of more concern, which is extremely overbought (RSI = 87.916, MACD = 0.253, ADX = 61.042) and this is why we are doing today's analysis on the 1W timeframe.
Our TP = 2.5000 remains but after that we expect a strong correction as not only is the 1W RSI the most overbought in history, but we are about to experience the first ever 1W Golden Cross, which would be a good opportunity for the market to take profits. The downside target is the 0.618 Fibonacci level (TP = 1.20000).
See how our prior idea has worked:
## If you like our free content follow our profile to get more daily ideas. ##
## Comments and likes are greatly appreciated. ##

📈💹 STX Market Update 🌐💰📈 Strength in Performance:
Unlike other altcoins that experienced corrections, STX has shown remarkable resilience.
Quick recovery from the recent dip indicates a potential strong performance in the coming days.
🚀 Buyer Dominance:
Despite heading into a resistance area, buyers seem to be in control.

Stacks STX Coin Price Prediction🔥 Price on the 4H chart might come at these support area and we might get a potential bounce🔥
Potential bounce areas for Buying 1.7499 and 1.5043
👉 Follow me for More Real Time Opportunities.
Share your Thoughts if you have any?

STX: The Bitcoin Multiplier Unleashed! 🤖🚀 STX: The Bitcoin Multiplier Unleashed! 💹🌟
Hello, traders and crypto enthusiasts! Today, we're diving into the dynamic world of STX (Stacks), a project I've termed the "Bitcoin multiplier." Let's explore why STX is creating waves in the crypto universe:
🌊 Riding the Bitcoin Wave:
STX, since early 2021, has been enhancing Bitcoin's utility.
Key highlight: BlackRock's potential Bitcoin ETF, signaling strong institutional interest.
SEC's view of Bitcoin as a commodity boosts prospects for Stacks blockchain.
🚀 Stacks' Stellar Growth:
An impressive 472% growth last year alone!
Our portfolio showcases diverse, high-performing assets, including STX.
Strategic focus: Diversifying into low caps and new segments, keeping a keen eye on Bitcoin's ecosystem and switch focus to new, AI related crypto gems!
📈 Technical Analysis Insights:
STX shows promising entry points, recently breaking over $1.7833.
Current support at $1.7833, with targets at $2.76, $4.33, $6.97, and a potential high of $19 by 2025.
🌍 Global Impact and Layer 2 Dominance:
As Bitcoin gains global traction, the demand for Layer 2 solutions like Stacks increases.
Stacks leads in Bitcoin Layer 2 solutions, offering innovative features like smart contracts.
Emergence of liquid stacking and SBTC - a decentralized take on Wrapped Bitcoin.
🔐 Smart Contract Functionality:
Stacks brings Turing complete smart contracts to Bitcoin's ecosystem.
This blend of security and open-source possibilities sets Stacks apart in the crypto space.
💡 The Future with Stacks:
With nations and markets increasingly embracing Bitcoin, Layer 2 solutions like Stacks are poised for growth.
Stacks' role in alleviating Bitcoin blockchain's transactional load is crucial.
One Love,
The FXPROFESSOR 💙
Helpful Links:
Understanding STX's Market Position
Deep Dive into STX

Brief Analysis——STXThe window for BTC ETF will arrive this week. Judging from the current review progress, we believe that the BTC ETF has a high probability of approval. With the influx of funds, the crypto market is likely to continue its bullish trend. The BTC ecosystem will also gain market attention again. So today we chose STX, Layer 2 of the BTC ecosystem. Compared with ORDI, which has more meme attributes, STX may be more favored by investors.
Stacks is a Bitcoin Layer for smart contracts. It enables smart contracts and decentralized applications to use Bitcoin as an asset and settle transactions on the Bitcoin blockchain. Bitcoin is the largest, most valuable, and most durable decentralized asset. The Stacks layer unlocks $500B in BTC capital using the Bitcoin L1 as settlement for decentralized applications.
The rise of STX this year is basically in sync with the popularity of the BTC ecosystem. Although there is no increase as much as ORDI, STX's rise is more sustainable than other tokens. Currently, STX is in the process of high fluctuations. Judging from the ME indicator, STX undoubtedly maintains the bullish trend, and the purple wavy area is expanding. But on the WTA indicator, the rise of STX in early January was not supported by whales. Especially in the past two days, although the price has risen with fluctuation, the length of the columns on the WTA has shrunk. A correction may occur in the short term.
Switch to 4h level. As stated on the daily level, STX has had significantly fewer whales during its recent move than it did previously. And there is opposition among the whales. After the two red candles, the whale brought a long green candle and broke out of the previous high. Judging from the current situation, bulls are leading, and if new whales can be further attracted to arrive, then the second round of rise may come.
Disclaimer: Nothing in the script constitutes investment advice. The script objectively expounded the market situation and should not be construed as an offer to sell or an invitation to buy any cryptocurrencies.
Any decisions made based on the information contained in the script are your sole responsibility. Any investments made or to be made shall be with your independent analyses based on your financial situation and objectives.

STACKS ( STX ) long term ideaLONG term hold idea
Very nice higher low... currently at an area of resistance ( order block )
2 entry ideas ( 1 for breakout and 1 for pullback support bounce )
Year 2024 Plans for Stacks:
Implement Nakamoto upgrade for enhanced speed and security in layer 2 solutions.
Integrate ALEX's off-chain STX20 trading technology.
Objective: Revitalize the Bitcoin L2 ecosystem
This is for ENTERTAINMENT purpose Only.
Not Financial Advise
Always DYOR ( do your own research )

$stx stacks cup and handle pattern....NASDAQ:STX price action currently in a cup and handle pattern
Current price: 0.96
Break out of Neckline will lead to higher resistances up to 1.8
Further Rejection of neckline resistance will retest previous supports which will make for perfect spot buy the dip opportunities!

STX SEEMS NOT FAR FROM THE BREAKThank you for reading this update.
Depending on our study we see that UMA has a good chance of volume increase.
STX seems on an important level with the chance to break in the coming time frames.
Big question if STX is going to see the next break to $2,98 and up?
#Nottradingadvice
#For Day traders take always profits when the market increase
#Expect nothing from the markets, but follow what it shows.

Stacks STXUSD to $40-50 by end of 2024Stacks NASDAQ:STX is exhibiting relative bullish strength after reclaiming the resistance block (seen in red) as support. Similar to 2020, currently it is completing two bullish reversal patterns of the trend such as a:
(1) double bottom at 0.23-0.19c and
(2) rounding bottom.
Once NASDAQ:STX rallies towards the top resistance block of the rounding bottom at $2.65-3.25 and successfully backtests it as support, we can expect the Megabull to be confirmed, leading NASDAQ:STX to rally and reach a peak by the end of 2024 at either $10 or $40-50 . This would represent a generous 5,000 to 23,000% increase from the all-time lows should we reach $10 or $40-50 respectively. Tim Draper is backing Stacks among others in the industry, so I would not be surprised to see it deliver great gains in 2024.
Don't forget to like and subscribe! I'll be publishing more ideas with targets for Bitcoin and altcoins in the incoming weeks.
Carl M.

STX/USDT Navigating Bullish Opportunities at Key Support? 👀 🚀💎 Paradisers, spotlight on #STXUSDT! It's gearing up for an exciting phase, hinting at a potential upward swing from a crucial support level.
💎 Here's the scoop on #Stacks It's been playing the market game quite skillfully, breaking free from a descending trendline and heading north. Now it is eyeing a revisit to what was once a hurdle but now a springboard - the support level at $0.9647. If NASDAQ:STX bounces off this level, we could see it soar towards the significant supply mark at $1.5771. Think of it like a trampoline effect - down, up, and higher!
💎For #STX traders, it's all about being prepared for every twist and turn. If it doesn't catch the bullish wave and starts to dip, we might need to look at plan B - rallying from the lower support deck at $0.8353.
💎 And here's a heads-up: if STX dips below this safety net, it’s time for a market huddle. Such a move would be a signal to rethink our strategies, maybe shifting gears to match the new market playbook.

STX Stacks Coin Price Prediction🔥 Price on the 4H chart might come at these support area and we might get a potential bounce🔥
Potential bounce areas for Buying 1.2641 and 1.1764
👉 Follow me for more real time opportunities.
Share your Thoughts if you have any?

🔋 STX: The Bitcoin Multiplier - Next Stops $0.845 & $1.0 🎯👽Hey traders, Professor here! 👋
Quick update on STX Stacks. This gem is moving in sync with Bitcoin but on steroids. 📈
Key Levels:
Current Support: $0.60 🛑
Next Targets: $0.845 & $1.07 🎯
Bought the dip after the 55-cent rejection and it's been a smooth ride. 🛒
Why STX?
It's a Bitcoin layer for smart contracts. 🤖
Enables DApps to use Bitcoin as an asset. 💎
Secured by 100% Bitcoin hash power. 🔒
In short, if Bitcoin is the king, STX is the knight in shining armor. 🤴🛡️
Keep an eye on this one, folks. High expectations here! 🌠
Happy trading! 🤑
Emojis:
🚀🎯👋📈🛑🛒🤖💎🔒🤴🛡️🌠🤑
One Love,
The FXPROFESSOR 💙

STX Has A very good Investment Opportunity Hi Everyone;
today we have one of the best risk to reward Investment opportunity
it is more than 860 times the risk and the chart is look very promising.
I expect breaking the previous bear market key point will clear the way to the final target

Possible slow in Momentum of STXWe have seen a major push in BINANCE:STXUSDT from the 0.43 area to the 1.139 where we just might see a resistance. Next area I'd be looking for a buy setup would be around the 0.719. Fingers crossed and eyes on the ball

STX will be flying soonWe have bullish structures on the chart and candles react well to demand. It is expected that if the candles reach the green box, we will see a good reaction.
I specified the target. This analysis will be violated if a daily candle closes below the demand range.
For risk management, please don't forget stop loss and capital management
Comment if you have any questions
Thank You

STX/USDT Upward Momentum? 💫Stacks Today analysis💎 Paradisers, direct your attention to #STXUSDT as it showcases a compelling pattern. Currently trading within a consistent range, the asset exhibits a high probability of a bullish breakout.
💎 In the past, #STACKS has demonstrated a trend of following a descending trendline, breaking above it to initiate an upward movement. It has been faithfully adhering to a range-bound trajectory, experiencing rejections twice at the same resistance level.
💎 Presently, it's regaining bullish momentum, pointing towards a substantial chance for a bullish movement. Should this upward trend persist, It is poised to target the resistance at $.7380, and may even surge higher to challenge elevated resistance levels at $.8874.
💎 For #STX traders, readiness for a possible bullish rebound from the support level of $.5678 is crucial. However, be mindful that a drop below this level could signal challenges in maintaining the bullish trend.
💎 In this ever-shifting and dynamic market environment, strategic foresight and adept decision-making are key. Formulating a comprehensive trading strategy, which includes robust money management and a profound understanding of support and resistance levels, is essential for attaining successful trading outcomes. 🌴💰

STX/USDT Break out the Bullish pattern. Continue Bullish ??💎 STX is currently a significant focus in the trading community. In a similar vein to MINA, it's breaking out of a Bullish FLAG pattern and is entering a retesting phase at the resistance trendline.
💎 If STX successfully retests, characterized by a bounce off the resistance trendline, it could signal a continuation of its upward trajectory, probability aiming for a strong supply area in our target zone.
💎 However, if STX fails to rebound from the resistance trendline of the Bullish flag and instead consolidates around this level, it could be a troubling indicator. Such a scenario might lead to STX breaking down below the trendline. A breakdown like this would confirm a false breakout, potentially setting STX on a path back to a lower demand level around $0.592.

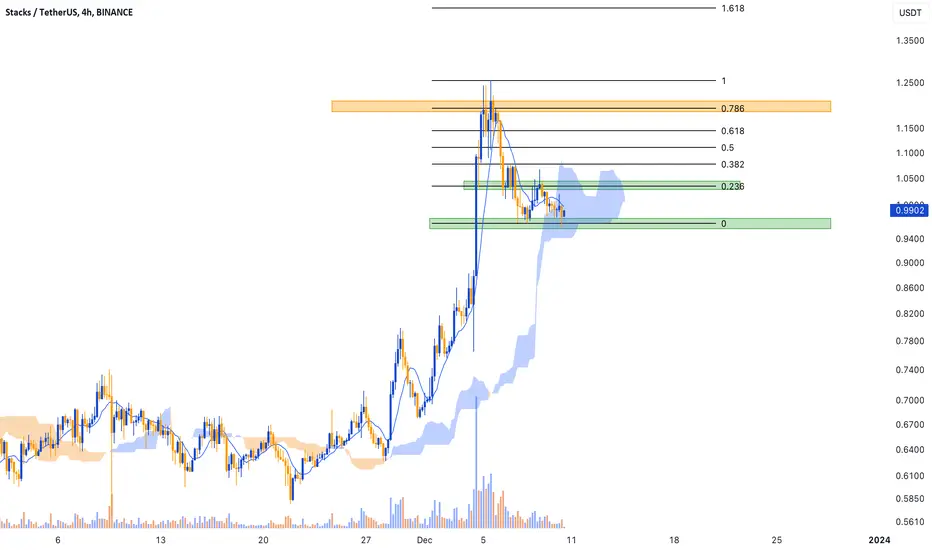
Critical Fibonacci LevelsSTX has experienced a substantial resistance at the crucial $1.1940 level, leading to a decline below the pivotal support zone of $0.9670.
Currently, the price is oscillating between the 0 and 0.236 Fibonacci retracement levels on the four-hour chart. This positioning suggests that the price is in the initial phase of retracement from its recent peak.
The area between these levels often acts as a key zone for potential reversals or continuation of the trend. If the price manages to breach this zone and sustains above it, it could indicate a shift in market sentiment, potentially leading to an uptrend.
Conversely, failure to break above the 0.236 level might result in a continuation of the downtrend.
This analysis is for informational purposes only and should not be considered as financial advice.
STX (Stacks) Plan ahead and a coin descriptionHello Folks!
I hope your day is profitable and stress free as that is the way we teach to trade!
Today we are looking at BINANCE:STXUSDT or the coin other wise known as Stacks. Taking a peek at this chart in a simple way. It is obvious that Stacks has broken from a huge falling wedge to form a continuation pattern of a bull flag and just keeps on going!
I have put some targets on this chart and made it easy for you to point out areas of resistance. Once you see the RSI becoming diverged in a bearish way at a target or a resistance take some profits and add them back during the pullbacks. This will add to your coin count when that final target is hit. Which is likely higher than the highest target we currently have on this chart!
Please let me know your thoughts in the comments and feel free to request a chart in the comments as well.
Here is some information on this coin to further your research in this investment.
What is STX Crypto?
BINANCE:STXUSDT
Stacks STX crypto coin
STX (Stacks) is a cryptocurrency project that aims to bring smart contracts and decentralized applications (dApps) to the Bitcoin network. It does this by creating a "second layer" on top of Bitcoin, which allows developers to build applications that leverage Bitcoin's security and immutability.
Here are some key features of STX:
Smart contracts: STX enables developers to create smart contracts on the Bitcoin network. This allows for the creation of a wide range of applications, including decentralized finance (DeFi), non-fungible tokens (NFTs), and more.
Decentralized applications (dApps): STX also allows developers to build dApps that run on the Bitcoin network. These dApps can be anything from simple games to complex financial applications.
Security: STX inherits the security of the Bitcoin network. This means that STX applications are highly resistant to fraud and censorship.
Scalability: STX is designed to be scalable. This means that it can handle a large number of transactions without becoming congested.
Some of the benefits of using STX include:
Access to Bitcoin's security and immutability: This makes STX applications highly resistant to fraud and censorship.
Ability to build a wide range of applications: STX can be used to build a variety of applications, including DeFi, NFTs, and more.
Scalability: STX is designed to be scalable, so it can handle a large number of transactions without becoming congested.
Here are some of the potential risks associated with STX:
Volatility: The price of STX is volatile, which means that it can fluctuate significantly in value.
Regulation: The regulatory landscape for cryptocurrencies is still evolving, and it is possible that STX could be subject to regulation in the future.
Competition: STX faces competition from other smart contract platforms, such as Ethereum.
Overall, STX is a promising project with the potential to bring smart contracts and dApps to the Bitcoin network. However, it is important to be aware of the risks involved before investing in STX.
Here are some additional resources that you may find helpful:
Stacks website: www.stacks.co
Stacks whitepaper: gaia.blockstack.org
CoinMarketCap: coinmarketcap.com
Coinbase: www.coinbase.com
Recent News about STX Crypto (as of December 9, 2023):
Price Rise:
STX has seen a significant price increase in recent times. Over the past 7 days, the price has risen by 32.66%, with a 4.66% increase in the last 24 hours. The current price sits at $1.02 per STX, still significantly below its all-time high of $3.61.
Potential Reasons for the Price Rise:
Anticipation of the Stacks 2.0 mainnet launch: This launch is expected to bring significant improvements to the STX network, including faster transaction speeds and lower fees.
Increased interest in DeFi and NFTs: STX's ability to enable DeFi and NFTs on the Bitcoin network is attracting attention from investors.
Overall positive sentiment in the crypto market: The recent rise in Bitcoin's price may have also contributed to the positive sentiment surrounding STX.
Other Recent News:
CoinMarketCap now lists the STX circulating supply: This will provide investors with a more accurate picture of the total number of STX tokens in circulation.
Stacks launches a new website: The new website provides a more user-friendly experience and includes information about the Stacks ecosystem.
Stacks announces a partnership with Hiro Wallet: This partnership will make it easier for users to store and manage their STX tokens.
Overall, the recent news surrounding STX is positive, and there is a lot of excitement about the future of the project. However, as with any investment, it is important to do your own research before investing in STX.
Here are some resources where you can find more recent information about STX:
Cointelegraph: cointelegraph.com
CoinDesk: www.coinbase.com
Stacks Twitter: twitter.com
Stacks Telegram: telegramguide.com
I hope this information is helpful. Please let me know if you have any other questions in the comments.

$STX almost 200% upside?COINBASE:STXUSD is one of my favorite looking charts for upside potential. STX, $ SYN $ XRP and $MASK are all charts that I've been looking at that haven't run yet.
Therefore, I think they'll be the next set of coins to run after BTC pulls back.
If we look at the chart, you can see STX has broken out of a massive bull pennant and now has formed a bull flag. As long as STX stays within the flag structure, then I lean towards one more move down to test the lows at $.58-$.59 before breaking upwards.
If this were to play out like this, then you can expect between 180%-200% gains from an entry at support. If it breaks upwards sooner than that, then I still expect the targets to remain, you'll just see smaller gains.
Let's keep an eye on this for the next week to see if we can nail and entry and exit.

#STX/USDT#STX
The price broke the descending triangle and has been falling since last March
With an oversold presence on the MACD
We expect an upward wave heading to 150% of the current price
Entry areas from
With a goal of 0.4000 to 0.5200
With a goal of 0.8900
We expect the price sequence to rise

STX 15mins Bearish OBSTX created beaeish OB above and ready to induced retail into shorting from the first OB but it will be a good idea to let the liquidity be grab towards the OB above the inefficiency......... Wait for entry and take a short from there
Follow for more market update and trade setup
