STXUSDT | BREAKING OUTSTXUSDT has given a breakout from the falling resistance trendline. We are expecting a retest to the level again and more confirmed once the horizontal level is taken out.
One can build a position with mentioned stop loss level and ride the upcoming bullish trend.
Trade your levels accordingly.
STXUSDT

Stacks has bottomed at the 0.618 Fibonacci retracementSTXUSDT has put down a textbook 0.618 Fibonacci retracement correction on the weekly chart.
In my Elliott Wave count, the last impulsive wave was a truncated fifth. In a new wave count, the retracement to the 0.618 Fibonacci is a corrective wave 2. Such a correction is not unusual for a corrective Wave 2.
The Tom Demark (TD) Sequential Indicator indicates a 9-candle count. This usually means that a bottom has been reached and a trend reversal will occur. It indicates a set-up to take a position in the market.
I have additionally used the Chris Moody Indicator "RSI Strategy Lower". This indicates by means of the RSI that a bottom has been reached. This can also be seen by the formed horizontal green line; this is now starting to move upwards.
If STXUSDT is preparing for an impulsive wave 3, interesting times are coming...

#STXBreaking 0.5 daily with a high selling volume, we will see the negative targets in which the investor should be careful of them

Long STX\USDTlooking at a longer period …
Stacks is a layer-1 blockchain solution that is designed to bring smart contracts and decentralized applications (DApps) to Bitcoin (BTC). These smart contracts are brought to Bitcoin without changing any of the features that make it so powerful — including its security and stability.
STX/USDT Technical analysis CRYPTOCurrent technical analysis for STX/USDT if you have any questions or criticism towards my analysis feel free to leave them in the comments!
FORECAST FOR ONLY IF PRICE REACHES THE TARGETS IF IT DOES NOT THEN THIS GRAPH DOES NOT IMPLY TOWARDS ANY OTHER PRICE TARGET!!!
Red line = current support
Orange line = current resistance
Yellow line = future resistance
Green line = future resistance
White arrows = what i think will happen
Yellow line = can happen but less likely
FORECAST ONLY FOR WHETHER THE PRICE WILL REACH THE BOTTOM OF THE DIAGONAL SUPPORT IF IT DOES NOT IT MAY BREAK THROUGH AND ENTER MUDDY GROUNDS!!!

STX based on the analysis STX is going to 0.78 but in my opinion as soon it breaks 0.97 level the correction is completed before hits the target.
peace:)


STXUSDT Reversal after sudden fallSTXUSDT Reversal after a short sudden fall as bullish one white soldier is setup?
Note: This is not reflecting BTC price which is sidelined in last few hours

STX BOUNCE OR MORE CORRECTION?STX is a good project. You can earn BTC by staking your STX coins.
STX is standing on the red trendline. If this trendline going to be broken, I guess it can fall back to 0.5$. In my opinion, this area is a strong buy area.
In case of bounce, if it can menage to go above 2.8$ next target will be the upper trendline.
This is my trial. Not a financial advice.

Bag🎒 your STACKS once again! Stacks broke up this triangle 📐 and I think there is chance for run to 3.55 and even higher. Setting BUY LIMIT order to catch the pullback. STX just pamp eet! ⛽
ENTRY : local high @ 2.19
STOPLOSS (SL) : local low @ 1.94
TARGETS (TP) : TP1 - resistance @ 2.70 | TP2 - resistance @ 3.09 | TP3 - height of the triangle projected from midpoint of the local range (BUY LIMIT - SL) @ 3.55
REWARD RISK RATIO (RRR) : TARGET1 - 2.0 | TARGET2 - 3.6 | TARGET3 - 5.5
INVALIDATION : when SL level hit
My previous STX ideas 👇
Check my other stuff in related ideas.
Please like👍, comment🗣️, follow me✒️, enjoy📺!
⚠️Disclaimer: I'm not financial advisor. This is not a financial advice. Do your own due dilingence.


STXThis currency can grow well according to the news tomorrow
Ichimoku's strong resistance is in front of his way, which I think can break and grow very well.

STXUSDT AnalysisHello friends.
Please support my work by clicking the LIKE button(If you liked).Thank you!
Everything on the chart.
open pos: market and lower
target: 2.8 - 3.2 - 3.6
after first target reached move ur stop to breakeven
stop: under 1.5 (depending of ur risk). ALWAYS follow ur RM .
risk/reward 1 to 3
risk is justified
Good luck everyone!
Follow me on TRADINGView, if you don't want to miss my next analysis or signals.
It's not financial advice.
Dont Forget, always make your own research before to trade my ideas!
Open to your questions or suggestions.

$STX Lot of event on Desember. don't miss it !$STX Lot of event on Desember. don't miss it !
ljfnwjbefnwnefowneovnwovnwojnvwovnweonvoewnvweovnoewvnoewnvweovwonv


$STX /USD, ATH and instant 20% $STX /USD
ATH and fast 20% on a new 2D Buy signal by UCTS
(I will take it😄)
Let see if it can hodl/flip this area and look for continuation after such breakout
#STX

stx/usdt analysishello my friends
this my idea about stx all things are clear on the chart
thank you

STXUSDT trade I the best trading pointSTXUSDT trade in the best situation where it can boost up 3X. Trade will be between 78% fib level and 261% fib level. We will update further about analysis if we find any change in idea. Stay tune.

Analysis STXUSDTHello,
Welcome to this analysis about STXUSDT, we are looking at the 1D time frame perspectives.
Support and resistance ranges are specified.
Information provided is only educational and should not be used to take action in the markets.
thank you for watching the analysis.

STXUSDT Hello Crypto Lovers,
Mars Signals team wishes you high profits.
We are in a daily time frame.
As you can see, the price has hit the support line for the third time and is currently fluctuating above that and can start moving up again.
You can enter the trade after the price breaks the resistance line and stabilizes above it to achieve the above targets.
But if the support line is broken and the price stabilizes below it, we can see more fall.
Warning: This is just a suggestion and we do not guarantee profits. We advise you analyze the chart before opening any position.
Wish you luck

Short and Long - STX/BTCShort and Long - STX/BTC
Interesting situation, where do you think the price is heading?

Stacks (STX) - November 25Hello?
Welcome, traders.
If you "follow", you can always get new information quickly.
Please also click "Like".
Have a nice day.
-------------------------------------
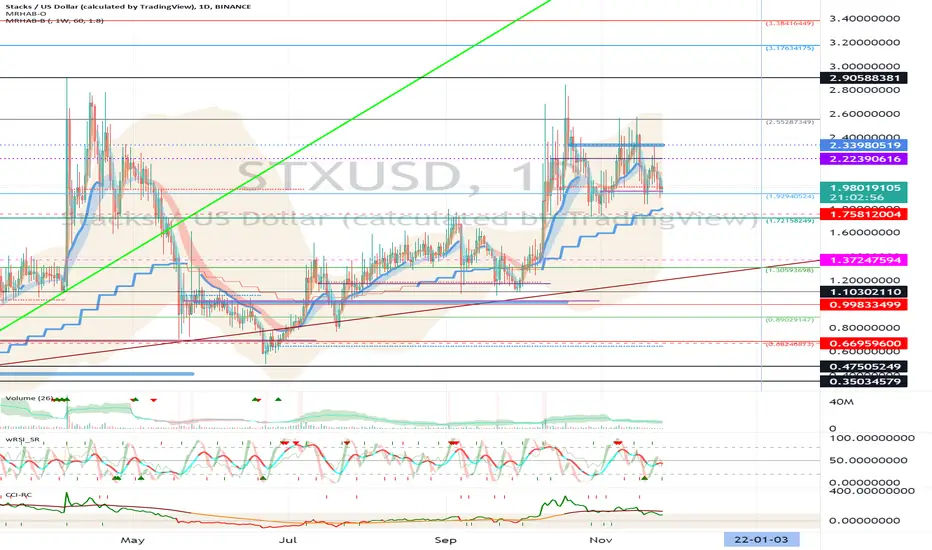
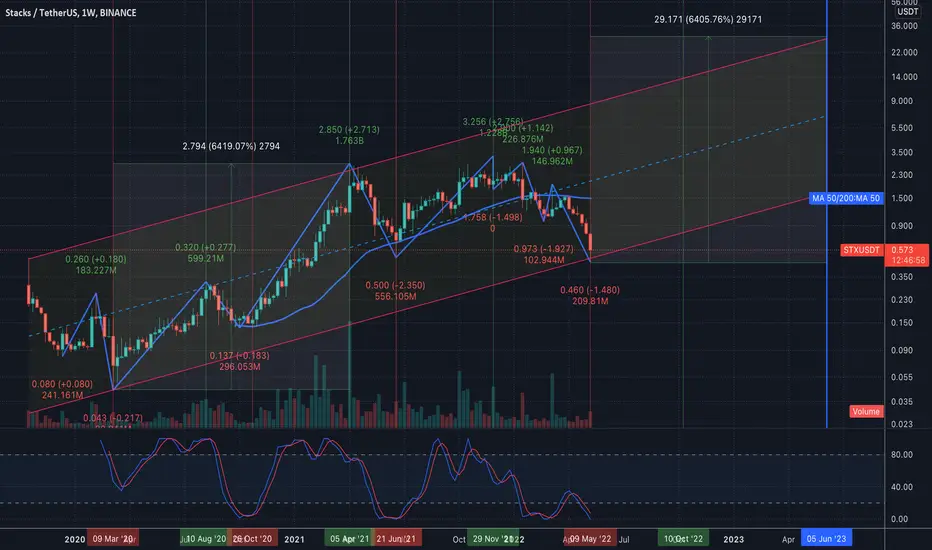
(STXUSD 1W Chart) - Mid-Long-Term Perspective
Above 0.35034579-0.47505249 section: expected to continue upward trend
0.99833499-1.10302110 or higher: Expected to create a new wave.
(1D chart)
First resistance section: near the 2.55287349 point
Second resistance section: 3.17634175-3.38416449
Support section: 1.72158249-1.92940524
If the price is maintained in the range of 1.92940524-2.55287349, it is expected to renew ATH.
It should rise above the 2.33980519-2.55287349 section to accelerate the uptrend.
If the price declines from the support zone, it may move towards the 1.10302110 point, so trade cautiously.
------------------------------------------
(STXBTC 1W chart)
Above the 2735 Satoshi point, we need to see if we can continue the uptrend along the uptrend line.
------------------------------------------
We recommend that you trade with your average unit price.
This is because, if the price is below your average unit price, whether it is in an uptrend or in a downtrend, there is a high possibility that you will not be able to get a big profit due to the psychological burden.
The center of all trading starts with the average unit price at which you start trading.
If you ignore this, you may be trading in the wrong direction.
Therefore, it is important to find a way to lower the average unit price and adjust the proportion of the investment, ultimately allowing the funds corresponding to the profits to regenerate themselves.
------------------------------------------------------------ -----------------------------------------------------
** All indicators are lagging indicators.
Therefore, it is important to be aware that the indicator moves accordingly as price and volume move.
However, for the sake of convenience, we are talking in reverse for the interpretation of the indicator.
** The MRHAB-O and MRHAB-B indicators used in the chart are indicators of our channel that have not yet been released.
(Since it was not disclosed, you can use this chart without any restrictions by sharing this chart and copying and pasting the indicators.)
** The wRSI_SR indicator is an indicator created by adding settings and options to the existing Stochastic RSI indicator.
Therefore, the interpretation is the same as the traditional Stochastic RSI indicator. (K, D line -> R, S line)
** The OBV indicator was re-created by applying the formula to the DepthHouse Trading indicator, an indicator disclosed by oh92. (Thanks for this.)
** Support or resistance is based on the closing price of the 1D chart.
** All descriptions are for reference only and do not guarantee a profit or loss in investment.
(Short-term Stop Loss can be said to be a point where profit and loss can be preserved or additional entry can be made through split trading. It is a short-term investment perspective.)
---------------------------------