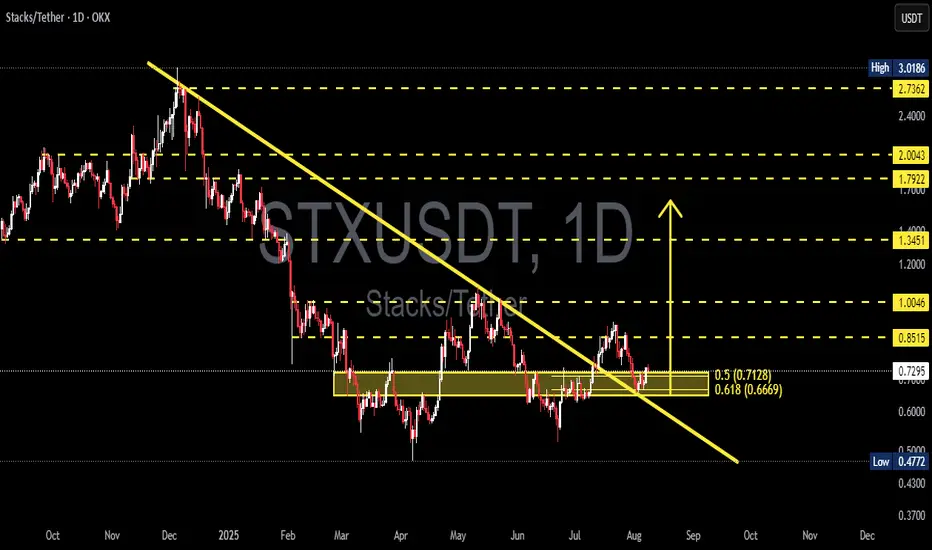
Breakout Confirmed – Is STX/USDT Ready for a Trend Reversal?Technical Analysis – STX/USDT (Daily Timeframe)
STX/USDT has shown a significant technical breakout after successfully breaching the descending trendline that has acted as a dynamic resistance since early 2025.
Currently, price is retesting a key support zone, which was a former resistance level—indicating a possible flip to demand and validation of the breakout.
---
🔹 Key Zone:
Demand zone (yellow box): 0.6669 – 0.7128
(based on Fibonacci retracement levels 0.618 and 0.5)
Current price: 0.7313
---
📈 Bullish Scenario:
Breakout from the descending trendline suggests a potential trend reversal.
As long as price holds above the 0.6669 – 0.7128 zone, upward continuation is likely.
Potential resistance targets:
0.8515
1.0046
1.3451
Extended target: 1.7922, if bullish momentum continues
---
📉 Bearish Scenario:
If price fails to hold the Fibonacci support zone, a deeper correction could follow.
Downside support levels to watch:
0.60 (psychological support)
0.4772 (2025 low)
---
📊 Pattern & Market Structure:
The trendline breakout is the first sign of a structural shift.
A successful retest and formation of a higher low could confirm a new bullish market structure.
The Fibonacci confluence zone aligns with price action support, making it a key decision area.
---
Conclusion:
STX/USDT is showing signs of recovery and a potential reversal after a prolonged downtrend. The breakout is promising, but confirmation will come if the price holds the key support zone. Traders should closely monitor the 0.6669 – 0.7128 region to gauge future price direction.
#STX #STXUSDT #CryptoBreakout #TrendReversal #FibonacciLevels #TechnicalAnalysis #Altcoins #CryptoTA #SupportResistance #PriceAction
Stxusdtidea
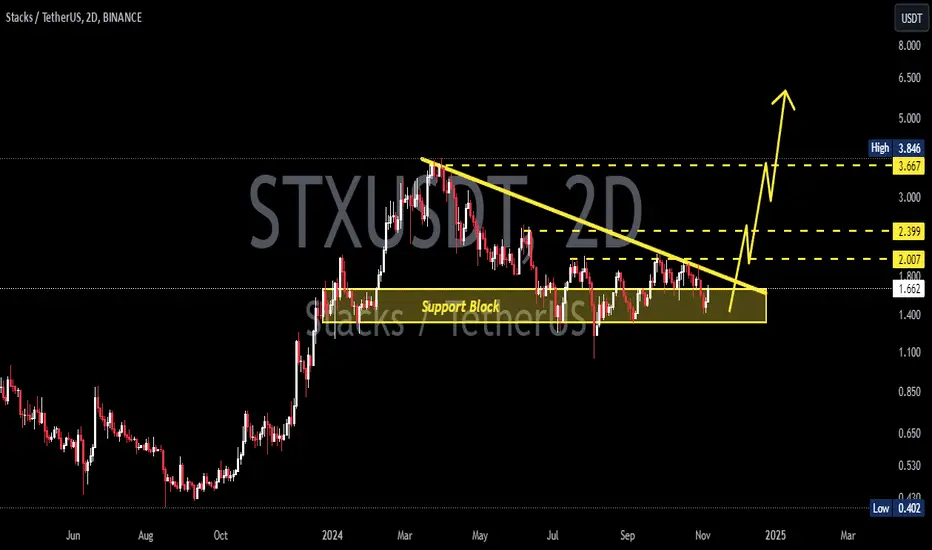
STX/USDT Weekly Outlook Golden Accumulation Zone
📌 Overview:
STX (Stacks) is currently retesting a crucial demand zone in the $0.63 – $0.72 range — the same area that previously served as the launchpad for a massive rally toward the $3.80 highs. This chart highlights a strategic opportunity for swing traders and long-term investors who understand market cycles.
🧠 Price Structure Insight:
A well-established demand zone (highlighted in yellow) has acted as a base of accumulation since late 2022 through mid-2023.
Price is now consolidating above this zone, suggesting a potential bullish reversal.
A potential Double Bottom pattern is forming, with a neckline around the $1.00 level — a breakout above this could spark a significant bullish impulse.
🟢 Bullish Scenario (Upside Potential):
If STX maintains support and bounces from this accumulation zone, we could see a stair-step rally toward the following targets:
1. $0.90 – $1.00 → Psychological resistance & neckline of reversal pattern
2. $1.2975 → Historical supply and consolidation area
3. $1.9447 → Previous lower-high resistance zone
4. $2.20 – $2.71 → Key Fibonacci retracement levels from prior highs
5. $3.66 – $3.84 → All-Time High resistance, long-term bull target
🔍 A confirmed weekly close above $1.00 would significantly strengthen the bullish thesis and validate the reversal structure.
🔴 Bearish Scenario (Downside Risk):
If price breaks down below $0.6380, this could invalidate the current structure and lead to deeper corrections, targeting:
$0.45 → Minor support from early 2023
$0.20 → Historical macro bottom and extreme support
❗ A breakdown below this accumulation zone could trigger a longer-term bearish continuation.
🔄 Strategic Trading Notes:
This is a high-probability reversal zone, ideal for gradual accumulation (DCA) or swing entries with tight stop losses below support.
Watch for a spike in volume as a signal for institutional or smart money involvement.
Confirmation from bullish candlesticks (e.g., bullish engulfing on weekly) could provide additional entry confidence.
📚 Conclusion:
STX is testing a key structural level that previously led to exponential price growth. As long as the $0.63–$0.72 zone holds, the mid-to-long-term bias remains bullish. However, traders should remain disciplined and responsive to any invalidation signals.
#STXUSDT #Stacks #CryptoAnalysis #AltcoinSetup #TechnicalBreakout #WeeklyChart #BullishReversal #AccumulationZone #SmartMoney

STXUSDT 1W Analysis STX ~ 1W Analysis
#STX Buy back gradually from here with a short-term target of at least 20%++.

STXUSDT Potentially BullishWe saw BTCUSDT gain some momentum and this effect is being seen on many ALT coins. BINANCE:STXUSDT is no different!!! At the moment, STX is breaking out of a consolidation phase on the Daily TF. Will this breakout mean #STXUSDT is regaining its bullish momentum? That remains to be seen, However a close above the 0.78 will likely bring us into the bullish phase.
Until then, fingers crossed.
Do your analysis before taking any trade, results are not typical, past results does not guarantee future results

STXUSDT Potentially BullishBINANCE:STXUSDT is beginning to take shape and is looking good to go long. Broken the consolidation phase and retested it. The bulls are setting in however, we just might see the market slow down around the 1.152 area which turns out slightly below the EMA 200 and also aligns with a resistance point on the weekly TF. On futures trade, I will target this area while i will lock down some profits on my spot trading at this point.
This is not a trade advice as such do your due diligence
Past results does not guarantee future results

STXUSDT 1WSTX ~ 1W Analysis
#STX Buy gradually from here if you still have a Conviction on this coin with a short -term target of at least 20%+.

STXUSDT 1WSTX ~ 1W
#STX if you still have Conviction on the coin,. This support block would be a very good buying place for now,. Target at least 20%+ from here.

STXUSDTSTX ~ 2D
#STX So far it continues to maintain this support Block. Buy gradually on this support block,. with a minimum target of 15%++. If you have Conviction on this coin.
STXUSDT 2DSTX ~ 2D
#STX Best strategy for COINBASE:STXUSD , Buy on breaking out of this descending pattern, or buy in the demand zone.

STX Potentially BullishNASDAQ:STX is still attempting to reclaim the bullish momentum and so far, the 1.760 zone (Previous Resistance now turned support) seems to be holding. A further bullish push just might lead the start of another bullish push.
This does not completely rule out the possibility of another dip in the market. As long as the now found support holds, the bulls will take the lead otherwise, the bears will dominate. I will keep an eye on this closely. Expect updates on #STX as market reveals itself more.

STXUSDT 1DSTX ~ 1D
#STX Make purchases gradually in this pattern. it is only a matter of time until this pattern is successfully broken and the bulls will dominate again.

STX Potentially BullishWe have seen over time how the crypto market has created some lows. Are we going to be seeing some bullish push ahead of the crypto convention next month? On the TA side, market is looking like it is ready to make another push upward, however I will want to see some bullish move to confirm that the retest is completed on the H4 TF.
Until then, fingers crossed.
Long term, I'm going long

STXUSD 1DSTX ~ 1D
#STX In the event of a retest of this pattern's support line, This is a very good buy. with a minimum target of 15%+

STXUSDT Trade SetupThis coin is trying it level best to breakout on shorter Time Frame, if that resistance market as daily res is broken, it should fly higher than expectation.
Confluences:
1. Daily/Weekly Falling Wedge Breakout.
2. Lying on daily demand zone.
Thanks me later. Do not miss this before bull run starts.

STX Holders! FOLLOW ME~!Hello, guys!
This is ESS team.
We've got STXUSDT analysis.
If Candles are supported by the bottom GREEN uptrend line and make an upward move, We expect candle break through the RED long-term downtrend line.
After the break, It expect to make a parrallel channel with GREEN lines, and rise up.

NTX/USDT Favorable Entry Opportunity at Key Support & TrendlineKey Support and Trendline Confluence:
NTX/USDT currently finds itself situated at a critical support juncture, coinciding with the 4-hour trendline. This confluence underscores a pivotal area for potential market reversal or continuation.
Bullish Confirmation Entry
Traders eyeing long positions may consider entering upon bullish confirmation at the retest of this support zone. A prudent entry point lies near 2.9500, strategically positioned to capture potential upward momentum while managing risk effectively.
Risk Management Parameters
To safeguard against adverse price movements, it is advisable to implement a stop loss order in close proximity to the entry point. A stop loss set around 2.4360 serves to mitigate downside risk while allowing ample room for market fluctuations.
Profit Targets
Profit-taking levels should be established to capitalize on upward price potential. The first profit target (TP-1) is set at 3.4845, representing a significant area of resistance where partial positions may be exited. For those aiming for further gains, TP-2 is identified at 3.9390, reflecting a higher resistance zone.
Conclusion
In conclusion, NTX/USDT exhibits favorable conditions for a potential bullish reversal, with the confluence of key support and trendline providing a compelling entry opportunity. Diligent adherence to risk management principles and profit-taking strategies is paramount to successful trading execution.

STXUSDT Buying the dipBINANCE:STXUSDT showing some buying potential. We have seen some continued rejections; I will take a long position if price holds above the support area at 1.4495 to target the 2.000 mark.
#STXUSDT still looks ultimately bullish from my perspective

STXUSDT Where Next?BINANCE:STXUSDT did some amazing moves but from my stand point, it has come to a weekly zone which is close to an all time high, I expect some consolidation within the range of 2.8490 and 2.4493 areas.
A break above the 2.8490 will trigger a continued push upward while a close below the 2.4493 just might trigger a push down-ward. Either way, I will lock in some profit while waiting for the next move.
Updates to follow...
Do your due diligence

STXUSDTBINANCE:STXUSDT I'm looking this setup for short
⛔"Daily crypto market analyses I provide are personal opinions & not financial advice. Trading carries risks, so do your own research & seek advisor's help. #DYOR
Don't forget to 🚀 and comment

STXUSDTBINANCE:STXUSDT Currently doing a retest of the broken Zone @1.7540 area. If the new found support holds, we just might see some momentum upward again. Until the shift happens, fingers crossed

$stx stacks cup and handle pattern....NASDAQ:STX price action currently in a cup and handle pattern
Current price: 0.96
Break out of Neckline will lead to higher resistances up to 1.8
Further Rejection of neckline resistance will retest previous supports which will make for perfect spot buy the dip opportunities!

STX Has A very good Investment Opportunity Hi Everyone;
today we have one of the best risk to reward Investment opportunity
it is more than 860 times the risk and the chart is look very promising.
I expect breaking the previous bear market key point will clear the way to the final target

Possible slow in Momentum of STXWe have seen a major push in BINANCE:STXUSDT from the 0.43 area to the 1.139 where we just might see a resistance. Next area I'd be looking for a buy setup would be around the 0.719. Fingers crossed and eyes on the ball
