Breakout Confirmed – Is STX/USDT Ready for a Trend Reversal?Technical Analysis – STX/USDT (Daily Timeframe)
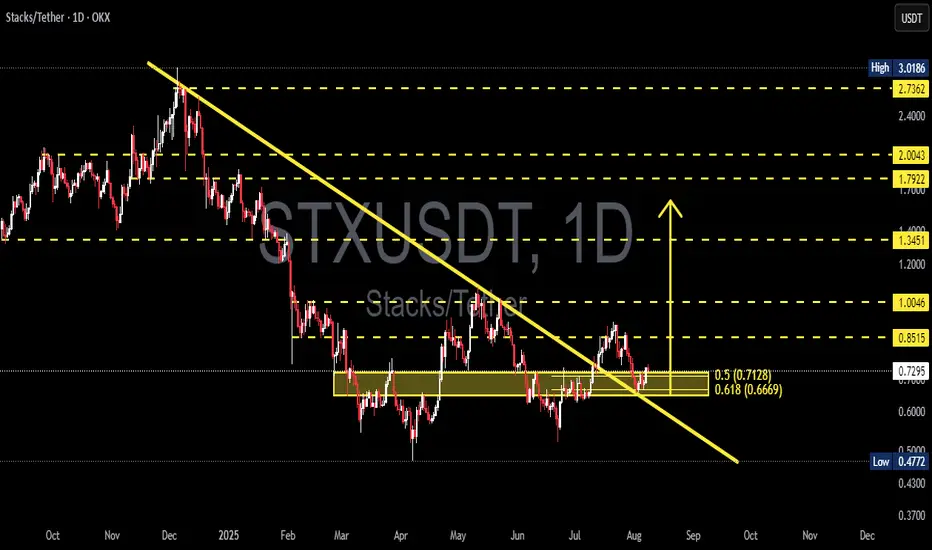
STX/USDT has shown a significant technical breakout after successfully breaching the descending trendline that has acted as a dynamic resistance since early 2025.
Currently, price is retesting a key support zone, which was a former resistance level—indicating a possible flip to demand and validation of the breakout.
---
🔹 Key Zone:
Demand zone (yellow box): 0.6669 – 0.7128
(based on Fibonacci retracement levels 0.618 and 0.5)
Current price: 0.7313
---
📈 Bullish Scenario:
Breakout from the descending trendline suggests a potential trend reversal.
As long as price holds above the 0.6669 – 0.7128 zone, upward continuation is likely.
Potential resistance targets:
0.8515
1.0046
1.3451
Extended target: 1.7922, if bullish momentum continues
---
📉 Bearish Scenario:
If price fails to hold the Fibonacci support zone, a deeper correction could follow.
Downside support levels to watch:
0.60 (psychological support)
0.4772 (2025 low)
---
📊 Pattern & Market Structure:
The trendline breakout is the first sign of a structural shift.
A successful retest and formation of a higher low could confirm a new bullish market structure.
The Fibonacci confluence zone aligns with price action support, making it a key decision area.
---
Conclusion:
STX/USDT is showing signs of recovery and a potential reversal after a prolonged downtrend. The breakout is promising, but confirmation will come if the price holds the key support zone. Traders should closely monitor the 0.6669 – 0.7128 region to gauge future price direction.
#STX #STXUSDT #CryptoBreakout #TrendReversal #FibonacciLevels #TechnicalAnalysis #Altcoins #CryptoTA #SupportResistance #PriceAction
Stxusdtlong
STX/USDT Weekly Outlook Golden Accumulation Zone
📌 Overview:
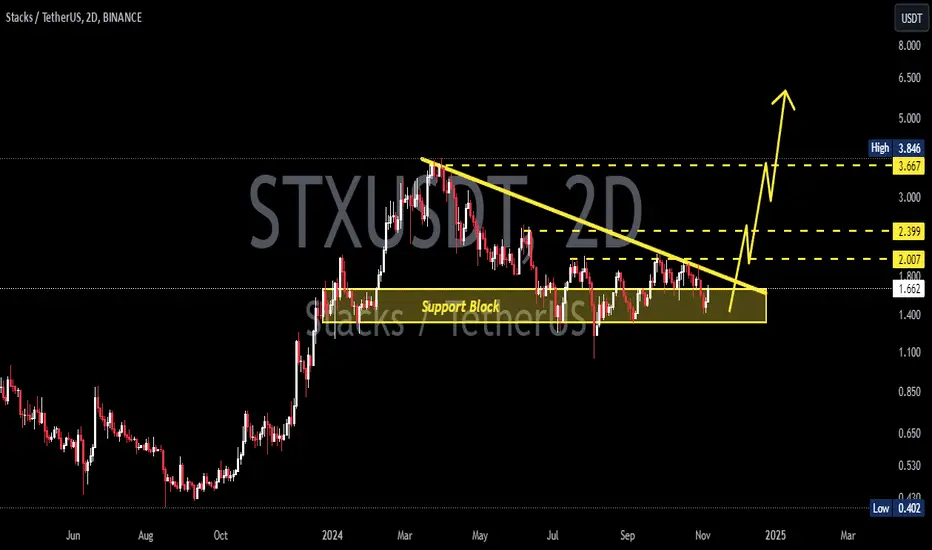
STX (Stacks) is currently retesting a crucial demand zone in the $0.63 – $0.72 range — the same area that previously served as the launchpad for a massive rally toward the $3.80 highs. This chart highlights a strategic opportunity for swing traders and long-term investors who understand market cycles.
🧠 Price Structure Insight:
A well-established demand zone (highlighted in yellow) has acted as a base of accumulation since late 2022 through mid-2023.
Price is now consolidating above this zone, suggesting a potential bullish reversal.
A potential Double Bottom pattern is forming, with a neckline around the $1.00 level — a breakout above this could spark a significant bullish impulse.
🟢 Bullish Scenario (Upside Potential):
If STX maintains support and bounces from this accumulation zone, we could see a stair-step rally toward the following targets:
1. $0.90 – $1.00 → Psychological resistance & neckline of reversal pattern
2. $1.2975 → Historical supply and consolidation area
3. $1.9447 → Previous lower-high resistance zone
4. $2.20 – $2.71 → Key Fibonacci retracement levels from prior highs
5. $3.66 – $3.84 → All-Time High resistance, long-term bull target
🔍 A confirmed weekly close above $1.00 would significantly strengthen the bullish thesis and validate the reversal structure.
🔴 Bearish Scenario (Downside Risk):
If price breaks down below $0.6380, this could invalidate the current structure and lead to deeper corrections, targeting:
$0.45 → Minor support from early 2023
$0.20 → Historical macro bottom and extreme support
❗ A breakdown below this accumulation zone could trigger a longer-term bearish continuation.
🔄 Strategic Trading Notes:
This is a high-probability reversal zone, ideal for gradual accumulation (DCA) or swing entries with tight stop losses below support.
Watch for a spike in volume as a signal for institutional or smart money involvement.
Confirmation from bullish candlesticks (e.g., bullish engulfing on weekly) could provide additional entry confidence.
📚 Conclusion:
STX is testing a key structural level that previously led to exponential price growth. As long as the $0.63–$0.72 zone holds, the mid-to-long-term bias remains bullish. However, traders should remain disciplined and responsive to any invalidation signals.
#STXUSDT #Stacks #CryptoAnalysis #AltcoinSetup #TechnicalBreakout #WeeklyChart #BullishReversal #AccumulationZone #SmartMoney

STXUSDT 1W Analysis STX ~ 1W Analysis
#STX Buy back gradually from here with a short-term target of at least 20%++.

STXUSDT Potentially BullishWe saw BTCUSDT gain some momentum and this effect is being seen on many ALT coins. BINANCE:STXUSDT is no different!!! At the moment, STX is breaking out of a consolidation phase on the Daily TF. Will this breakout mean #STXUSDT is regaining its bullish momentum? That remains to be seen, However a close above the 0.78 will likely bring us into the bullish phase.
Until then, fingers crossed.
Do your analysis before taking any trade, results are not typical, past results does not guarantee future results

STXUSDT Potentially BullishBINANCE:STXUSDT is beginning to take shape and is looking good to go long. Broken the consolidation phase and retested it. The bulls are setting in however, we just might see the market slow down around the 1.152 area which turns out slightly below the EMA 200 and also aligns with a resistance point on the weekly TF. On futures trade, I will target this area while i will lock down some profits on my spot trading at this point.
This is not a trade advice as such do your due diligence
Past results does not guarantee future results

#STX/USDT#STX
The price is moving within a descending channel on the 1-hour frame, adhering well to it, and is heading for a strong breakout and retest.
We are experiencing a rebound from the lower boundary of the descending channel, which is support at 0.600.
We are experiencing a downtrend on the RSI indicator, which is about to break and retest, supporting the upward trend.
We are looking for stability above the 100 moving average.
Entry price: 0.670
First target: 0.691
Second target: 0.714
Third target: 0.739

STXUSDT 1WSTX ~ 1W Analysis
#STX Buy gradually from here if you still have a Conviction on this coin with a short -term target of at least 20%+.

STX 1$ Resistence ZoneBINANCE:STXUSDT
✅Before we start to discuss, I would be glad if you share your opinion on this post's comment section and hit the like button if you enjoyed it. Thank you.
Possible Targets
➡️globally we came in to -0.27 Zone (usually play like accumulation zone for investors)
➡️Main support area in case if BTC drop again to test 19-17K STX should hold 0.30 cent
➡️ We going out of global downtrend line since November 2021
➡️ Next resistance zones where we can going down again marked on chart
➡️ Main resistance zone and psychological level is 1$ where I think we will find huge sales and come back to test main support zone in September-October again.
Hope you enjoyed the content I created, You can support with your likes and comments this idea so more people can watch!
✅Disclaimer: Please be aware of the risks involved in trading. This idea was made for educational purposes only not for financial Investment Purposes.
* Look at my ideas about interesting altcoins in the related section down below ↓
* For more ideas please hit "Like" and "Follow"!

STXUSDT 1WSTX ~ 1W
#STX if you still have Conviction on the coin,. This support block would be a very good buying place for now,. Target at least 20%+ from here.

The Future of STXUSDT: A Look at the Key Catalysts - Stacks◳◱ On the BINANCE:STXUSDT chart, the Bband Breakout pattern suggests a consolidation phase that could precede a trend continuation or reversal. Traders might observe resistance around 2.817 | 3.178 | 3.998 and support near 1.997 | 1.538 | 0.718. Entering trades at 2.49 could be strategic, aiming for the next resistance level.
◰◲ General Information :
▣ Name: Stacks
▣ Rank: 56
▣ Exchanges: Binance, Kucoin, Gateio, Mexc
▣ Category / Sector: Infrastructure - Smart Contract Platforms
▣ Overview: Stacks (formerly Blockstack) provides software for internet ownership, which includes infrastructure and developer tools to power a computing network and ecosystem for decentralized applications (dApps). Its focus is to replace the reliance on centralized cloud service providers and apps that harvest and monetize user information. The Stacks network allows users to directly own digital assets like usernames, domain names, computer programs, etc. On the Stacks blockchain, computing is done on the edges (i.e., client devices), and applications on the platform store data individually and use the blockchain only when necessary.
◰◲ Technical Metrics :
▣ Current Price: 2.49 ₮
▣ 24H Volume: 85,569,157.492 ₮
▣ 24H Change: 3.063%
▣ Weekly Change: 2.63%%
▣ Monthly Change: 25.12%%
▣ Quarterly Change: 68.55%%
◲◰ Pivot Points :
▣ Resistance Level: 2.817 | 3.178 | 3.998
▣ Support Level: 1.997 | 1.538 | 0.718
◱◳ Indicator Recommendations :
▣ Oscillators: NEUTRAL
▣ Moving Averages: STRONG_BUY
◰◲ Summary of Technical Indicators : BUY
◲◰ Sharpe Ratios :
▣ Last 30 Days: 3.91
▣ Last 90 Days: 2.21
▣ Last Year: 1.28
▣ Last 3 Years: 0.53
◲◰ Volatility Analysis :
▣ Last 30 Days: 1.01
▣ Last 90 Days: 1.00
▣ Last Year: 1.12
▣ Last 3 Years: 1.17
◳◰ Market Sentiment :
▣ News Sentiment: N/A
▣ Twitter Sentiment: N/A
▣ Reddit Sentiment: N/A
▣ In-depth BINANCE:STXUSDT analysis available at TradingView TA Page
▣ Your thoughts matter! What do you think of this analysis? Share your insights in the comments below. Your like, follow, and support are greatly valued and help sustain high-quality content.
◲ Disclaimer : Disclaimer
The content provided is for informational purposes only and does not constitute financial, investment, or trading advice. Always conduct your own research and consult a qualified professional before making any financial decisions. Use of the information is solely at your own risk.
▣ Explore the Power of Charting with TradingView
Unlock a wide range of financial analysis tools, data, and features to elevate your trading experience. Take a tour and see the possibilities. If you decide to upgrade your plan, you can receive up to $30 back. Discover more here - affiliate link -

#STX/USDT / Ready to go up#STX
The price is moving in a descending channel on a 1-day frame and sticking to it well
We have a bounce from the lower limit of the descending channel, this support is at 1.46
We have a downtrend, the RSI indicator is about to break, which supports the rise
We have a trend to stabilize above the 100 moving average
Entry price 1.78
First target 2.00
Second target 2.23
Third target 2.50

STXUSDTSTX ~ 2D
#STX So far it continues to maintain this support Block. Buy gradually on this support block,. with a minimum target of 15%++. If you have Conviction on this coin.
5x Potential Gains on STX From Here (Fibs, Channels & More)STX has been looking good and in a nice upward trending parallel channel since Dec 2022.
Just trading that channel would have yielded some great returns, but we can also look to the Fibonacci retracement from the previous high to low, which we can see exactly forecast the next high as shown in the video.
From there, we can run the Fib tool from the most recent high to low, which we seem to be coming out of in the ower edge of the bullish channel, giving us a $10 price target (5x).
This coincides with the fractal I took from the last bullish pump to the previous high, and it looks like this is a viable path to $10, judging from the rounded bottoming pattern and the 50 day EMA turning higher.
Let me know what you think of this video, leave a comment, and if I get 10 likes I'll try to do more of these weekly if not daily!
More information is in my bio, and I'd love to hear your thoughts on this study 🚀

STXUSDT Triangle BreakoutSTXUSDT technical analysis update
STX is breaking the symmetrical triangle resistance with high volume, and the price is trading above the 100 EMA on the daily chart. This is considered a strong bullish signal for STX.
Buy zone: Below $1.75
Stop loss: $1.55
Regards
Hexa

STX USDTSTX is currently in a bearish trend and has been moving within a descending channel for approximately 157 days. The chart clearly shows the price making lower highs and lower lows, respecting the boundaries of this channel.
At the moment, the price is positioned near a critical juncture where it could potentially break out of this descending channel, signaling a reversal. For a bullish move to occur, STX must break above the channel’s upper boundary. This resistance has acted as a barrier to the price, preventing any significant upward movement.

STXUSDT 2DSTX ~ 2D
#STX Best strategy for COINBASE:STXUSD , Buy on breaking out of this descending pattern, or buy in the demand zone.

STXUSDT: Previous Resistance Acting as Strong SupportSTX technical analysis update
STX's price is bouncing from its major support level, with the previous resistance now acting as strong support. Above this support zone, the price has formed a descending channel and is currently trading within it. The price is now moving toward the channel resistance, potentially setting up for a breakout.
Regards
Hexa

STX Potentially BullishNASDAQ:STX is still attempting to reclaim the bullish momentum and so far, the 1.760 zone (Previous Resistance now turned support) seems to be holding. A further bullish push just might lead the start of another bullish push.
This does not completely rule out the possibility of another dip in the market. As long as the now found support holds, the bulls will take the lead otherwise, the bears will dominate. I will keep an eye on this closely. Expect updates on #STX as market reveals itself more.

#STX/USDT#STX
The price is moving within a bearish channel pattern on the 12-hour frame, which is a strong retracement pattern
We have a bounce from a major support area in green at 1.25
We have a tendency to stabilize above the Moving Average 100
We have a downtrend on the RSI indicator that supports the rise and gives greater momentum, upon which the price is based higher at the discount
Entry price 1.36
The first target is 1.66
The second goal is 1.91
Third goal 2.20

STX is one of the best coins now...Why? Because it follows BTC so well.
If BTC pumps, STX will also perform well, saving and growing your portfolio. Additionally, it is a fundamentally solid project.
Targets are on the chart.
Invalidation: if the price stays below $1.30 and fails to reclaim it.
Long-term hold until May 2025.

STX Potentially BullishWe have seen over time how the crypto market has created some lows. Are we going to be seeing some bullish push ahead of the crypto convention next month? On the TA side, market is looking like it is ready to make another push upward, however I will want to see some bullish move to confirm that the retest is completed on the H4 TF.
Until then, fingers crossed.
Long term, I'm going long

#STX/USDT#STX
The price is moving within a descending channel pattern on the 12-hour frame, which is a retracement pattern
We have a bounce from a green support area at 1.80
We have a tendency to stabilize above the Moving Average 100
We have a downtrend on the RSI indicator that supports the rise and gives greater momentum
Entry price 1.84
The first goal is 2.20
The second goal is 2.45
The third goal is 2.70

STXUSD 1DSTX ~ 1D
#STX In the event of a retest of this pattern's support line, This is a very good buy. with a minimum target of 15%+
