GOLD(Monthly) Decision Time
Everyone is Busy with Daily and Hourly charts,So I have stepped back and trying to shed some light on Monthly as it is at a very Crucial Decision point.
Falling Trend line from all time Highs we hit in 2011 is here to decide the faith of Gold ;)
Short Term Correction at least to $1200 is expected in coming month or two, it may not come in light of some Big Global Risk event.
Big Supply zone at $1500 - $1600 which is also a important Fib level.
Best Demand Zone from a Decade perspective is lying at $980 - $890 which again is a important fib level.
Medium Term Traders Look to Buy around $1200 levels and look for break of the falling trend line.
Long Term Investors should Buy around the marked Demand Zone as it will offer them best risk to reward ratio.
I hope i have not disappointed anyone neither Bulls Nor Bears :) I have something for everyone ;)
Take Care
Success

GOLD(Monthly) Decision Time
Everyone is Busy with Daily and Hourly charts,So I have stepped back and trying to shed some light on Monthly as it is at a very Crucial Decision point.
Falling Trend line from all time Highs we hit in 2011 is here to decide the faith of Gold ;)
Short Term Correction at least to $1200 is expected in coming month or two, it may not come in light of some Big Global Risk event.
Big Supply zone at $1500 - $1600 which is also a important Fib level.
Best Demand Zone from a Decade perspective is lying at $980 - $890 which again is a important fib level.
Medium Term Traders Look to Buy around $1200 levels and look for break of the falling trend line.
Long Term Investors should Buy around the marked Demand Zone as it will offer them best risk to reward ratio.
I hope i have not disappointed anyone neither Bulls Nor Bears :) I have something for everyone ;)
Take Care

CADJPY Short#CADJPY the lower highs indicate that this pair is going through a down trend. The EMA is a major confluence with regards to downside movement as the 7 EMA below the 50 EMA indicate that the market is in a long term downtrend, this is followed by the 3 EMA being below the 7 EMA which indicates that the market is in a short term downtrend. The short long term down trend followed by the short term down trend means that the probability of downside movement increases!
This pair has also gone through a small phase of trending sideways (ranging market). Now this pair is approaching key levels as it has broken the support zone and has broken out of trending sideways. The daily candle being an 'up day' shows that price has had a chance to pull back, giving traders a great chance to get in the downside movement. A break of 79.2 is the target.

BA Short when SPY cracksTook a multiple lane set-up with compression on the bollinger bands. Used the 5ma as the trailing stop.

Intraday accumulation phase in progressI found volume spike (selling climax) in the background. The very next bar was up bar in a high volume (reversal up-thrust). This must be that demand overcame supply and that there are more buyers then sellers. Later on , we saw a successful test of supply on low volume, which is the sign that smart money is interesting in upward price. Wyckoff called this background accumulation phase. My advice is to watch for buying opportunities on the dips. First take profit level is set at the price of 1.1400. Second take profit level is set at the price of 1.1460. Of course, I will fallow price action ana volume to see if we got signs of weakness. In the case, i will close position earlier.


Cypher Pattern , Usd/Chf, 15minHere we see a cypher pattern on the Us Swiss charts.
This pattern is indicating that the market will reverse upon completion, and is supported by completing above the linear regression line.
When a Bearish pattern completes above the standard deviation line, it is likely that , If the market is bearish, the market will rally back under the line , and similar to a price action trade, come near the negative deviation line.
I have forecast the market to touch the negative deviation line , which comes out to about 4 hours from now, but it is more likely to take longer and not actually reach the deviation line, but rather just cross the linear regression taking 2 days and 7 hours.
With that said, i have placed my usual actions as the following:
Entry: point B
Limit : 1.618 extension of the BC leg
Stop: point X
Thanks for checking this out, look forward to you comments and likes, as always follow for my predictions!
Thanks and Good Trading!

Butterfly Pattern , Eur/Jpy, 30 minhere we see a Butterfly pattern forming on the Euro against the Yen.
If the pattern makes it above 136.025, the pattern will be complete, in which case i have places my entry at point B , my limit at the 1.618 extension of the BC leg , and my stop at the Red D point, because at that point , we are at roughly a 2:1 risk reward ratio, also because I am going to walk away, and if the market crosses 136.025, but doesnt make it the the Black point D, I don't want my stop further out then that structure.
I have used the linear regression line as support for my Hypothesis, the chart will show you a linear regression of the last 200 moves,(or the last 100 on the hourly). The idea here is that the harmonic is also in sync with the price action style trade, giving me a better chance at correctly identifying the next move.
Thanks for tuning in, please leave me some tips, advice, or just a plain old thumbs up! AKA like comment and follow:)
Thanks again, Good Trading

Cyhper Pattern, CAD/JPY, 30minHere we see a completed Cypher pattern on the Canada japan charts. The pattern suggest a continuation in downtrend and appears to be respecting the linear regression.
I believe that the market will rally down into the 1.618 extension of the BC leg before consolidating again, or reversing.
I have placed my entry at current market price, my stop is at the highest high of the pattern and my limit is at the 1.618 extension of the BC leg.
Check back in to see the results, as always thanks for checking this out, please like comment and follow if you agree.
Thanks and good trading!

#USDJPY Short Idea (Butterfly, Harmonics, 200sma)#USDJPY Short Idea (Butterfly, Harmonics, 200sma)
@TradeYodha
TradeYodha.com
Further my analysis which resulted in very good profits:
Analysis:
1. On higher time frame it is ultimately forming Head and shoulders pattern
2. 10 sma has gone past 200 sma and 50 sma showing high downward momentum
3. Price is not stretched away from 10 sma indicating the transition coming back to it will be slower
4. 200 sma in the zone
5. zone has 38.2 retracement level of current leg
6. If the price retraces from the zone, it may form a butterfly patter for very good targets
Trade Execution:
1. Have 3 orders
2. First order will be a limit order with approx 1:1 R/R ratio
3. Second order and the third order will be put in if we get a confirmation in the zone
4. Second order have target of 127.2 extension
5. Third order will have target at the completion of butterfly pattern at 161.8 level.
News/Fundamentals:
27 April: 1:45pm USD Flash Services PMI
27 April: 11:50pm JPY Retail Sales y/y
28 April: 2:00pm USD CB Consumer Confidence
I would love to hear your opinion, feel free to agree or disagree in your comments. Please give it a (thumsup) if it makes any sense.

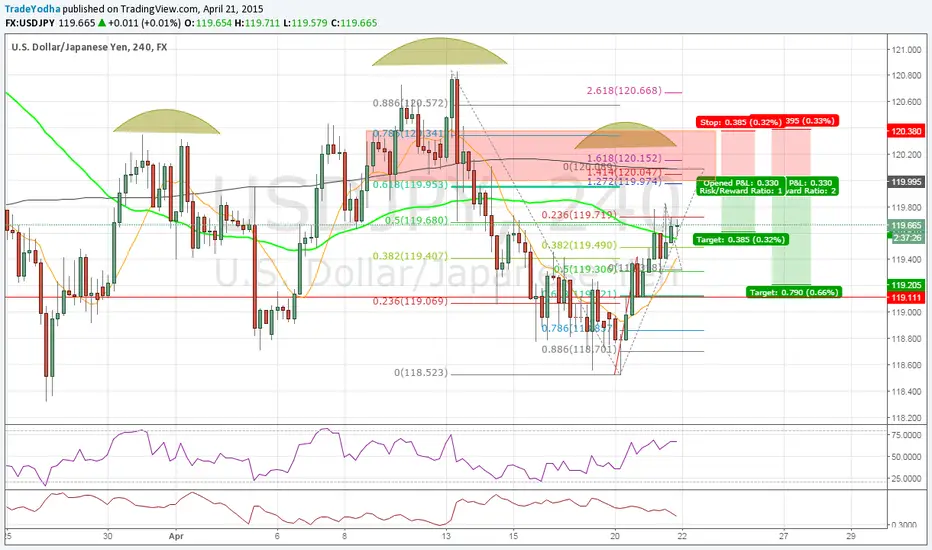
#USDJPY Short Idea (Structure, Fibonacci, Head and Shoulders)#USDJPY Short Idea (Structure, Fibonacci)
@TradeYodha
TradeYodha.com
1. Is Daily chart showing us a possibility of H&S (Head and Shoulders) forming?
2. on 4H zone we have 200sma. The price has closed above 50sma so the next target can only be 200sma
3. 200sma is in an important area where there is a lot of fib confluence indicating formation of advanced patterns
4. The price is close to 70 RSI at the moment so there are chances for it to go over bought by the time it reaches the zone.
News/Fundamentals Expected:
21 April: 11:50pm JPY Trade Balance
23 April: 12:30pm USD Unemployment Claims
I would love to hear your opinion, feel free to agree or disagree in your comments. Please give it a (thumsup) if it makes any sense.
#NZDUSD Multiple Opportunities 4H/1H (Gartley, Structure)#NZDUSD Multiple Opportunities (Gartley, Structure)
@TradeYodha (TradeYodha.com)
1. 4H can form a Gartley Pattern but point B is a good support area so we can have a bounce from there too. It has 200sma in it.
This gives us 2 opportinities for Long. First at point B and second at D
2. Point B can be seen in 1H chart as lower zone. We can target 1:1 R/R
3. 1H is in downtrend and on 1H chart 50 sma is lagging behind which can attract the price to it creating a short opportunity. Take 1:1 R/R with extended targets into lower zone where we will take our long opportunity
I would love to hear your opinion, feel free to agree or disagree in your comments. Please give it a (thumsup) if it makes any sense.

#GBPCAD 4h Short (Fib, structure retest)@TradeYodha
TradeYodha.com
GBPCAD 4h Short Opportunity
1. Structure retest
2. FIB 38.2 level confluence with 161.8 fib extension
3. 50 sma in the region
Beware of the round price level 1.91000 close. Price can retest that and fall
Hope this give you some useful ideas, don't forget to hit the like button :) Thanks
Remember- Plan your battle well in advance and win.
