SUGAR, at the test of the Simple Moving Average 89SUGAR, at the test of the Simple Moving Average 89
SUGAR, at the test of the Simple Moving Average 89
, at 14.32 on the future SBV2017,
in case of daily closing over 14.32, the big speculators will enter long
making a raise with targets around 16 cents.
SUGAR SBV17 - Oct '17
CROC X1 - Supports / Resistances - Multiday (TF - 1H)
R3 = 16.17
R2 = 16.05
R1 = 15.53
PIVOT = 14.82
S1 = 14.10
S2 = 13.89
S3 = 13.85
CROC X3 - Last Signal (Long Term - TF 1D)
LONG from 13.67
since 09/06/2017
Sugar


Sugar Long - finally bottoming?Nice candle today if gains hold. First minor downtrend broken. Oversold on larger timeframes (daily, weekly, even monthly)
COT bullish -> MM / Large Specs short, Commercials long
Wait for current extreme to cool down ~ +5% and look for long entry. SL below the lows.
Good Trading!

SUGAR Commodity LONG- Advanced Pattern formation of Bat completion at D leg at 88% fib
- Structure to the left
- Potential double bottom at daily chart
- Fundamental news of 2017 May of Sugar and World Markets and Trade stating record global production keeps consumption of Sugar near record high.
- RSI divergence upwards


Sugar (SB1) should be close to completing wave 3 I'm looking for wave 3 to complete at 12.67, where wave v of 3 will be 61.8% the length of wave i thru wave iii subtracted from the top of wave iv. It should just be a matter of time before wave 3 completes and a corrective rally in wave 4 takes over.
As the correction in wave 2 corrected a large part of wave 1, we should expect wave 4 to only correct a minor part of wave 3. A 38.2% correction of wave 3 will see wave 4 moving up to 16.03 before turning lower again in wave 5 towards 9.98.
Regarding the corrective pattern of wave 4 it should turn into either a flat or a triangle to alternate from wave 2.

Sugar: Potential trend reversalI am looking at Sugar futures here, it looks like we could be seeing an interesting rally coming out of this recent drop.
Oil rallying certainly lifts all commodities , and I think this one offers a particularly nice risk/reward. Ideally you can wait for a new 'Time at Mode' signal to enter, or just rush into it at the open, and then add when applicable.
Best of luck if entering longs.
Cheers,
Ivan Labrie.

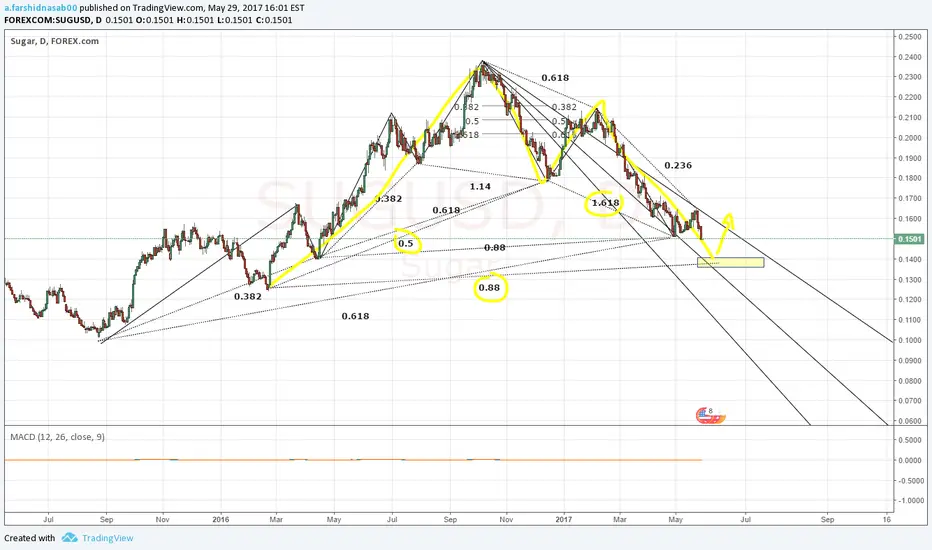


SUGAR (SUGARUSD) long setup- Completion of a bat pattern
- The entry point @ 0.15045 lines up exactly with previous support line. The support line is highlighted by price behaviour in the blue rectangles


SugarRejection at support zone with a pin bar last Friday.
Possible bounce next week to test 0.1950, at least. Potential R is less than 2 if buying at break on pin bar high. A tempting trade nonetheless.


Sugar Could Break down Notice, Daily chart exhibits a substantial H&S pattern. If the daily neck-line is broken sugar prices could drop significantly from here.
Daily:
Notice the monthly impulse targets a retracement at the same length of the daily H&S pattern.
Multi-Month/Twenty Year Chart:

Sugar May Complete a Bearish Bat PatternI will look for confluence with indicators at the entry point -- as of now if price continues to rise from here to the completion point I will take this trade.

SUGAR, DAY CHART, SHORT (18-FEB-2017)There is a consolidation pattern near the
Resistance Zone.
From the price action, we can see stronger
selling pressure than buying pressure.
If the price managed to break the buyers' stop loss
level, we expect the price will fall further lower.
Here are 2 trading plans for you:
1. Wait the price to break the buyers' Stop Loss level
and entry
2. If the price pull back weakly to the resistance zone,
it might be a good opportunity to short with bearish
signal
