SUI still has potential for the gains, and here's why:Sui is the most popular layer-1 token, which has displayed immense strength within a short time frame. The price recovered from the losses and also formed a new ATH that displayed the huge confidence of the bulls over the token. Although the price has been facing massive bearish pressure due to increased sell-offs, in the long term, the token is believed to trigger a fine ascending trend.
The SUI price is facing massive upward pressure, which has compelled the price to plunge by over 18% from the highs. In times when a quick rebound is expected, the technicals suggest the price may continue with the prevailing trend and reach the local support at 0.618 FIB at $1.61. The bulls may display some strength and hold the rally above $1.6, which may further trigger a rebound. The DMI, which is close to undergoing a bearish crossover, validates the upcoming downtrend.
However, the volume suggests a fresh influx of liquidity could be fast approaching as it has reached the ground levels after marking the highs. Hence, the bears seem to have extracted their profit that could further allow the bull to thrive and push the price above $3. Meanwhile, the other layer-1 tokens, like SEI, Aptos, & Solana, may also be considered for the upcoming bull run, as the trader’s confidence in the token appears to have remained unchanged regardless of the prevailing bearish influence.
SUI

suiThe green box is vital
There is a small resistor on top
Considering the weekly conditions, I expect a small support from the box for now, and if it breaks the lower green lines

10/22 Triple divergence is playing out. How deep?Overview:
The AMEX:SPY closed down by only 0.16%, despite opening lower than Friday’s close. During the second trading hour, the index dropped 0.5% but managed to recover the losses throughout the day. Only a few AMEX:SPY stocks ended in the green, with Nvidia gaining 4.14%. Despite this minor pullback, the index has seen six consecutive weeks of growth, and one red weekly candle wouldn't derail a bull run that has gained 23% since the start of the year.
The tech-heavy NASDAQ:QQQ also closed in the green, up 0.19%, thanks to Nvidia’s boost.
The U.S. Leading Indicator Index (LEI) fell by 0.5% month-over-month to 99 in September, a steeper decline than the expected -0.3% and more significant than the -0.2% drop in August, according to The Conference Board’s report on Monday. From March through September 2024, the LEI dropped 2.6%, exceeding the 2.2% decline in the previous six-month period.
"Weakness in factory new orders continued to be a major drag on the US LEI in September as the global manufacturing slump persists," said Justyna Zabinska-La Monica, senior manager of Business Cycle Indicators at The Conference Board. "Additionally, the yield curve remained inverted, building permits declined, and consumers' outlook for future business conditions was tepid."
This index has been decreasing since March 2022, and Monday’s reading officially places it below its lowest point during the COVID-19 period in April 2020. However, the rate of decline appears to be slowing.
Meanwhile, companies are still reporting better-than-expected earnings. Some well-known names reporting today include GE Aerospace (Boeing's engine supplier), Philip Morris, Verizon, General Motors, 3M, Enphase, and Invesco (owners of the QQQ ETF).
The CME Watch Tool now shows an 11.1% chance of no rate cut on November 7th, up from last week’s 9.3%.
While BTC dropped 2.40% on Monday, BlackRock still bought $329 million worth of BTC ETFs. It’s almost amusing to think that BlackRock could be acting as someone’s exit liquidity. The firm now owns 362,192 bitcoins, valued at $23.169 billion.
BTC TA:
W: Unfortunately for the bulls, BTC closed last week at $69k, which is below the highs of the last two bullish waves in late March and early June.
D: Monday ended with a 2.40% correction—much needed after last week's strong rally. A timely release of pressure increases the likelihood of the bull run continuing. An important level to maintain is $66.9k, as it’s the point of control for this recent rally starting from October 10th. The next support levels are $65.8k and the key yearly support at $62.7k. Breaking below $62.7k would invalidate the current bullish wave. On the bearish side, Monday’s candle engulfed the previous five trading days (including the weekend). Before the pullback, the RSI hit 70.
4h: As we spotted and wrote about in our previous letter - the 4-hour chart showed MACD, CVD, and RSI divergences, with three consecutive declining peaks as the price continued climbing. The correction began on Sunday evening, and it may take more than a day to fully play out. The key level to hold now is $66.8k—if it breaks, the price may fall to the daily level of $65.8k. So far, it’s holding.
1h: The 1-hour chart looks bullish, as the $66.9k level is holding, with some bullish MACD and RSI divergence showing.
Alts Relative to BTC: ETH, SOL, and NEAR have not declined as much as BTC. However, SUI has dropped more significantly by 5%, and TAO by 9%. APT is unexpectedly pumping, while DOGE is up by 27.30%. Seems like alts are diverging from BTC correction. At least the aren't collapsing 7 - 10%, which was the case in the past with BTC falling by 2.4%.
Bull Case: BTC could be correcting slightly before resuming the bull run. If a recession is avoided, Trump wins the election, and rates are cut, the outlook remains positive.
Bear Case: BTC may have reached an old resistance level without breaking it, confirming it as a solid resistance, and initiating a deeper correction.
Fear and Greed Index: The index is back to Neutral at 57, down from the Greed territory of 60 over the weekend.

SUIUSDT: Restesting ATH Support—Bull Run Resuming Soon!BINANCE:SUIUSDT is currently retesting its all-time high support and is poised to resume its bull run from here. After a healthy consolidation following the ATH breakout, it’s time for take-off! As a strong layer 1 blockchain with a robust community backing it, I’m expecting new ATHs in the near future. Keep an eye on this one!
BINANCE:SUIUSDT Currently trading at $2.14
Buy level: Above $2.1
Stop loss: Below $1.69
TP1: $3
TP2: $4.5
TP3: $6
TP4: $7
Max Leverage 3x
Follow Our Tradingview Account for More Technical Analysis Updates, | Like, Share and Comment Your thoughts

10/17 Give us a healthy pull back. Overview:
The AMEX:SPY continues its upward trajectory, hitting new all-time highs. The bullish momentum is supported by more companies exceeding earnings expectations this week. Despite rising unemployment and persistent inflation, corporations are posting record profits. It’s a reminder that the stock market and the economy don’t always move in sync.
The NASDAQ:QQQ , representing big tech, is hovering near its all-time high but struggling to break through. The Federal Reserve reported fewer initial jobless claims at 241k, a decrease from last week, but still higher than the average over the last three years. The CME Watch Tool now indicates a 9.3% chance of no rate cut in the next meeting on November 7th, influenced by these labor market figures.
Meanwhile, a surge in BTC ETF purchases has been observed throughout the week. Yesterday, BlackRock acquired $309 million worth, nearly tripling its average of $117.4 million. This marks their fourth consecutive day of buying. Even Grayscale joined the action. Altogether, $1.854 billion flowed into BTC ETFs this week. This could either mark the peak of the sixth bullish wave or set up a breakout from the year-long bullish flag pattern. BTC saw an 8% rise this week, making it one of the top five best-performing weeks of the year, including February's pump following BTC ETF approval. However, the volume remains lower than expected. For a full trend confirmation, we need institutional whales to join in. If we are indeed breaking out of the bullish flag, the volume should match levels seen at the beginning of the bull run in October and November 2023, when weekly volumes were 80-100% higher than this week.
BTC Technical Analysis:
W: On the weekly chart, BINANCE:BTCUSDT candle wick has reached July's open and close but hasn't tested its highs around $70k. A close above $68.2k this week would be a bullish signal. We still have Friday, but the weekend isn’t likely to bring much action.
D: BTC has been at the upper Bollinger Band for four consecutive days without any correction or pullback. The candles are reminiscent of the week of September 3rd, which saw an 8.5% pump, followed by a fake breakout and an additional 4.54% rise before a sharp decline wiped out all gains within ten days. A healthy pullback could target the $64-68k range—but of course, the bullish sentiment says, "No pullbacks on the way to the moon!"
4h: The current pump started at the key 2024 level of $62.7k, rising in three waves. The third push had lower volume, signaling a price-volume divergence. RSI has exceeded 70 twice and is now trending down, showing divergence with the price. On-Balance Volume (OBV) and Cumulative Volume Delta (CVD) also indicate divergence. Without a clear shooting star candle with high volume, nothing is confirmed yet. We might see some sideways action over the weekend before a possible breakout on Sunday evening.
1h: Bearish.
Alts Relative to BTC: ETH, SOL, and NEAR are showing weakness. None have reached their July peaks like BTC, and they have all pulled back after this week’s pump. Quick question: Does MKR have a bottom?
Bull Case: If we continue breaking out of the bull flag, the pump could extend into next week, with potential gains of another 6-8%. If Trump wins and crypto rallies, rates could be cut in November and December, bringing them down to 4.25-4.50%.
Bear Case: We could continue oscillating within the $58-70k range, and we are currently at the upper end.
Fear and Greed Index: Currently at 58, still Neutral, but it touched the Greed level of 60 yesterday.

Example of conditions for Chase the Rally
Hello, traders.
If you "Follow", you can always get new information quickly.
Please also click "Boost".
Have a nice day today.
-------------------------------------
(SUIUSDT.P 1D chart)
It is necessary to check whether it can fall from the 2.2492 point and rise with support near the HA-High indicator (2.0299) on the 1D chart.
Since the StochRSI indicator has entered the oversold zone, it is showing a strong downward trend.
Therefore, it is highly likely that it will continue to fall further, so caution is required when trading.
If it falls below 2.0299,
1st: 1.8735-1.9073
2nd: 1.6124
You need to check whether there is support near the 1st and 2nd above.
Therefore, from a short-term and medium-term perspective, if the price is maintained above 1.6124, it is a time for additional purchase.
In other words, I think it is a time when Chase the Rally is possible.
At this time, if the Mid (50) line or HA-Low indicator is created and shows support, it will give you strength to proceed with additional purchase.
-
The important thing to proceed with Chase the Rally is that the long-term moving average line is in a regular array.
If not, it should be considered as a purchase, not Chase the Rally.
In this chart, the M-Signal line of the 1W and 1M charts corresponds to the medium- to long-term moving average line.
--------------------------------------------
(1h Chart)
If you touch the 5EMA of the 1D chart or the M-Signal of the 1D, 1W, 1D chart, there is a high possibility of volatility.
Therefore, you can start trading depending on whether there is support around here.
However, since the 5EMA of the 1D chart or the M-Signal of the 1D, 1W, 1D chart is for viewing trends, you should draw support and resistance points on the 1M, 1W, 1D charts and check whether there is support around those points and respond.
Since the current chart is a 1h chart, if there are no support and resistance points drawn on the 1M, 1W, 1D charts, you can start trading with the support and resistance points of the 1h chart.
However, a short and quick response is required.
-
The StochRSI indicator is showing signs of forming a double top.
Therefore, if it falls below 2.088-2.0238, it is likely to touch around 1.8735-1.9073.
If the StochRSI indicator is reset while falling to the oversold zone, and the price maintains around the M-Signal line on the 1D chart, I think it is highly likely to turn upward.
-
Reflecting this movement, it is expected that the trend will be formed depending on which direction it deviates from the box range (1.9752-2.0761) of the HA-Low indicator.
-
Have a good time.
Thank you.
--------------------------------------------------
- Big picture
It is expected that a full-scale uptrend will begin when it rises above 29K.
The next expected range to touch is 81K-95K.
#BTCUSD 12M
1st: 44234.54
2nd: 61383.23
3rd: 89126.41
101875.70-106275.10 (overshooting)
4th: 134018.28
151166.97-157451.83 (overshooting)
5th: 178910.15
These are points that are likely to receive resistance in the future.
We need to check if these points can be broken upward.
We need to check the movement when this range is touched because it is thought that a new trend can be created in the overshooting range.
#BTCUSD 1M
If the major uptrend continues until 2025, it is expected to start forming a pull back pattern after rising to around 57014.33.
1st: 43833.05
2nd: 32992.55
-----------------

SUI Price Holds Strong Above $2, Eyeing $3The price of CRYPTOCAP:SUI is holding firm above $2, fueling speculation that the altcoin might be gearing up for a significant rally. With growing market confidence and increasing attention from smart money, CRYPTOCAP:SUI could be primed for a breakout run towards $3, with the $2.45 mark serving as a crucial milestone.
Technical Overview
CRYPTOCAP:SUI has experienced a notable 3.71% price increase in the past 24 hours, pushing its market cap closer to $6 billion, currently standing at $5.81 billion. Trading volumes have surged to $928 million, reflecting the heightened market activity and growing interest in the altcoin. The price is now testing support at the $2 mark, an important psychological level, as traders wait to see if CRYPTOCAP:SUI will sustain its upward momentum.
At the time of writing, SUI is trading at $2.03 down 2.41%, bouncing back from the previous low of $1.9745. This bullish reversal increases the likelihood of a Morning Star pattern forming on the daily chart, signaling potential for continued upward movement.
In the 4-hour chart, CRYPTOCAP:SUI is trading within a rising channel pattern, with the price currently retesting the critical $2 support near the trendline. A bullish reversal within this channel suggests that CRYPTOCAP:SUI could soon challenge overhead resistance at $2.45, paving the way for a breakout towards $3.
Is a $3 Breakout Possible?
For SUI to achieve its price target of $3, it must first break through the overhead trendline resistance. Based on Fibonacci levels, the next major target lies at $3, corresponding to the 1.618 extension on the daily chart. This level could become achievable if CRYPTOCAP:SUI clears the $2.45 resistance.
Three days ago, CRYPTOCAP:SUI hit a new all-time high of $2.36, but recent market FUD surrounding a rumored $400 million insider sell-off caused a minor retracement. However, SUI’s foundation has denied these claims, and the market is now regaining confidence in the altcoin.
A key indicator of this renewed optimism is SUI's Funding Rate, which briefly entered negative territory during the FUD, signaling bearish sentiment. However, the Funding Rate has since turned positive, showing that traders are once again taking long positions and betting on a price rebound.
The Balance of Power (BoP) indicator also supports this bullish outlook, as the BoP has shifted in favor of buyers, suggesting that bulls are beginning to outpace bears. As a result, SUI’s price could soon rise above $2.11, setting the stage for a potential new all-time high.
SUI Price Prediction
With SUI holding strong support at $2.05, a renewed push towards $2.36 is likely in the near term. If SUI can break this resistance, a further rally towards $2.55 and beyond could occur, representing a 20% increase from current levels.
However, if bearish sentiment reemerges and sellers take control, SUI may retrace back to $2.05. A break below this level could see the price decline to $1.84, negating the current bullish setup.
Conclusion
CRYPTOCAP:SUI is showing strong technical and fundamental signs of a potential rally, with a $3 price target within reach if current trends continue. While the altcoin is currently benefiting from renewed market confidence, traders should watch key levels like $2.45 and $2.36 closely, as a breakout could signal the start of a major upward move.

SUIUSDT Trading Setup: Order Block Retest with Bullish ContinuatWe’ve identified a compelling trade setup on BINANCE:SUIUSDT , showing potential for bullish continuation. After establishing a solid order block around 0.7700, price action suggests an upcoming retest of this zone, which could be followed by a strong upward move.
Key Levels & Strategy:
Entry Point: The recommended entry lies around 0.7700, a critical order block (OB) zone where demand has previously stepped in. The price has tested this level before, and another successful retest could lead to a bounce upward.
Stop Loss: Risk management is crucial to protect your position:
High Leverage Traders: Consider placing your stop loss at 0.7606, just below the OB, to safeguard against potential volatility.
Low Leverage Traders: Opt for a safer stop loss at 0.7406, allowing more breathing room for the trade to play out.
Take Profits: Scale-out profits at the following levels:
TP1: 0.8088, a minor resistance area where traders could lock in initial profits.
TP2: 0.8360, an intermediate target where previous liquidity zones reside.
TP3: 0.9642, a higher target where bulls could aim if momentum sustains.
Market Sentiment:
The price action is currently forming higher lows, indicative of underlying bullish strength. Additionally, the potential order block retest around 0.7700 gives us a clear entry point, supported by the upward momentum that could push price towards the upper resistance targets. This setup aligns well with the broader market trend, where buyers seem to be taking control after periods of consolidation.

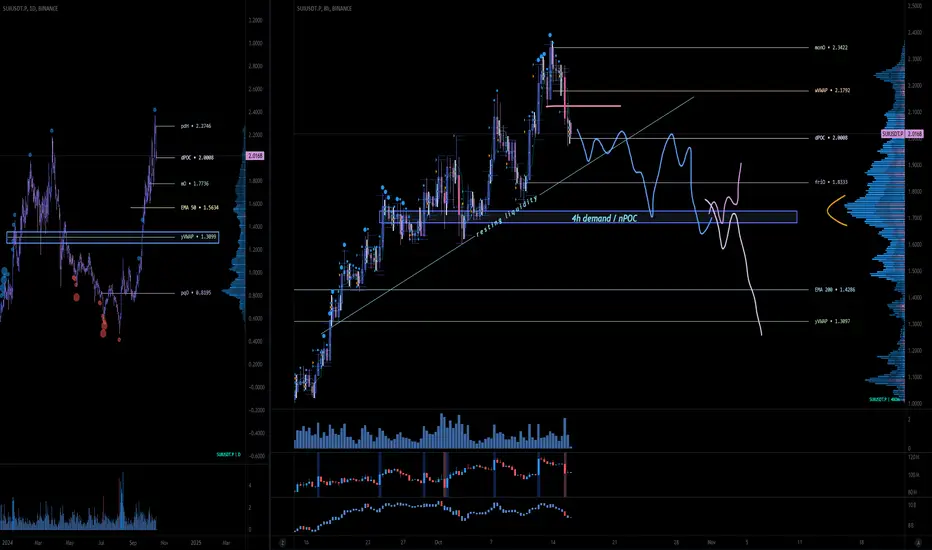
Will $SUI be the next Solana?Amid allegations that “SUI insiders have sold $400M in tokens during this market surge, ” the SUI Foundation responds to address the claims.
The SUI Foundation dispels unfounded FUD, as major centralized exchanges continue to lean heavily on the sell side.
SUI continues to make headway. It has hit a new ATH in Total Value Locked (TVL).
It now processes more transactions than all other EVM-compatible chains.
Will SUI be the next SOLANA?
TECHNICAL OUTLOOK:
It has hit a new ATH, however we're now seeing selling pressure.
SUI significant is at $1.70; in confluence with HVN, nPOC, and 4H demand zone. A break of this level could see a move to around $1.30 (yVWAP) , taking out those resting liquidity on the lows.
#SUI LONG IDEA - POSSIBLE SWING LONG#SUI is the one of the best coin that has bullish momentum currently.
I will be watching to marked 'Long Zone' for possible swing position.
LTF confirmation will be needed in order to open position.
Risk assests are doing good recently but we have still geopolitical risks currently.
Nothing i share is financial advice. Education purposes only.
#Altcoins #Crypto #altcoin #AltSeason2024 #SUI #SUINETWORK

$SUI on the Rise: Multi-Month Trend Active, Targeting $20!Not counting on a full retracement for this move. It might just continue to rise, similar to how CRYPTOCAP:SOL did when it broke above the $30 mark. However, if by any chance it does retrace, one should consider buying anything below the $1.60 level.
I still believe it will go higher and enter a multi-month run closer to the $10 area.
The strength and reaction it just had are similar to CRYPTOCAP:PEPE 's before the massive run in February. Sure, there are different narratives and a significant difference in the timeframe, but it's worth keeping in mind for reference.
If we don’t go any lower—which is the most favorable case—I think the weekly block forming as a bearish candle should be used as an entry level and added to once it breaks above.
So, two scenarios: buying the low or reclaiming the candle’s low if it turns out to be a bearish candle on the weekly timeframe.
Miraculously wait for a retrace into the $1.60 area and buy.
--------
Bi-monthly Mode Active CRYPTOCAP:SUI

10/14 Bull run if THIS level confirmed as supportOverview:
The U.S. observed Columbus Day on Monday, with most businesses closed, but trading activity was still alive and well. The PYTH:SPY closed its fifth consecutive green day, reaching a new all-time high, while the PYTH:QQQ approaches its own record. Due to the holiday, the Federal Reserve didn't release any data, but tomorrow we'll see the Empire State Manufacturing Survey, and by Thursday, we’ll have jobless claims numbers, retail sales, home builder confidence, and business inventory reports.
Interestingly, the CME Watch Tool is now showing a 16.4% chance of no rate cut in November, up from just 10% last Friday. This shift may be in response to an overheated equities market. Meanwhile, Monday saw a wave of buying activity in crypto ETFs, with big names like BlackRock, Grayscale, and even Fidelity getting involved. ETH also caught BlackRock’s attention.
For a more reliable corporate earnings calendar, try this updated tool: finance.yahoo.com
BTC TA:
W: Last week, BINANCE:BTCUSDT opened at $62,810 and closed at $62,845, forming a large indecisive doji candle but managing to stay above the Bollinger Band middle line (BB MA). Throughout the week, the price showed lower highs and lower lows until Asian bulls stepped in on Monday morning. While U.S. traders were off for the holiday, Asian traders pushed BTC past its previous high, stopping just short of the crucial $66,550 mark. Keep an eye on $62.7k—it’s a key level on the weekly, 3-month, yearly, and current bull run (since October 2023) point of control. Anything above this level suggests a potential breakout toward $70k, while falling below it could indicate a bearish trend. To confirm, we need to see $62.7k act as solid support. We’ve already had two fake breakouts, so the chances of another are slim, but not impossible.
D: Over the last four days, BTC quickly moved from the bottom to the top of its Bollinger Bands. Coinbase reported 13.5k transactions on Monday—a strong volume, but not as high as in January or October 2023, when this bull run began. This suggests that larger institutional players are still waiting on the sidelines, watching closely. Despite the Fed’s rate cut and China’s $25 billion stimulus, global liquidity has been declining for the last 29 days.
4h: The RSI has hit 75, indicating an overbought condition. If you pull a Fibonacci retracement, the 0.618 level aligns with $64 k, which also coincides with previous weekly and daily resistance levels. This also matches the October 7th high, forming a critical level of interest.
1h: On Monday at 11 am Shanghai time, a large green candle kicked off a rally. Ten hours later, New York bulls joined the action, extending the pump. The rally lasted 19 hours, pushing BTC up by 6.23%.
Alts Relative to BTC: Altcoins are moving in tandem with BTC, but this rally isn’t as much about alts as it is about Bitcoin. While BTC gained 5%, ETH, SOL, and NEAR only posted gains of 6.x%, and none have reached their previous highs. SUI, APT, and TAO have even corrected slightly after their substantial gains of 100% or more over the last 30-40 days, leaving them room to consolidate.
Bull Case: We’re on the verge of exiting the bull flag pattern. Once the global liquidity index starts rising again, markets will likely be flooded with cheap money, fueling risk-on assets like crypto. A bounce off the $62.7k level will confirm it as support, pushing the bullish narrative.
Bear Case: If we see a third fake breakout, it could trap all the bulls.
Fear and Greed Index: Currently at 56, still in Neutral territory but just 4 points away from Greed.
Prediction: The outlook remains bullish, provided we don’t see another fake breakout, and $62.7k can be established as a solid support level.

SUI - trend stoped with big Bull trapSUI - trend stoped with big Bull trap
Price should create a range or make big pullback to give us good entry idea

SUI - perfect pump from POCSUI - perfect pump from POC
trendi s strong and bullish
take trades at VAL of local ranges
and follow the treend

What awaits SUI after a new ATH?As the SUI surged past $2, the bulls utilised all their strength to push the price beyond the current ATH. Now that the price has achieved new highs at $2.36 during the early trading hours, the traders appear to have become optimistic about the next price action. Therefore, the price is bound to keep up the bullish trend as the crypto is gaining back the lost momentum and attention.
Hence, the SUI price may eventually stabilize within the price discovery phase and eventually maintain a steep ascending trend and achieve higher targets.
SUI has been largely compared to that of the 2021 Solana price rally, which triggered a monstrous jump beyond $220. With the latest price rise, the SUI price has been certified as the beginning of a fresh upswing. Therefore, the price is believed to head towards the next target at $2.5 to $2.55 but only after it reaches certain conditions.
The chart displays immense strength among the bulls as the price maintains a steep ascending trend within a rising parallel channel. The token just hit the upper resistance, forming a new ATH, which may result in a minor pullback to the average bands of the channel. The StochRSI is heading towards lower support, while the short-term MACD suggests a drop in the buying pressure. This validates the bearish narrative in the short term, which may drag the levels to $2.16 in the next couple of days.
However, after the bulls regain power, a rebound could be generated at the average bands, which may revamp a strong upswing to form a new ATH above $2.4. However, these are minute price actions, but in the wider perspective, the Sui price appears to be primed to close the monthly trade around $3 and reach $5 by the end of the year.

#SUI price will first to break into the alt-season ?)At the moment, the inverted Head and Shoulders on OKX:SUIUSDT chart are drawn quite technically and “by the book”.
Even such an important factor as increased trading volumes in the right shoulder is being fulfilled, and this is especially evident in trading OKX:SUIUSDT.P futures.
Now, CRYPTOCAP:SUI buyers have one task - to keep the price above $1-1.05
Fulfillment of this condition will guarantee growth to at least $1.50, and if you're lucky, up to $2.40
_____________________
Did you like our analysis? Leave a comment, like, and follow to get more

Sui(SUI) Roadmap!!!Today, I want to analyze the Sui( BINANCE:SUIUSDT ) project , which has seen a good increase in these days, and show you its roadmap .
The recent price surge of the SUI token can be attributed to several key factors :
1- Increased Transaction Volume : Sui Network recently surpassed Solana in terms of transaction volume. This uptick in transactions is largely driven by the rise of meme coins on the Sui blockchain, which has caught the attention of traders and investors alike.
2- Strategic Partnerships and Institutional Adoption : Sui Network has formed strategic partnerships, notably with Grayscale and Circle. The launch of the Grayscale SUI Trust has enabled institutional investors to gain exposure to SUI, boosting interest and liquidity. Additionally, the integration of USDC through Circle’s Cross-Chain Transfer Protocol has enhanced the network’s utility in DeFi and gaming sectors.
3- New SCION Technology : Sui introduced SCION, a new network infrastructure designed to enhance security and reduce latency in Web3 applications. This innovation has further bolstered confidence in the network, attracting more users and developers.
It seems that according to the good news that has come for the Sui project , the increase of the SUI token will continue, but it will probably experience a small correction to increase again.
Currently, SUI is moving near the Resistance lines and the Potential Reversal Zone(PRZ)($3.00-$2.50) .
According to the theory of Elliot waves , SUI seems to be completing the main wave 3 . ( It is completing the microwave 5 of the main wave 3 ).
I expect SUI to rise another +20% or so and then start to correct. SUI correction can be -20% to -40% .
Sui Analyze (SUIUSDT), Daily time frame⏰.
🔔 Be sure to follow the updated ideas. 🔔
Do not forget to put Stop loss for your positions (For every position you want to open).
Please follow your strategy and updates; this is just my Idea, and I will gladly see your ideas in this post.
Please do not forget the ✅ ' like ' ✅ button 🙏😊 & Share it with your friends; thanks, and Trade safe.

10/11 Can positive earnings season secure BTC Pumpctober?Overview:
The AMEX:SPY continues its bullish streak, hitting a new all-time high and marking the fourth consecutive day of gains. But what’s fueling all this excitement? Just a few weeks ago, concerns about World War III and a looming recession were dominating the headlines. Now, it seems like the market is brushing off those fears. Pumping the AMEX:SPY means pushing up the stocks that make up the index, which suggests an improvement in their earnings, particularly net margins.
Conveniently, earnings season typically starts in mid-October and runs through late October and early November. This past week, giants like PepsiCo, Delta Air Lines, BlackRock, JPMorgan Chase, and Wells Fargo all reported earnings—and they all beat analysts' expectations. What’s notable about this group is its diversity: from consumer staples like food and beverages to airlines, signaling strong consumer purchasing power, to investment and banking companies, which are more dependent on macroeconomic factors and the Federal Reserve’s decisions. These companies, often beneficiaries of quantitative easing, could be the early indicators of a trend. With such a strong start, we might expect more companies to continue beating estimates, setting the stage for what we’re calling "Pumpctober."
In the coming week, we’ll hear from other banking giants like Bank of America, Citigroup, and Goldman Sachs. Healthcare heavyweights like Johnson & Johnson and UnitedHealth Group are also on the docket, along with Netflix. You can find the full list and earnings calendar here: www.ii.co.uk
So, let’s sum it up: the market is surging, consumer spending seems robust, and on Friday, Jerome Powell reported higher-than-expected CPI and core CPI. It feels like the economy is running hot, but that also means no immediate need for an interest rate cut. What clouds the picture slightly is a higher-than-expected number of jobless claims—258k compared to the expected 230k, and higher than the previous 225k. If unemployment continues to rise, it could impact company earnings by Q1 and Q2 of 2025. For now, though, we’re all in on Pumpctober, with a 90% chance of an interest rate cut in November, up from 82%.
ETF Flow: The big players aren’t buying BINANCE:BTCUSD or BINANCE:ETHUSDT . Retail investors are. BlackRock and Grayscale are still sitting on the sidelines.
BTC TA:
W: Bitcoin is barely holding onto the Bollinger Band MA and remains below the weekly and daily levels of $64 k. It’s also under the 2024 yearly point of control (Volume Profile indicator) level of $63.2k. However, we noticed that the current price is very close to the closing levels of the last two quarterly candles—June and September both closed at $62.6k. Until it breaks below $61.4k, we can’t call it bearish just yet.
D: Thursday’s close below the key $60.5k level appeared to signal a breakout, but BTC quickly retraced, turning that breakdown into a fake-out. If the stock market keeps rallying, some of that liquidity and optimism could spill over into crypto, completing a bullish flag pattern. Saturday is showing some bullish momentum, but we need today’s candle to close above $62.8k to confirm a higher high.
4h: On this time frame, Bitcoin is battling strong resistance at $63k. It’s unlikely we’ll see significant movement on a Saturday, as market makers tend to be less active, but if BTC fails to break out from $63k, it would confirm a bearish trend, and shorting from here could offer a good entry point.
1h: On Friday, we saw 7 consecutive hours of aggressive buying starting at 9 am NYC time, with volume doubling the average and pushing BTC from $61.1k to $63k, a 3.19% jump.
Alts Relative to BTC: What was a lower low for BTC was a higher low for ETH, SOL, NEAR, and BNB, which is a bullish sign. However, none of these alts have established a higher high, which cancels out the bullish sentiment. The best move for now is to avoid taking positions until there’s a major breakout with confirmation.
Bull Case: We could be on the verge of a trend reversal, breaking the bullish flag pattern. Both the US and Chinese economies are about to be flooded with cheaper money, which could flow into speculative assets like crypto.
Bear Case: This is an ideal moment to short BTC if it fails to reclaim resistance and turn it into support. The deadline for confirmation is Sunday evening.
Fear and Greed Index: 43, back to Neutral.
Prediction: All eyes are on Sunday, 9 pm EST and 6 pm PST, when Asian traders will return to their desks. Expect increased volatility as bulls and bears clash.
Mistakes: Both SUI and TAO have continued to pump higher despite lower volumes and volatile price swings of around 15%. If it establishes a higher high, stalls and you short - at least you can trade the range while BTC decides its direction.

#SUI/USDT#SUI
The price is moving in a descending channel on the 1-hour frame
And it is sticking to it well
We have a bounce from the lower limit of the descending channel and we are now touching this support at a price of 1.85
We have a downtrend on the RSI indicator that is about to be broken, which supports the rise
We have a trend to stabilize above the moving average 100
Entry price 1.90
First target 2.00
Second target 2.06
Third target 2.15

SUI, Just imagineThis chart is for imagination purpose only.
if the October to march season hit, we could very well imagine this.
The fractal on the chart comes from the previous move of October 23" to February 24".
27 million holders
Just imagine, that's all.
"That's it, that's the idea" - Good night !

10/9 Good news and bad news...Overview:
Which would you prefer to hear first? Let’s start with the good news: the AMEX:SPY has updated its all-time high. If you have a 401k or any other pension fund, you’re likely seeing gains. Also, it's hard to argue that a recession is looming when the stock market is booming.
Now for the bad news: crypto is down. Normally, this wouldn’t be alarming, as all markets fluctuate. But it's concerning when we see a divergence between the stock market and crypto. Even riskier tech stocks, like those in the NASDAQ:QQQ index, climbed 0.79%. If traders are eager to buy equities, why not crypto, or at least BINANCE:BTCUSD ?
Tomorrow, all eyes will be on Jerome Powell as he delivers the CPI and Core CPI data along with initial jobless claims. Given that recent job reports nearly doubled expectations, we predict fewer jobless claims. The question is: will positive macroeconomic data help? On one hand, it means people have money to spend, which could benefit crypto. On the other hand, it could reduce the chances of aggressive rate cuts, keeping liquidity constrained, and preventing speculative assets from soaring.
BlackRock continues dollar-cost averaging into Bitcoin but hasn’t touched its ETH ETF. When did ETH become so hated?
CME fedwatch tool shows an increase in the probability of no rate cut in November, up to 17.2%, while the chances of a one-base-point cut sit at 82.2%.
BTC TA:
W: BTC needs to close above $61.4k to keep bulls in the game. Unfortunately, after today's drop, BTC fell below this crucial level, breaking the bullish structure it had been building since September 7th. Another important level is $62.7k, the point of control for the entire 2024 bull run, which was rejected yesterday. This week is shaping up to print another red candle, following the previous week.
D: While the weekly levels are invalidated, the daily levels still offer hope. BTC bounced from the $60.6k support level, and we haven’t seen four consecutive red days since August. If tomorrow's CPI data hints at a bullish sentiment, we might see a small rally back to $62.1k.
4h: Price is currently closer to the lowest Bollinger Band, indicating it needs to catch up with its moving average.
1h: BTC has reached the Bollinger Bands' moving average, but for a stronger recovery, it needs to break beyond this level on the 4h chart to confirm a bounce.
Alts Relative to BTC:
TAO, SUI, and APT have reached higher highs, but with lower volumes, suggesting that the bullish trend is losing steam. These gains were likely driven by retail investors, FOMOing into the rally. Meanwhile, FTM is showing bearish MACD divergence on the 4-hour chart and was rejected at its weekly resistance of $0.69.
Bull Case:
At $60k, BTC is relatively cheap, considering how much adoption and recognition crypto has gained in 2024. Since we didn’t experience a massive sell-off in September and have held up into October, this might be your last chance to buy BTC at a sub-$100k price. Additionally, we’re in the Fear territory on the Fear and Greed Index, which historically offers an 83% chance of profitability if bought during this phase.
Bear Case:
From a technical perspective, things look bearish. Many key support levels have been invalidated, and the likelihood of the Fed not cutting rates in November continues to rise.
Fear and Greed Index: 37 (Fear).
Prediction: BTC may rebound to $62.1k before resuming its decline. Expect TAO, SUI, and APT to follow BTC's movements, with a potential drop back to pre-BTC ETF levels, which could see declines of 55-60%.
Opportunities:
Short TAO, SUI, APT, FTM.

Phemex Analysis #27: SUI _ Will It Continue Soar or Sink?After its initial surge, PHEMEX:SUIUSDT.P has been locked in a battle with resistance. Breaking through one hurdle after another, it has now found itself staring at the formidable wall of its all-time high, $2.18. A recent retracement has brought it back to $1.88, leaving investors pondering its next move.
The Road Ahead: A Tale of Three Scenarios
Breaking Free : The most optimistic scenario would see SUI shatter the $2.18 resistance with a surge of volume. This could propel it to even higher heights, igniting a new wave of bullish sentiment.
A Bearish Turn : However, the market has shown signs of weakness. A second one-day high accompanied by a RSI divergence suggests that a bearish reversal might be brewing. If SUI falls below the $1.60 support level with significant volume, a downward spiral could ensue.
The Waiting Game : A more likely scenario is a period of consolidation. SUI might hold the $1.70 support level while investors patiently await a clear breakout signal. Impatience can be a trader's enemy in such situations.
The Path Forward
As SUI navigates this critical juncture, patience and careful analysis are key. While the potential for further gains is undeniable, the risk of a reversal cannot be ignored. Traders must weigh the potential rewards against the risks and make informed decisions.
Tips:
Trade Smarter, Not Harder with Phemex. Benefit from cutting-edge features like multiple watchlists, basket orders, and real-time strategy adjustments. Our unique scaled order system and iceberg order functionality give you a competitive edge.
Disclaimer: This is NOT financial or investment advice. Please conduct your own research (DYOR). Phemex is not responsible, directly or indirectly, for any damage or loss incurred or claimed to be caused by or in association with the use of or reliance on any content, goods, or services mentioned in this article.

My point of View For SUIDear Follower
I got a multi request to analyze SUI
I see SUI most likely will hit $5.5 easily
I recommend liquidate 50% of your fund at that price then start use a trilling stop under each last new bottom for the rest of the fund
Good luck every one
