SUI - SUI thats how air soundsSo i told how you air sounds, about SUI? It looks like it will take top liqudity and then form the force within what it shall happen!
SUI

SUI - Only way is up.BINANCE:SUIUSDT (1W CHART) Technical Analysis Update
SUI is currently trading at $2.77and showing overall bullish sentiment
Price has touches the trending support and managed to bounce back from the support, this is a good sign. I see a good opportunity for long trade here with a decent stoploss.
Entry level: $ 2.77
Stop Loss Level: $ 1.77
TakeProfit 1: $ 3.6997
TakeProfit 2: $ 4.2126
TakeProfit 3: $ 5.7785
TakeProfit 4: $ 9.5494
TakeProfit 5: $ 14.1762
Max Leverage: 5x
Position Size: 1% of capital
Remember to set your stop loss.
Follow our TradingView account for more technical analysis updates. | Like, share, and comment your thoughts.
Cheers
GreenCrypto


SUI Collapse Incoming? Bearish Pattern You Can’t IgnoreYello, Paradisers! Is #SUI about to enter a bearish spell? We’ve seen this setup many times before, and the warning signs are stacking up fast. If you're not already positioned or protecting capital, now’s the time to pay attention.
💎SUIUSDT has started losing momentum just as a classic head and shoulders pattern has completed at the top, a formation often associated with trend reversals. This bearish structure is further validated by the presence of bearish divergence on momentum indicators, hinting at exhaustion from buyers and growing strength among sellers.
💎#SUIUSDT's neckline support at $3.60 has been breached, and since then, price has been sliding gradually. Right now, its on a path toward the $3.00 level, a moderate support area where some initial profit-taking may occur. However, according to the structure's full pattern target, the move is likely not over just yet.
💎Given the weakening market dynamics and lack of bullish follow-through, an extended dip cannot be ruled out. If sellers manage to overwhelm the $2.65 floor, the next potential landing zone would be around $2.30, a high-confluence level with a strong historical order block. This is a zone where a more meaningful bounce or even a longer-term reversal could initiate, but only if market sentiment finds footing.
💎On the other side, bulls face an uphill battle. They must reclaim the $3.65 to $3.80 resistance range, a zone that has consistently rejected upward attempts over the past several days. A breakout above this range would be the first sign of renewed bullish intent and could help ease the selling pressure.
Paradisers, strive for consistency, not quick profits. Treat the market as a businessman, not as a gambler.
MyCryptoParadise
iFeel the success🌴

$SUI follow up for June 2025CRYPTOCAP:SUI has tapped my support zone around $2.85, which is currently holding well.
That said, the broader trend remains corrective, and it's likely only a matter of time before this support gives way.
If that happens, we could see a drop into my green buy zone — sitting just below a major order block. A break there might trigger heavy liquidations and a sharp move to the next support level.
I don't expect a deeper crash, as bulls are showing strong activity to defend this area.
If you set buy orders around this zone, a solid bounce could offer attractive profits.
As always, DYOR.
This is a follow up for this idea from May 2025

SUI landslide incomingSUI has lost support and has fallen below $3.55, and then failed to regain any ground above it repeatedly. The expectation is that it will hit the March 27 high of $2.82 and then possibly fall further.

SUI Long Swing Setup – Confluence of Support and Fibonacci LevelSUI has pulled back into a key confluence zone, aligning with both the 61.8% Fibonacci retracement and horizontal support. We’re now eyeing the $2.70–$2.80 area for a potential long entry.
📌 Trade Setup:
• Entry Zone: $2.70 – $2.80
• Take Profit Targets:
o 🥇 $3.40 – $3.60
o 🥈 $4.00 – $4.20
• Stop Loss: Daily close below $2.65

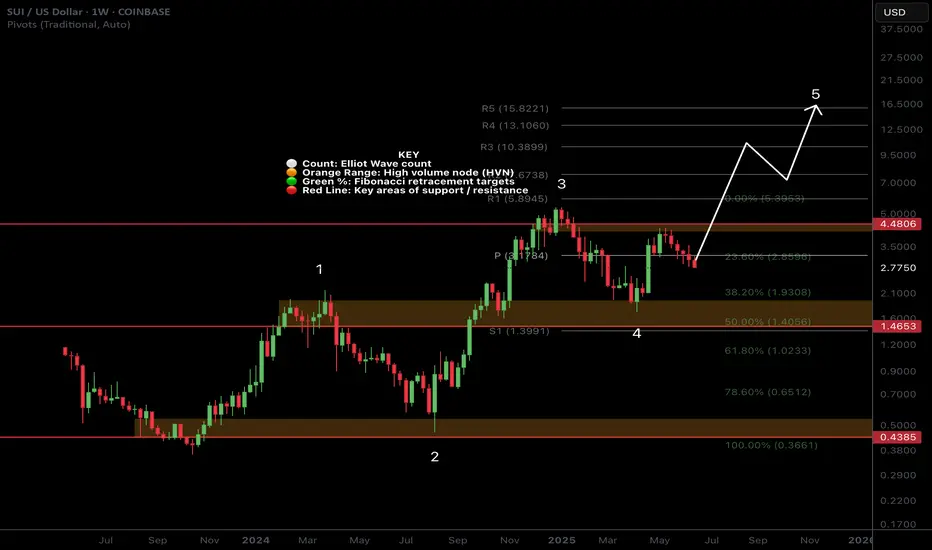
SUI Macro AnalysisCRYPTOCAP:SUI macro analysis update...
📈 𝙇𝙤𝙣𝙜 𝙩𝙚𝙧𝙢 outlook shows price action still outperforming most alts with a great rally recently. Target remains the R5 weekly pivot at $15
📉 𝙎𝙝𝙤𝙧𝙩 𝙩𝙚𝙧𝙢 outlook has price pulling back, looking to find a bottom between $2.3-2.65
War escalation's and retail selling are keeping price suppressed as price changes hands to private companies and large wallets.
The time for patience continues. Money is made in the sitting, weathering volatility, not flipping in and out of trades on every bit of news and price movement
𝙏𝙚𝙘𝙝𝙣𝙞𝙘𝙖𝙡 𝘼𝙣𝙖𝙡𝙮𝙨𝙞𝙨
Price is testing the weekly pivot and daily S1 pivot as support
Elliot Wave (EW) analysis was a strong, textbook motif wave with a wave 2 retracement underway. Wave 2 often extends to the 61.8 Fibonacci retracement of $2.4 but the alt-coin golden pocket is the 78.6 at $2.03. No surprises if we see that area revisited and could be a great buying opportunity.
Price has lost the daily 200EMA and DEMA which is bearish short term.
Safe trading
Sui Update, Retest of Support; Bullish ConfirmedIt's been 9 days since my last Sui update. The chart looks good.
For context, see the previous analysis:
We started at the C wave of an ABC correction. There was an attempt to push prices higher but resistance was found at MA200. The resistance produced retrace and the same support zone is tested and holds. If a new advance develops here, which is exactly what is going to happen, then you can expect much higher prices next. This time around, MA200 as resistance will break, which means a new high. The highest prices in more than six months, since January 2025.
This is where the next move will take us and this is easy to predict now that support has gone through a retest and holds.
Namaste.

Sell Bitcoin and buy Altcoins!🚨 Controversial Take Ahead – Packed With High-Value Insights 🚨
Let’s dive deep.
👨💻 A bit about me:
I’ve been riding the tech wave since the beginning:
Programmed video games in the 80s and 90s
Built VSTi plugins in the early 2000s
Started creating websites when Internet Explorer 1.0 launched
Sold 3D assets when Unity 2.5 (first PC version) dropped
Launched my own blockchain in 2016
Deployed smart contracts on TRON in 2018
I don’t follow trends—I predict them. My instincts are backed by decades of hands-on experience.
Now, here’s what I see coming:
⚠️ 1. Sell Your Bitcoins
Yes, Bitcoin is obsolete. It’s a technology—not a precious metal—and like all tech, it must evolve or die.
Ask yourself:
Do you use a Blackberry today?
Still flying in 1930s planes?
Gaming on an Atari or Commodore 64?
Surfing the web with Lycos or Altavista?
No? Then why are you betting on a 2009 technology?
Most people don’t even understand how Bitcoin works—ask around what SHA256 or RSA means.
Crypto is misunderstood, and that’s dangerous.
Back in 1998, I created the UPL library, which handled data compression & encryption using all major algorithms—Huffman, LZSS, DES, RSA, etc. I’m not just throwing words around—I’ve built this stuff.
Politicians and financial institutions (yes, even Saylor) are 15 years late to Bitcoin. They're missing the truth: BTC’s upgrades failed (Ordinals, Runes, etc). Its value holds due to FOMO from the uninformed, not innovation.
One day, your Bitcoins will be as worthless as mp3.com stock. That’s not opinion—that’s technological reality.
🪙 2. Buy Altcoins
Not every altcoin is a winner—but that’s where the real opportunity is.
Remember:
Nokia and Blackberry ruled before Samsung and Xiaomi.
The next Amazon, Google, or Nvidia already exists—and it's trading for pennies.
When people laugh at altcoins, that’s the time to buy low.
Altcoins like CRYPTOCAP:SOL , CRYPTOCAP:SUI , MIL:UNI could 100x… even 100,000x.
Bitcoin might double—and then crash.
Smart traders buy when everyone else is mocking.
🌍 3. Consequences of the BTC Collapse
This collapse will come at a turning point in global power.
Wall Street and U.S. states are heavily exposed to BTC. If it crashes, the Western financial system could implode—a dot-com-level disaster.
China, on the other hand, is stable, adaptive, and tech-forward.
Crypto without staking, DeFi, NFTs, GameFi, smart contracts? That’s not the future—that’s Bitcoin. Altcoins are the future.
Bookmark this post. Re-read it in 10 years.
You’ll remember I said it first: Innovation is unstoppable.
Enjoy the last Bitcoin pump. Then watch what comes next.
DYOR.
#CryptoRevolution #AltcoinSeason #BitcoinCollapse #Web3Future #BlockchainInnovation #SellBitcoin #BuyAltcoins #CryptoTruth #DeFi #GameFi #SmartContracts #CryptoShift #UnstoppableInnovation
SUI — Trading with Geometry: Why Harmonics Work So WellSUI has been respecting technical levels with remarkable consistency. After bouncing from the $2.8467 low, it surged sharply — completing a clean Cypher Harmonic Pattern. This led to a high-probability short setup at the 0.786 Fibonacci retracement (Point D) around $3.5573.
🎯 Trade Setup Breakdown
Pattern: Cypher Harmonic
Entry (Point D): $3.5573 (0.786 retracement of XC)
Target: $3.1191 (0.618 retracement of CD)
Stop-Loss: Above Point X
The 0.618 fib retracement of the CD leg coincides with a significant key low from May 6, 2025, adding structural confluence. This is an ideal level to monitor for absorption, reaction, or potential reversal behaviour.
🧠 Educational Insight: How to Trade Harmonic Patterns Like a Pro
Harmonic patterns aren't just visually appealing — they represent high-probability setups based on market structure, Fibonacci geometry, and behavioural cycles. The most critical part of every harmonic pattern?
You enter at Point D.
Whether the pattern is bullish or bearish, Point D is your trigger:
In bearish patterns (like this Cypher), you short from Point D.
In bullish patterns, you long from Point D.
This works because Point D marks the exhaustion of the corrective leg, where trapped traders and liquidity often sit. The structure often aligns with supply or demand zones, order blocks, or FVGs (Fair Value Gaps).
💡 Important: Harmonic patterns are most effective on higher timeframes — 4H and above. On lower timeframes, noise increases and reliability drops significantly. For clean execution and meaningful structure, stay with mid to high timeframes.
Here’s how to trade it effectively:
✅ Wait for the full pattern to form — don’t front-run
✅ Use fib levels and structure confluence to validate Point D
✅ Use order flow tools (like Exocharts) to confirm absorption or volume shift
✅ Enter on Point D with your stop-loss just beyond X
✅ Take profits at common retracement levels like the 0.382 or 0.618 of the CD leg
Patience is key. Harmonic traders wait for the market to complete the cycle — then strike with a plan.
📌 Final Thoughts
SUI is delivering clean harmonic respect, and this setup is no exception. Whether you're already short or waiting for further confirmation, keep an eye on volume, liquidity zones, and reaction levels around $3.1191. If this zone holds, it may serve as a pivot for the next move.
Pattern. Precision. Patience. That's how you catch high-probability trades like this.
_________________________________
💬 If you found this helpful, drop a like and comment!
Want breakdowns of other charts? Leave your requests below.

$SUI heading back to $1.50 or belowAll of crypto is about to fall significantly, most people just don't realize it yet. Many alts will fall 50%+, and coins like SUI and XRP that people feel safe in, won't escape the bearish move.
Just looking at the chart, we can see that SUI broke upwards in August of last year and topped in January, and has since retested resistance at $4.05 and rejected-- forming a large lower high.
It makes the most sense to me that we will now see price retest the lows that price broke out from as they never got tested on the way up.
We should see price fall down to the lower support levels over the coming weeks.

Is Bitcoin Ready to Launch? In-Depth Analysis of BTC, ETH, XRP, Hello everyone, I hope you're doing well.
Due to time constraints, I won't be analyzing each asset individually. Instead, I’ll provide a collective technical overview in this post.
This analysis includes the following cryptocurrencies: **Bitcoin, Ethereum, Ripple, Solana, Sui, and Chainlink**.
⚠️ **Please note:** On the **daily timeframe**, most of these assets are forming different patterns. However, the **weekly timeframe** provides a clearer and more reliable outlook.
---
### 🔍 **Technical Overview:**
📌 **Bitcoin (BTC)**
Currently forming a **"V" pattern**.
If BTC closes **above \$110,500 on the weekly timeframe**, the first target is **\$131,500**, and the second target is **\$165,000**.
📌 **Ethereum (ETH)**
Also in a **"V" pattern**.
If ETH closes **above \$2,833 on the weekly timeframe**, the first target is **\$4,200**.
📌 **Ripple (XRP)**
Forming a **bullish flag** pattern.
If XRP closes **above \$2.65 on the weekly timeframe**, the first target is **\$4.22**.
📌 **Solana (SOL)**
Forming a **"V" pattern**.
If SOL closes **above \$190 weekly**, the first target is **\$282**.
📌 **Sui (SUI)**
Also forming a **"V" pattern**.
If SUI closes **above \$4.26 weekly**, the first target is **\$6.97**.
📌 **Chainlink (LINK)**
Needs a **weekly close above \$18** to confirm breakout.
First target: **\$25**.
---
### 🧠 **Brief Fundamental Insights:**
* **Bitcoin** is being heavily accumulated by institutional investors and whales. On-chain metrics suggest we are **not at a cycle top**, and the ongoing **supply shock** and **massive exchange outflows** are strong bullish signs.
* **Ethereum** is under **strong accumulation** from both retail and institutional investors, as confirmed by recent **CoinShares reports**.
* **Ripple** is awaiting resolution of its ongoing lawsuit with the **SEC**.
* **Sui** is consistently rolling out updates and shows **unstoppable DeFi ecosystem growth**, giving it strong fundamental support.
* **Solana** is being accumulated by institutional players, including **SOL-specific strategies** and funds.
* **Chainlink** is seeing buying pressure supported by **positive news and strategic partnerships**, some of which are from **anonymous large players**.
---
🧠 Updated Fundamental Analysis (June 2025)
Bitcoin (BTC)
New Investment Record: In May, total investments in crypto funds reached $167 billion, with Bitcoin accounting for $5.5 billion, signaling strong institutional demand.
Institutional Buying Surge: ETF purchases, entries by institutions like Paris Saint Germain, and even countries like Pakistan have contributed to declining exchange reserves of Bitcoin.
Favorable Macro Conditions: Rising bond yields, stock market volatility, and a weakening U.S. dollar have made Bitcoin more attractive as a hedge asset.
Ethereum (ETH)
Consistent Inflows: Ethereum funds have seen seven consecutive weeks of capital inflows, with nearly $296 million added in the past week alone.
Institutional Confidence: Assets under management (AUM) in ETH funds have reached approximately $14 billion, indicating strong long-term faith by institutions.
Solana (SOL)
Strong Institutional Demand: Firms like Société Générale and Siebert Financial have recently invested in Solana.
On the Verge of ETF Approval: Franklin Templeton filed for a spot Solana ETF back in February, potentially boosting demand.
Whale & DeFi Growth: Increased whale activity, growing DeFi ecosystem, and rising developer engagement hint at a potential price rally to $200 and beyond.
Ripple (XRP)
While there is no major new fundamental data recently, the listing of XRP futures on CME and broader access for institutional investors may have a positive impact.
The ongoing legal case with the SEC remains a crucial factor in XRP’s future outlook.
Sui (SUI)
DeFi Expansion: Active daily users have grown by over 14%, and decentralized exchange volume has reached around $34 million per day.
TVL Growth: Suilend’s Total Value Locked (TVL) has hit $700 million, ranking 8th among all blockchains.
Institutional Attention: There are reports suggesting that an ETF for SUI may be under consideration, with on-chain utility continuing to expand.
Chainlink (LINK)
Collaboration with Major Financial Institutions: Chainlink is participating in CBDC pilots between Hong Kong and Australia, working with Visa, ANZ, and the Hong Kong Monetary Authority.
Ecosystem Growth: Development is supported via grants, like the $150K funding provided to Lightchain AI, strengthening Chainlink’s infrastructure.
Strategic Partnerships: Collaborations with JPMorgan, Ondo Finance, and Swift highlight Chainlink’s growing influence in connecting real-world data to blockchains.

SUI - SWING TRADESUI – Swing towards the ATH and aiming to create a new one, reacting within a weekly Liquidity Pool between 5.83 and 6.35.
LFG!
SUIUSDT3.19$ best price for pollback need for pump BINANCE:SUIUSDT . but for trust bullish trend, need for breaked 3.29$.
Best support: 3.025 - 2.91 $
Best resistance: 3.29 - 3.393 - 3.563 $
Contorl Risk management for trades.

SUIUSDT 1D Analysis SUI ~ 1D Analysis
#SUI Buy gradually from this support block with short term target of at least 15%+, Long term target $11

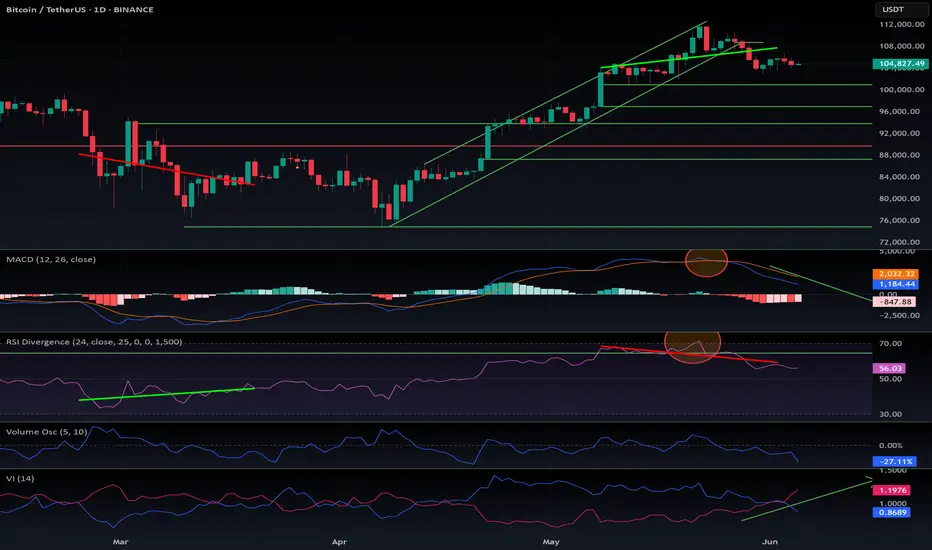
$BTC Bulls BackCRYPTOCAP:BTC is breaking out of a descending channel after a healthy pullback from the $ 112,000–$ 114,000 resistance zone.
Strong demand at $ 102,000–$ 104,000 supported the bounce, with buyers now pushing prices higher.
A clean breakout above $106K could open the path to retest $112K+.
The $102K–$104K zone remains key support as long as BTC holds above it, the short-term bias stays bullish.
DYRO, NFA

SUI – Prepping for New Highs
CRYPTOCAP:SUI showing clear signs of strength after that reaction at $3.
Starting to build a position here and will add more on a potential Monthly retest—if it comes.
Expecting this to push above $6 and enter price discovery in the next two months.
Could follow a similar path to its October 2024 – January 2025 move. BINANCE:SUIUSDT

$SUI: $2.95 must hold!CRYPTOCAP:SUI is following the broader altcoin market and entering a correction phase. As shown in the chart, CRYPTOCAP:SUI has already broken through two key support levels and is now hovering just above a critical support at $2.95.
If this level fails to hold, the next major support lies within my green box at $2.20 — which could present a strong buying opportunity.
However, proper risk management is essential — make sure to place your stop losses accordingly.
DYOR (Do Your Own Research).
#SUI #Altcoins #CryptoCorrection #SupportLevels #BuyTheDip #CryptoTrading #TechnicalAnalysis #DYOR
DYOR

Sui Turning Green ($6.65 Target = 100%+ PP)Just like that Sui was red for 24 days. 24 days might not be that long but when you consider that the rise lasted 35 days, then yes, within this context it is a very long retrace... And look at the levels on the chart.
Support found at 0.5 Fib. retracement. This level was pierced followed by a recovery the next day. Double-bullish signal; the recovery and the fact that 0.618 wasn't tested.
I can honestly say that it is still early, but I can also say that this zone where the bounce just happened is a very strong classic support zone. This support zone can lead to the next leg-up, a strong rise with targets reaching $5.19 and $6.65.
The chart looks good for a new bullish wave. The $6.65 target means more than 100%. Taken from the 7-April low, we are talking about a 285% total growth, profits of course. And this wouldn't be the end, only the start.
SUIUSDT has much more to give. We can expect the market to turn and remained green.
Namaste.

Sweep. Reaction. Shift. That’s not noise — that’s the model inBINANCE:SUIUSDT just tapped the lower boundary of its STB 5M, and the market responded instantly.
This wasn’t support. This was engineered liquidity — and it triggered precisely where Smart Money waits.
Here’s the structure:
Price ran the range low and tagged the STB, aligning with 0.618 at 3.1833
This reaction builds into a reclaim of the 1H OB — the same inefficiency that broke structure last time
Next draw is the 0.382 retracement at 3.2631, then 3.3124 — both short-term targets
If volume and structure align, the full reprice to 3.3922 becomes the higher-timeframe objective
Anything below 3.1265 breaks the current long bias — invalidation is clear.
Execution map:
Longs are valid as long as price holds above 3.183
TP1: 3.2631
TP2: 3.3124
Full target: 3.3922
Invalidation: Close below 3.1265
Price isn’t turning because of hope. It’s rotating because it fulfilled its algorithmic sweep.
More setups like this — clean, intentional, and early — are in the profile description.

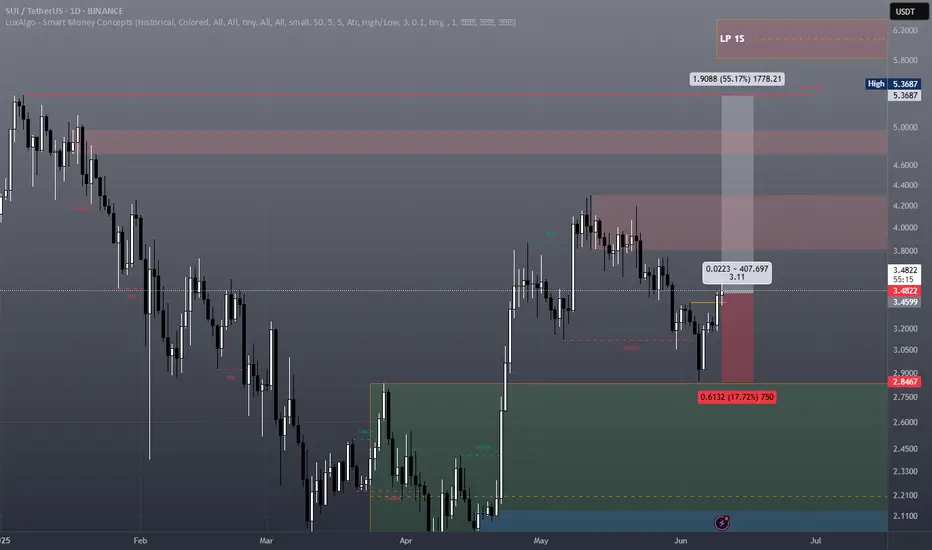
SUI price analysis If we look at the OKX:SUIUSDT chart globally, you'll see that the April drop stopped at a retest of a strong mirror zone.
And even now, when the CRYPTOCAP:BTC price is trying to correct itself, the #SUI price is very well-supported.
Therefore, globally, any purchase of #SUI while the price is above $2.30 has a chance to turn into a good medium or long-term investment.
📈 On the chart, we have schematically depicted how the #SUIUSDC price may move in the future in 2025 with the final target of $10.8-11.80
_____________________
Did you like our analysis? Leave a comment, like, and follow to get more

#SUI/USDT#SUI
The price is moving within a descending channel on the 1-hour frame, adhering well to it, and is heading toward a strong breakout and retest.
We are experiencing a rebound from the lower boundary of the descending channel, which is support at 3.10.
We are experiencing a downtrend on the RSI indicator, which is about to break and retest, supporting the upward trend.
We are heading toward stability above the 100 Moving Average.
Entry price: 3.30
First target: 3.34
Second target: 3.57
Third target: 3.76
