SUI NEW VOLUME UPCOMINGSUI shows on a low time frame new upcoming volume, which can allow SUI to break soon.
SUI

SUI (Daily) Elliot wave ii underwaySUI appears to have completed a motif wave (1) with an ending diagonal after finding a bottom at the major support high volume node (HVN) macro wave 4.
Wave 2 has not retraced as deep as other alt coins showing strength in the move up. The downside target is the HVN it has just tested at the 0.382 Fibonacci Retracement $2.95.
Wave 3 should be a powerful move up taking price into all time high.
Failure to hold this support could see price heading back to fresh lows and testing the $1.6 HVN once more.
Safe trading

SUIUSDT | Bullish Scenario Hello everyone.
Everything is clear in the video.
Summery
Order block zone: 3.3692-3.2294
SL: 3.2041
TP: 4.1961
I Share my ideas with you and the only thing you have to do is supporting.
Thanks.

HUGE INCREASES Possible on PYT | Here's WhyPython is a fairly new altcoin with big upside.
From the earlier two charts on the left, we see that initial downturns shouldn't be feared. Historically, SOL and SUI started with downtrends and transitioned into massive upside alts.
Python might especially see parabolic increases, once ETH starts to move towards a new ATH. This will be due to the rotation of liquidity between altcoins in terms of larger and smaller market caps.
Don't miss yesterdays update on ETH!
____________________________
BINANCE:SOLUSDT
COINBASE:SUIUSD
BINANCE:PYTHUSDT

SUI/USDT is Nearing an Important Support!!Hey Traders, in today's trading session we are monitoring SUI/USDT for a buying opportunity around 3.2460 zone, SUI/USDT is trading in an uptrend and currently is in a correction phase in which it is approaching the trend at 3.2460 support and resistance area.
Trade safe, Joe.

#SUI/USDT#SUI
The price is moving within a descending channel on the 1-hour frame, adhering well to it, and is heading for a strong breakout and retest.
We are experiencing a rebound from the lower boundary of the descending channel, which is support at 3.40.
We are experiencing a downtrend on the RSI indicator, which is about to break and retest, supporting the upward trend.
We are looking for stability above the 100 Moving Average.
Entry price: 3.70
First target: 3.81
Second target: 3.91
Third target: 4.09

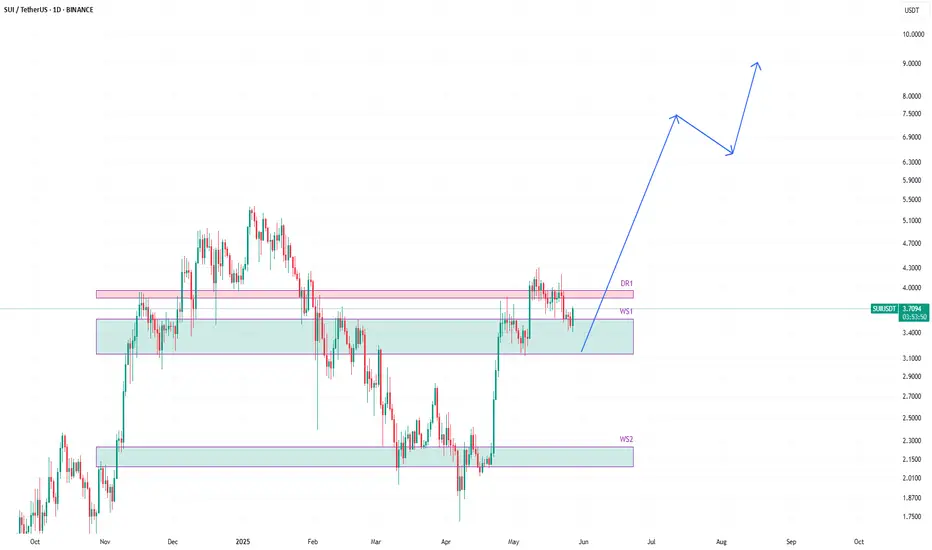
SUIUSDT likely to head higher towards 9$SUIUSDT is very bullish. I think this is just a pullback on this upward journey that it started at the begninning of april 2025.
The price is currently trading around weekly support WS1. It is possible that it might retrace further, but upward journey for this one in coming weeks in highly likely.
A good bounce from weekly support, we can already witness, and this could be the start of the journey already.
But as mentioned before, some further retracement before resuming upwards joeuney cannot be ruled out.
I am slowly adding this one as I am pretty confident that this one is going to do well in the coming weeks/months.
What do you think?
Failed Wedge, New Setup. Is SUI About to Break Out?In my previous post about BYBIT:SUIUSDT , I mentioned a potential falling wedge pattern. However, the breakout above the 4.0040 resistance turned out to be a false breakout, and the price eventually dropped to the invalidation level at 3.5868. This made the setup invalid.
But despite the failed wedge breakout, BYBIT:SUIUSDT remains in a bullish trend overall. During the current consolidation, the price appears to be forming a new bullish pattern — a Descending Broadening Wedge (DBW).
This pattern typically starts with low volatility and gradually widens. Once price reaches its lower boundary, it often experiences a strong breakout to the upside.
Let’s break down the key price action in this DBW setup:
Price is moving within a Descending Broadening Wedge and is currently near the lower boundary of the pattern.
It’s also sitting around a key support level at 3.4833.
A rejection candle formed right at 3.4833, showing the market’s response to this support area.
A reversal confirmation would come if the price breaks above 3.6102.
A bullish divergence is also visible — price is forming lower lows, while the stochastic indicator is forming higher lows.
Based on these five price action signals, it seems that buyers are still in control, even though short-term volatility has created a series of lower lows.
That’s why I still believe BINANCE:SUIUSDT has more room to go up. What’s your take on this?

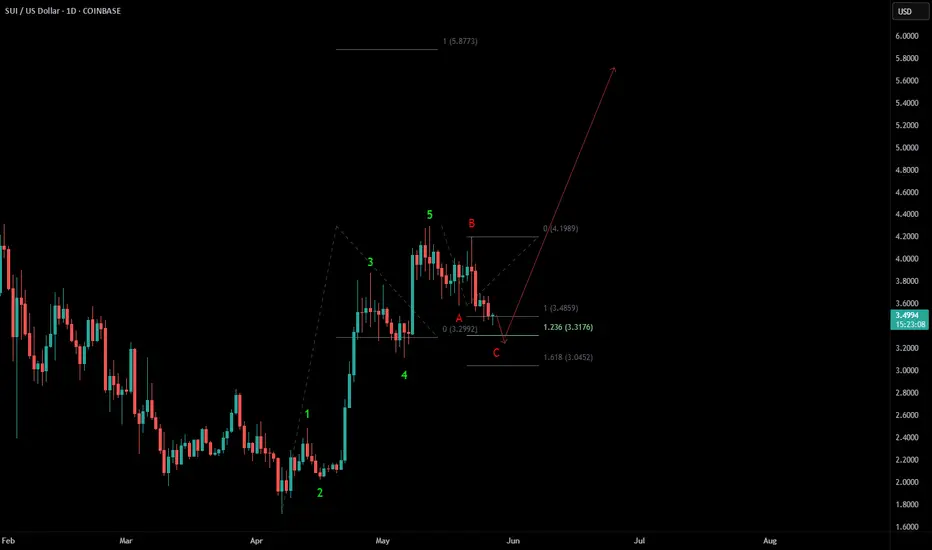
Bullish sequence in SUIUSD Since 4.07.2025 low, SUIUSD is showing the 5 swing bounce, which indicates that it will extend higher, once the pullback ends in 3, 7 or 11 swings pullback. Short term, it favors 3 swing pullback in A-B-C between 3.4859 - 3.0452 area before it resume higher. Further upside above 5.12.2025 will confirm the rally towards 5.85 or higher levels. But it and do double correction, if fail to break above 5.12.2025 high after ending the current pullback.
CETUS Hack Giving Opportunities Within SUICRYPTOCAP:SUI SUI is one of the fastest growing L1 chains. Previously extreme intra SUI dominance within swapping volume by KUCOIN:CETUSUSDT CETUS. This hack is a direct threat to the confidence of not just the application but the chain itself just like Ethereum was exposed during the MakerDAO hack.
Volume market wants to know their funds are secure to certain degree and predictable. Volume flow is more than fine with centralisation, esp with low barriers. Should the deposits be mostly secured and exploit fixed then it can bring confidence roaring back not just to CETUS but more importantly, SUI.
CETUS dominance within SUI is falling to rising applications. My favourite is Bluefin with its low barriers to account creation like google login. KUCOIN:BLUEUSDT BLUE has rising dominance within SUI volume market.

SUI update: Targeting the ATH#SUI has seen significant growth since its April low, passing the bullish confirmation level and forming a clear motive wave, followed by a correction.
As long as it holds above $1.71, this setup remains valid with potential for a new all-time high soon.
#SuiNetwork

SUI in Wyckoff AccumulationHere at the 30 minute time frame, SUI looks to be forming a Wyckoff Accumulation pattern.
It is possible to have one or two more secondary tests (ST) and then a strong move up beyond the level of the creek (Jump Across the Creek), and if that happens, it will be boom town again.
This will be invalidated if the price falls below $3.50.

$SUI: update 24th May 2025 🚀 CRYPTOCAP:SUI – One of the Top Picks This Cycle
I'm closely following CRYPTOCAP:SUI , which I believe is one of the strongest altcoins of this cycle.
If you've been following me, you probably caught the entry in the green box, which once again turned out to be a perfect buy zone.
If not, and you're still on the sidelines, this update is for you.
⚠️ Warning Signs After the Pump
After the recent massive pump, we’re seeing clear bearish divergence on the RSI — a strong signal that a correction is incoming. The natural support level for this pullback is around $3.20.
And let’s be honest — the lower it dips, the better the entry.
But if $3.20 doesn’t hold, we could see a quick dump back to the green box, which would be an ideal re-entry point just in time for the next leg of the altseason, likely starting September 2025.
🔍 Indicators Breakdown
MACD (Daily): Overheated and needs to cool down
RSI: Bearish divergence is clearly forming and needs to play out
Vortex: Signaling upcoming bearish pressure
📈 What’s Next?
This is a monitoring phase. Watch for:
Support at $3.20
Stronger support at $2.20 (green box)
Target: $5+ in the medium term
This pullback could extend into August, so be ready to enter before September, when we expect the next explosive move.
📌 Follow me for updates and don’t forget to DYOR.
#SUI #Altcoins #CryptoUpdate #TechnicalAnalysis #Altseason2025 #MACD #RSI #CryptoEntry #SupportLevels #DYOR #BullishSetup #Cryptocurrency

#SUIUSDT #1D (Bitget Futures) Rising wedge near breakdownSui got drained from Cetus LP and is about to print a spinning top candle on daily.
A retracement down towards 100EMA / descending trendline support seems likely.
⚡️⚡️ #SUI/USDT ⚡️⚡️
Exchanges: Bitget Futures
Signal Type: Regular (Short)
Leverage: Isolated (4.0X)
Amount: 4.8%
Current Price:
3.9642
Entry Zone:
3.9947 - 4.2035
Take-Profit Targets:
1) 3.5901
1) 3.2068
1) 2.8235
Stop Targets:
1) 4.5250
Published By: @Zblaba
CRYPTOCAP:SUI BITGET:SUIUSDT.P #1D #SuiNetwork #L2 sui.io
Risk/Reward= 1:1.2 | 1:2.1 | 1:3.0
Expected Profit= +49.7% | +87.1% | +124.5%
Possible Loss= -41.6%
Estimated Gaintime= 1-2 months

SUI/USDT Potential UpsidesHey Traders, in today's trading session we are monitoring SUI/USDT for a buying opportunity around 3.85 zone, SUI/USDT is trading in an uptrend and currently is in a correction phase in which it is approaching the trend at 3.85 support and resistance area.
Trade safe, Joe.

Can SUI stand up to the heat?SUI is going sideways while CETUS FUD spreads through the markets. Sui market structure is still making higher highs and higher lows. The oscillators show bearish divergence, but price action has not followed through yet. Keep track of the developments and make non-emotional decisions.
Full TA and analysis: Lin in the BIO

SUI — Breakout or Breakdown? Long & Short SetupsSUI has been trapped in a trading range for the past 6 days, consolidating between key levels and building up liquidity for the next big move. When price goes quiet like this after an impulsive structure, it’s not time to trade—it’s time to observe, analyse, and prepare.
So, where’s the next high-probability setup?
Let’s break it down:
🔹 Elliott Wave Context
From my previous SUI analysis, I identified a completed 5-wave impulse structure. After such a move, a corrective ABC pattern is typically next.
SUI has been respecting technical levels with surprising accuracy throughout this cycle—especially Fibonacci levels and key horizontal zones.
📉 ABC Correction in Progress?
Wave A appears to be completed, and Wave B was rejected at the yearly level in perfect confluence with the golden pocket (0.618–0.666) retracement of Wave A. This strongly suggests that Wave C is now unfolding.
Using the 1:1 trend-based Fib extension, the projected Wave C target lands at:
➡️ $3.6413
Let’s dig deeper—does this level hold up under further scrutiny?
🔍 Multi-Layered Confluence at $3.56–$3.64
Here’s what aligns at this potential support zone:
1:1 Fib extension (Wave A = Wave C) → $3.6413
0.55 Fib retracement (from $3.1132 to $4.2967) → ~$3.64
Volume Profile POC from prior range → ~$3.59
0.618 Fib retracement → $3.5653
Weekly level → $3.5594
21-Day EMA → $3.5537
21-Day SMA → $3.6319
0.75 Fib Speed Fan (if hit on May 16) → aligns with zone
This stack of levels gives us a tightly packed, high-conviction support area between:
📍 $3.56 – $3.646
___________________________________
🟢 Long Setup Idea:
Entry Zone: Ladder entries between $3.56 and $3.75
Stop-Loss: $3.4546 (beneath confluence zone)
Take-Profit Target: $4.588 (0.786 Fib retracement + -0.236 Fib extension)
R:R: ~5:1
🚫 Invalidation: If SUI reclaims the yearly level at $4.1152 before revisiting this support, the setup is invalidated.
🔴 Short Setup Idea:
If SUI pushes into the 0.786 Fib retracement at $4.588 and shows clear rejection (e.g., SFP, bearish engulfing, high-volume reversal), a short can be considered.
Entry: On rejection at $4.588
Stop-Loss: ~$4.714
Targets:
TP1: $4.325 (recent highs)
TP2: $4.1152 (yearly level)
🧠 Final Thoughts:
This is where trading becomes a game of patience. I’ve mapped both long and short setups based on structure, confluence, and price behaviour. Now it’s about waiting for price to come to your levels.
⏰ Alarms set.
📈 Let the chart do the work.
More updates to come as the range resolves. Stay sharp!
___________________________________
If you found this helpful, leave a like and comment below! Got requests for the next technical analysis? Let me know.

#SUI/USDT#SUI
The price is moving within a descending channel on the 1-hour frame, adhering well to it, and is heading for a strong breakout and retest.
We are seeing a bounce from the lower boundary of the descending channel, which is support at 3.64.
We have a downtrend on the RSI indicator that is about to be broken and retested, supporting the upward trend.
We are looking for stability above the 100 Moving Average.
Entry price: 3.70
First target: 3.77
Second target: 3.84
Third target: 3.96

SUI: Watch this bull flag formation! Previously, the price formed a falling wedge pattern and broke out to the upside, resulting in a notable gain of 27%.
Currently, the price is just below a critical resistance level. A break above this level could push the price to at least $0.425.
It’s wise to monitor this setup closely if you want to capitalize on the next upward movement!
The idea is to buy when the price breaks above 0.411$ and take profits at the levels shown in the chart.
Targets:
1. 0.425$
2. 0.45$
3. 0.47$
-------------------------------------------
About our trades:
Our success rate is notably high, with 10 out of 11 posted trade setups achieving at least their first target upon a breakout price breach (The most on TW!). Our TradingView page serves as a testament to this claim, and we invite you to verify it!

Sui Update: Resistance & Support (TAC-S7)Sui continues to recover nicely, slowly but surely. The action is happening in kind of a programmed way. Not too strong of a bullish impulse, instead, each resistance level is being conquered one at a time.
First, SUIUSDT moved back above 0.5 Fib. retracement. It found resistance at 0.382 and moved lower. After several weeks it moved forward and removed the 0.382 Fib. retracement resistance, now turned support.
As soon as this resistance broke, same with 0.5, there was a retrace. SUI is how moving above the 0.382 as support and so far it holds. This level was tested already 5 times, the last one being the current session, today, with a long lower wick and the action moved back above.
If SUIUSDT closes above this level, grey on the chart, we can say that support is confirmed. With support confirmed we can expect higher prices.
Slow steady growth is good here. If there is a drop, always a higher low compared to 7-April. That is, if there is a drop, it will recover very fast no doubt and then move higher.
SUIUSDT continues bullish.
Namaste.

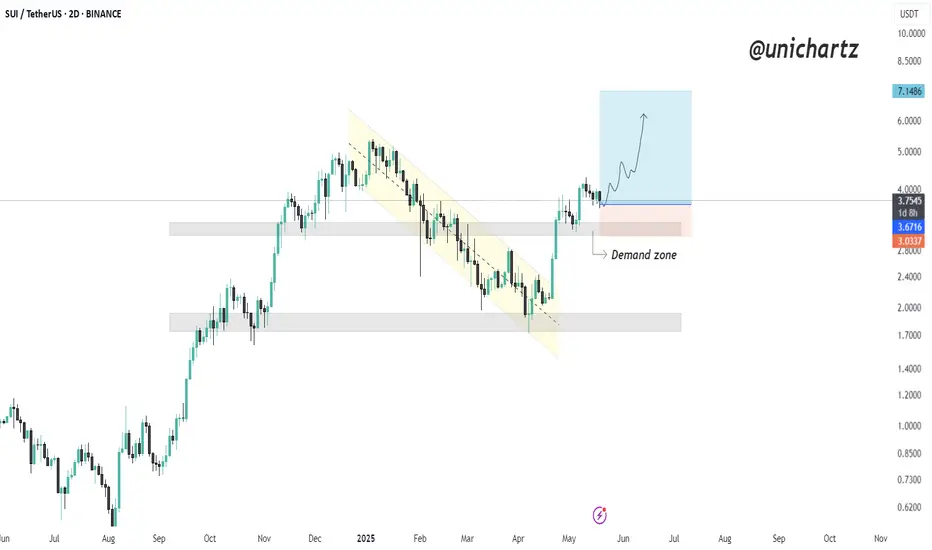
SUI Retesting Demand Zone After Bullish BreakoutSUI has broken out of a downward channel after weeks of selling pressure, signaling a major shift in momentum.
The price found strong support at the demand zone, then made an impulsive move up — confirming bullish intent.
DYOR, NFA
SUI Friday Double CupcakesShown here on a four hour time frame — what appears to be an almost identical reapat of the recent wave 4 consolodation.
Notice the phenominon of what I call, "Double Cupcakes"... — I know... not very technical — but this double bump keeps appearing before a continuation up or reversal of a down trend.
So hopefully these cupcakes make your Friday fun.
NFA
Best Wishes

SUI📈 SUI/USDT 4H Analysis
SUI is moving strong in an ascending channel, now testing key resistance at 3.71 🚀
🟢 Support Levels:
🔹 3.47 – recent pullback
🔹 3.15 – channel bottom
🔴 Resistance Levels:
🔹 3.71 – under pressure
🔹 4.27 – next target
🔹 4.64 – strong resistance
🔹 4.83 – major zone
📊 Bulls holding the ground as long as the trend stays intact!
