SUI Rebuy Setup (12H)After forming a 3D pattern at the top, wave E of a higher-degree pattern has completed.
A new leg has formed from the point marked by the red arrow on the chart.
It seems that wave E will end in the green zone, followed by a strong upward reversal.
Truthfully, there are other support levels above our marked zone, but we have identified the most important one. If the price reaches this level, we can take a safe buy on SUI.
This project is one of the strongest in crypto, but we always manage risk.
For risk management, please don't forget stop loss and capital management
When we reach the first target, save some profit and then change the stop to entry
Comment if you have any questions
Thank You
SUI

#SUI/USDT#SUI
The price is moving within a descending channel on the 1-hour frame, adhering well to it, and is heading for a strong breakout and retest.
We are seeing a bounce from the lower boundary of the descending channel, which is support at 1.86.
We have a downtrend on the RSI indicator that is about to be broken and retested, supporting the upward trend.
We are looking for stability above the 100 Moving Average.
Entry price: 1.90
First target: 1.99
Second target: 2.10
Third target: 2.19

SUI: Toward All-Time Low?SUI broke the support at $1.97 and tested it once again from below with yesterday's brief countermovement. It should now proceed downward so that the turquoise corrective wave 2 can be properly completed. Subsequently, the turquoise impulse wave 3 should provide new upward momentum, racing toward new all-time highs. The resistance at $5.36 should only be a milestone.

ALTCOINS | ALT Season | Buy Zones PART 2💥 SUI / BINANCE:SUIUSDT
SUI ideal buying points, weighing heavier towards the lower zone:
💥 SHIBA / BINANCE:SHIBUSDT
SHIB ideal buying zone is approaching, but ideally the lower zone is the better buy:
💥 DOT / BINANCE:DOTUSDT
Dot worries me for the reason that it has retraced nearly all the way to 2021 prices. Therefore I'll keep trades small, with modest TP zones.
BUY zone for a swing, not accumulation:
💥 PEPE / BINANCE:PEPEUSDT
PEPE buy zone seems far away, but considering how hard alts can drop in only a few days, I'd be ready with the orders, hanging heavier towards the lower zone:
💥 BINANCE / BINANCE:BNBUSDT
BINANCE shows promising swings. Ideal BUY zones include:
For the next cycle, in other words long term target, I'd watch the 1.618 at least:
This would make it an accumulation buy.
________________

SUI is expected to have a 50% pump ahead (1D)SUI, after completing the 3D pattern at its price peak, has entered a corrective phase.
It is now approaching a high-potential zone, which is the origin of a strong move with significant buy orders. We are looking for buy/long positions in the demand zone.
The target could be the supply zone.
A daily candle closing below the invalidation level will invalidate our bullish outlook.
Do not enter the position without capital management and stop setting
Comment if you have any questions
thank you

SUI Long Spot Trade Setup – Support Zone EntrySUI is retracing into a key support level around $2.00, providing a potential high-reward swing setup if buyers defend this zone.
📌 Trade Details:
Entry: ~$2.00
Take Profit Targets:
🥇 $2.50 – $2.90
🥈 $3.25 – $3.60
Stop Loss: Just below $1.60

Will SUI break $2 support and drop 20% to $1.80?Hello and greetings to all the crypto enthusiasts, ✌
let’s dive into a full analysis of the upcoming price potential for SUI 🔍📈.
SUI is currently trading within a downward channel, signaling a potential continuation of its bearish trend. A decline of at least 20% appears likely, with the primary target set at $1.80, provided that the critical psychological support at $2 is decisively broken. If this key level fails to hold, increased selling pressure could drive the price lower, reinforcing the downtrend.📚🙌
🧨 Our team's main opinion is: 🧨
SUI is stuck in a downtrend, and if it breaks below the key $2 support, we could see at least a 20% drop, with $1.80 as the main target.📚🎇
Give me some energy !!
✨We invest hours crafting valuable ideas, and your support means everything—feel free to ask questions in the comments! 😊💬
Cheers, Mad Whale. 🐋

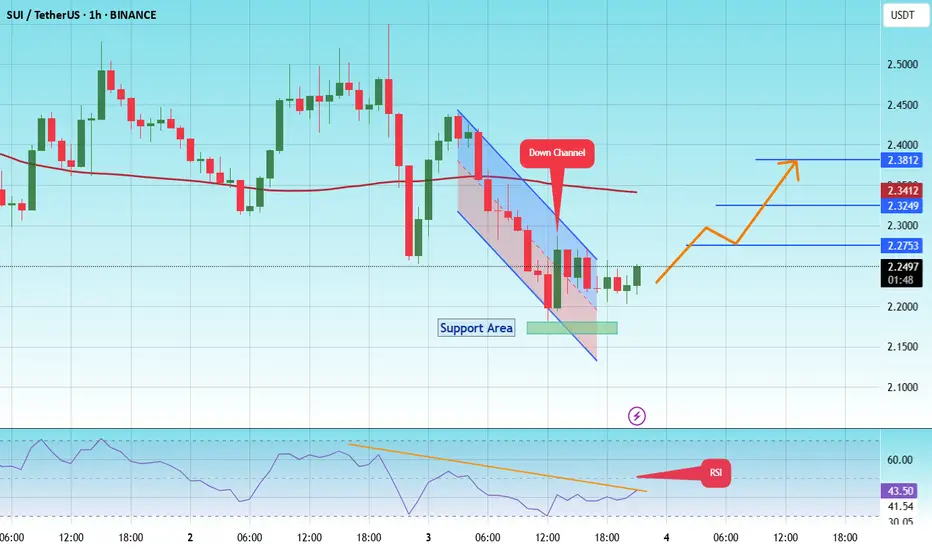
#SUI/USDT#SUI
The price is moving in a descending channel on the 1-hour frame and is expected to continue upward.
We have a trend to stabilize above the 100 moving average once again.
We have a downtrend on the RSI indicator, supporting the upward move with a breakout.
We have a support area at the lower boundary of the channel at 2.17.
Entry price: 2.24
First target: 2.27
Second target: 2.32
Third target: 2.38
Sui Bear Flag !! Big Cluster liquidity area
Bearish Continuation Trade Idea - Potential Breakdown from Bear Flag
📉 Market Outlook:
The price has been in a strong downtrend, forming a bear flag after an impulsive move downward. This pattern is typically a continuation signal, suggesting further downside if the price breaks below the flag structure.
📍 Key Observations:
1️⃣ Big Cluster Liquidity Area: The highlighted zone marks an area where the price previously accumulated/distributed liquidity before a strong breakout. Now that the price has fallen below this region, it is acting as a major resistance.
2️⃣ Bear Flag Formation: After a steep decline, the price is moving inside a narrow ascending channel, which often acts as a bearish continuation pattern.
3️⃣ Potential Breakdown: A clear break below the lower boundary of the flag could confirm the next leg down.
🔴 Trade Plan (Short Setup):
Entry Trigger: Wait for a confirmed breakdown below the bear flag's lower boundary, ideally with a strong bearish candle close.
Stop Loss: Place above the recent swing high inside the flag to limit risk.
Take Profit Targets:
First target: Recent swing low
Second target: Major support zone with historical liquidity
⚠️ Risk Management:
Position sizing should align with your risk tolerance.
Beware of false breakouts; a confirmed breakdown with strong momentum is preferred.
Monitor macroeconomic events that might cause volatility.
📌 Conclusion:
The overall trend remains bearish, and the formation of a bear flag suggests further downside if confirmed. If the price breaks lower with conviction, sellers may push it toward key support levels.
🔔 Disclaimer: This is NOT financial advice. Always conduct your own analysis and manage risk accordingly.
Would love to hear your thoughts—drop a comment below! 🚀🔥

SUI ready to provide structure? Be prepared for downside.SUI is at a good level, to get some support. There are further levels to get support below. However, a pivot structure can be built here. Momentum has room to get further oversold, but some downsides could still happen. DCA is the best strategy.
Full TA: Link in the BIO

SUI x10 in 3 months SUI is one of the few cryptocurrencies that has managed to maintain a bullish pattern in this abominable cycle. Time is 2nd quarter of 2025
Target $20+
Stop 20%
Invest 5% depo
Risk / Profit 1:50 🔥

SUI/USDT:BUY LIMITHello friends
Due to the heavy price drop, it can be seen that the buyers have supported the price well at the specified support and by hitting higher ceilings and floors, they are giving us a sign that they have good strength. Now we can buy in steps with capital and risk management and move to the specified targets.
Don't forget to save profit on each target.
*Trade safely with us*

#SUI/USDT#SUI
The price is moving within a descending channel on the 1-hour frame and is expected to continue lower.
We have a trend to stabilize below the 100 moving average once again.
We have a downtrend on the RSI indicator, supporting the upward move with a break above it.
We have a resistance area at the upper limit of the channel at 2.55.
Entry price: 2.52
First target: 2.40
Second target: 2.32
Third target: 2.20

SUIUSD - Bearish Head and ShouldersA head and shoulders pattern that allows the creation of a slight up channel in blue
Circles in red show the head and shoulders pattern
Daily timeframe

SUI Swing: The Art of Patience in TradingSUI has been playing nice with the technicals lately, giving us some really neat swing trade opportunities. Remember that short trade we talked about—from $3 down to around $2? Well, here's why that setup was a winner.
After that initial short trade, SUI bounced off $2 and then traded in a tight range between $2.5 and $2.2 for about two weeks. Then it broke higher to test the monthly open at $2.83—and it hit that level right on the dot. That’s where all the magic happens.
Why This Short Trade Worked
Fibonacci Confluence: When you draw a Fibonacci from the high at $3 to the low at $1.9626, the 0.786 level comes in at about $2.778. This is right near the monthly open, and we know that price tends to reverse between the 0.618 and 0.786 zones.
Trading Range POC: The $2.8 area was our previous point of control, so it adds extra weight as a resistance level.
Anchored VWAP: The VWAP from the high at $3.8999 sits just above the monthly open at around $2.855, giving us another nod that this level is important.
Fib Speed Resistance Fan: Even the speed resistance fan at the 0.618 level lines up with the $2.8 zone.
All these factors lined up to form a solid resistance area. That’s why short entries between $2.778 and $2.855 made sense.
Trade Setup Recap
Short Trade:
Entry Zone: $2.778 to $2.855
Target: The bullish order block at about $2.4745, which also lines up with the 0.618 fib retracement from the low at $2.2358 and the high at $2.8309
Risk-to-Reward: This setup gave us a risk-to-reward of 4:1 or even better, depending on where you set your stop-loss.
There’s also a possible long trade at the bullish order block, but that one’s only for when you see the confirmation.
Wrapping It Up
The takeaway? Confluence is your best friend. Waiting for that high-probability setup can really pay off. Let the trade come to you, don’t force it, and stay calm and focused.
Thanks for reading this SUI analysis. If you liked it, please leave a like and drop a comment. Happy trading!

SUI - Falling Wedge - Confirmed BreakoutBINANCE:SUIUSDT (1D CHART) Technical Analysis Update
SUI is currently trading at $2.77 and showing overall bullish sentiment
Price has formed nice falling wedge and we see a clear breakout from the falling wedge pattern. I'm expecting this trend to hold and read the resistance level around $5.3
Entry level: $2.7
Stop Loss Level: $1.8
TakeProfit 1: $3.1
TakeProfit 2: $4
TakeProfit 3: $5.3
Max Leverage: 2x
Position Size: 1% of capital
Remember to set your stop loss.
Follow our TradingView account for more technical analysis updates. | Like, share, and comment your thoughts.
Cheers
GreenCrypto

#SUI/USDT#SUI
The price is moving within a descending channel on the 1-hour frame, adhering well to it, and is heading towards a strong breakout and retest.
We are experiencing a rebound from the lower boundary of the descending channel, which is support at 2.20.
We are experiencing a downtrend on the RSI indicator that is about to be broken and retested, supporting the upward trend.
We are heading towards stability above the 100 Moving Average.
Entry price: 2.26
First target: 2.32
Second target: 2.40
Third target: 2.47

SUI Possible New ATH, AgainLooking at the Oscillator's curves I circled, that means the current CRYPTOCAP:SUI Price Action is oversold.
we are very close to Alt seasons, indicated by CRYPTOCAP:ETH rally. So, there's a big chance that smart moneys will start to accumulate the big caps of alt coins.
Well, SUI is one of the best alt coins out there.
My personal target
TP 1 $5
TP 2 $10
Friendly reminder, I don't set stop losses as I'm not doing derivatives market
Alt seasons is coming very soon, do not lose your money by speculating low to no market caps coins! it's always a great choice to bet on bluechips and large caps

SUI/USDTHello friends
You can see that after the price fell in the specified support area, the price was supported by buyers and caused the resistance to break, and now, when the price returns to the specified ranges, you can buy in steps and move with it to the specified targets, of course, with capital and risk management...
*Trade safely with us*

SUI - Last Growth Ahead Before Bear MarketHello, Skyrexians!
It's time to update BINANCE:SUIUSDT idea. Last time we pointed out that wave 3 has been finished and correction incoming. Now we are seeing this correction. Today we got the indicating that correction is over and we can see the great growth soon.
Let's look at the weekly chart. Here we can see the Elliott waves structure. Wave 3 has been finished at the recent top. Awesome oscillator gives us the hint that bull run will continue, but now that much because we have only wave 5 ahead which has a target $5-7 in the next 3-6 months. The strong confirmation that correction is over is the green dot on the Bullish/Bearish Reversal Bar Indicator below the alligator's lines.
Best regards,
Skyrexio Team
___________________________________________________________
Please, boost this article and subscribe our page if you like analysis!

Long Blub - Sui OG MemecoinDisclaimer: Ultimate Degen Play
Memecoins are leveraged plays on the Blockchain - and the OG Community Memecoin on Sui is undoubtedly Blub.
Sui is the fastest horse in this Crypto Cycle and when AltSeason finally kicks off, the community memecoins will reap all of the rewards.
The 3D chart on Blub shows the long downward wedge pattern just broke, and if we are finally entering AltSeason, you won't want to miss out on this opportunity.

SUIUSDT 5DSUI ~ 5D Analysis
#SUI Buy and hold, coin blue chip that might be included in the Top 10 Marketcap list.
Target $10 ++

Breaking: $SUI Dips 8% Today Down to $2.28Sui the layer 2 layer-blockchain platform designed to support the needs of global adoption by offering a secure, powerful, and scalable development platform, leveraging a novel object-centric data model and the secure Move programming language to address inefficiencies prevalent in existing blockchain architectures has dip 8% today amidst a broader market condition.
As of the time of writing, CRYPTOCAP:SUI is down 4.2% trading below key Moving Averages (MA) with the Relative Strength Index (RSI) currently oversold at 39 hinting at a move breaking below the support point to the 1-month low axis.
Sui Price Live Data
The live Sui price today is $2.25 USD with a 24-hour trading volume of $627,615,661 USD. Sui is down 7.77% in the last 24 hours. The current CoinMarketCap ranking is #18, with a live market cap of $7,119,977,067 USD. It has a circulating supply of 3,169,845,047 SUI coins and a max. supply of 10,000,000,000 SUI coins.
