SUI Swing Buy / Long SetupSui is on Strong and decision Order block on 1 day Timeframe, If we break this then SUI will take correction till recent weekly low. If we hold this then new ath. Book some or 80% on mentioned area, rest hold till 6$.
Suianalysis

SUI new trend started!SUI / USDT
Price broke out after long accumulation range with good volume
Looks like a new bullish trend has started

SUI : HODL BASKETHello friends🙌
🔊We have come to introduce a signal that can be a good option for your investment portfolio.
Given that the price is in the ascending channel and has good support from buyers, it is expected that this time the price will break the middle line of the channel and move to the ceiling of the channel and succeed in reaching ATH...
Don't forget about capital and risk management.⚠
🔥Follow us for more signals🔥
*Trade safely with us*
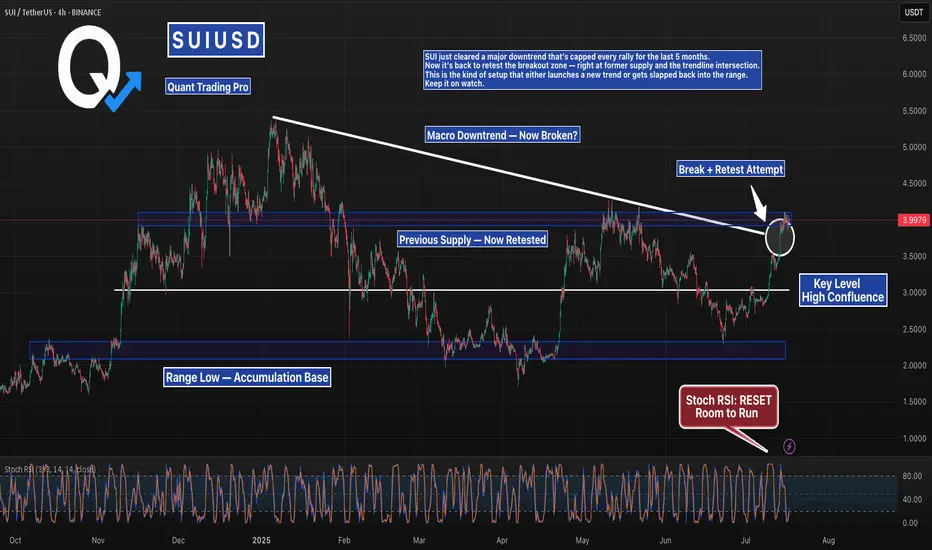
SUI Just Broke Its Downtrend — But Can It Hold?SUI just cleared a major downtrend that’s capped every rally for the last 5 months.
Now it’s back to retest the breakout zone — right at former supply and the trendline intersection.
This is the kind of setup that either launches a new trend or gets slapped back into the range.
Keep it on watch.
#SUI #SUIUSDT #CryptoBreakout #TrendlineTest #ChartAnalysis #BacktestEverything #TradingView #QuantTradingPro #CryptoTraders
Will key support be held or broken today?Hello friends
According to the complete analysis we conducted on this currency, we concluded that the price correction can continue with the failure of the specified support and go to lower supports, but if buyers support the price in the support area, it can have a good rise.
Note that with capital and risk management, you can buy in steps in the specified support areas and move with it to the specified targets.
*Trade safely with us*

SUI: Closing in on the Target Zone?SUI should continue closing in on our blue Target Zone between $2.27 and $1.72. We expect blue wave (ii) to complete there, ideally above support at $2.02, before the next move higher kicks off in wave (iii). However, because the June 22 low came within just $0.03 of our zone, we must consider the possibility that blue wave alt.(ii) has already concluded. In that case, a direct breakout above resistance at $3.60 could follow (33% probability).
📈 Over 190 precise analyses, clear entry points, and defined Target Zones - that's what we do.

SUI Collapse Incoming? Bearish Pattern You Can’t IgnoreYello, Paradisers! Is #SUI about to enter a bearish spell? We’ve seen this setup many times before, and the warning signs are stacking up fast. If you're not already positioned or protecting capital, now’s the time to pay attention.
💎SUIUSDT has started losing momentum just as a classic head and shoulders pattern has completed at the top, a formation often associated with trend reversals. This bearish structure is further validated by the presence of bearish divergence on momentum indicators, hinting at exhaustion from buyers and growing strength among sellers.
💎#SUIUSDT's neckline support at $3.60 has been breached, and since then, price has been sliding gradually. Right now, its on a path toward the $3.00 level, a moderate support area where some initial profit-taking may occur. However, according to the structure's full pattern target, the move is likely not over just yet.
💎Given the weakening market dynamics and lack of bullish follow-through, an extended dip cannot be ruled out. If sellers manage to overwhelm the $2.65 floor, the next potential landing zone would be around $2.30, a high-confluence level with a strong historical order block. This is a zone where a more meaningful bounce or even a longer-term reversal could initiate, but only if market sentiment finds footing.
💎On the other side, bulls face an uphill battle. They must reclaim the $3.65 to $3.80 resistance range, a zone that has consistently rejected upward attempts over the past several days. A breakout above this range would be the first sign of renewed bullish intent and could help ease the selling pressure.
Paradisers, strive for consistency, not quick profits. Treat the market as a businessman, not as a gambler.
MyCryptoParadise
iFeel the success🌴

SUIUSDT3.19$ best price for pollback need for pump BINANCE:SUIUSDT . but for trust bullish trend, need for breaked 3.29$.
Best support: 3.025 - 2.91 $
Best resistance: 3.29 - 3.393 - 3.563 $
Contorl Risk management for trades.

SUI📈 SUI/USDT 4H Analysis
SUI is moving strong in an ascending channel, now testing key resistance at 3.71 🚀
🟢 Support Levels:
🔹 3.47 – recent pullback
🔹 3.15 – channel bottom
🔴 Resistance Levels:
🔹 3.71 – under pressure
🔹 4.27 – next target
🔹 4.64 – strong resistance
🔹 4.83 – major zone
📊 Bulls holding the ground as long as the trend stays intact!

SUI Structure Complete – Time for Pain or Profit?Yello Paradisers, have you noticed how calm #SUIUSDT has been lately? Feels like nothing’s happening... but that's exactly how the market sets the trap before it strikes. The recent price action has lulled many into a false sense of comfort, trading tightly in a sideways structure after a strong impulsive leg. But behind that calm surface, a bigger move is loading — and only those who can read the structure properly will be prepared for it.
💎#SUI has now completed its 5-wave Elliott impulse, finishing with a classic Ending Diagonal in the fifth wave, which very often signals the final push before a correction. Given the current price action, we are likely in the early formation of an ABC corrective structure, most probably a Zigzag or Flat formation. This transition is crucial — many traders misinterpret this as the start of a new trend and get trapped. But as professionals, we know that this is not the time to rush into positions. This early corrective phase often includes fakeouts and liquidity grabs, punishing both longs and shorts before clarity returns.
💎SUI has been trading with high volatility compression, coming off a significant bullish breakout that began around early April. The rally initiated with a textbook Leading Diagonal, moved into a sharp Wave 3 impulsive expansion, and finally started to slow down into what looked like exhaustion through Wave 5. During this phase, price carved out a Contracting Triangle (Falling Wedge), providing a resting phase before the final fifth wave. But right after the Ending Diagonal was completed, momentum has stalled, and now we're entering a very tricky part of the market cycle — the corrective phase.
💎Zooming out, the entire structure has unfolded in a methodically clean and technically sound manner. Wave 1 kicked off the move with a Leading Diagonal, signaling the early stages of bullish initiation. This was followed by a shallow Wave 2 retracement, which is typical of fast, trending markets. Wave 3 then expanded with strong bullish momentum, confirming the impulse. After that, Wave 4 transitioned into a Contracting Triangle (Falling Wedge) — a classic consolidation pause before the final push. Finally, Wave 5 wrapped up the sequence with an Ending Diagonal, a clear sign of momentum exhaustion. This full five-wave development marks a textbook impulsive structure, and strongly suggests that we are now entering a critical transition phase, where the market moves from trending into correction. These are often the most deceptive parts of the cycle — known for shakeouts, liquidity traps, and emotional whiplash for those who act too soon.
💎Looking ahead, the next probable strong move depends on how price reacts around the key S/R level at $3.006. If this zone holds and the correction stays controlled above it, we can prepare for a powerful continuation leg back toward the $4.20 resistance, and potentially challenge the major resistance at $4.80–$5.00. However, if the correction unfolds deeper, a full retest of the $2.40–$2.00 range is absolutely on the table. This zone aligns with macro demand levels and could act as a reload zone for the next major impulse. But only once the correction completes.
💎One of the main hurdles SUI now faces is breaking cleanly above $4.20 — this is the near-term barrier where supply pressure remains strong. Beyond that, $4.75–$5.00 is a macro resistance zone that needs significant volume and structure to crack. Until then, any sharp move upward could just be part of a larger fakeout inside the corrective pattern.
💎On the downside, our key invalidation level sits just below $3.00. A 12H candle close below $3.006 would confirm that the support zone is lost and shift our bias into a much deeper retracement phase. This would invalidate any early bullish setups and bring the $2.40–$2.00 zone in play, with liquidity likely waiting beneath that structure.
This is the point where the weak hands get shaken out and smart money reloads. If you're aiming for long-term success, wait for high-probability setups and protect your capital. Strive for consistency, not quick profits. Treat the market as a businessman, not as a gambler.
MyCryptoParadise
iFeel the success🌴

SUI Looks Ready for the Next Leg Up | Bullish Structure IntactClean structure, clean bounce 💪
SUI holding trendline + previous support zone
Breakout from triangle = next wave incoming? 🚀
Let’s see how it plays out!
#SUI #CryptoAnalysis #TechnicalAnalysis

SUIUSDT Scalp Tradewait for to take out the downside liquidation first then enter invalidation 15m closing below the bullish ob, reclaim of 15m ob again also a long trigger. tp sl mentioned enjoy

SUI Looks Bearish (2H)From the point where we placed the red arrow on the chart, it appears that the correction in SUI has begun.
An expansionary wave structure is visible, which could potentially push SUI toward the green zone.
Targets are marked on the chart. As long as the supply zone holds, the price may move toward the targets and the green box.
A 4-hour candle closing above the invalidation level will invalidate this analysis.
For risk management, please don't forget stop loss and capital management
When we reach the first target, save some profit and then change the stop to entry
Comment if you have any questions
Thank You

SUI/USDT Long Entry at 3.507 (10x Leverage) | Strategy in PlayEntered a long position on CRYPTOCAP:SUI at 3.507 with 10x leverage. Current price action is hovering near entry. Watching key levels:
🔹 Target Zone: 3.8760+
🔻 Support Zone: ~3.25 (highlighted for potential SL zone)
🧠 TP (Take Profit) and SL (Stop Loss) will be updated as the move develops.
Keep an eye on price reaction around the support-resistance flip zone.

Shorting Sui how Far Down Are We Going ? 3.3 -3.0 ? Here is my trade I just entered with stop loss and take profit zones 1 and 2. Let me know what you think
Kris/Mindbloome Exchange
Trade Smarter Live Better

SUIUSDT - Don't wait for pullback!SUI is the star of this season — on the 3-day chart, it just broke out of a falling wedge pattern with a massive green candle.
The price also reacted strongly to the 0.618 Fibonacci level, indicating there’s still plenty of upside potential ahead.
Don’t wait for pullbacks — coins like this rarely give clear entry opportunities, and any correction is usually very shallow.
It’s either you buy now, or regret it later.
Best regards Ceciliones 🎯

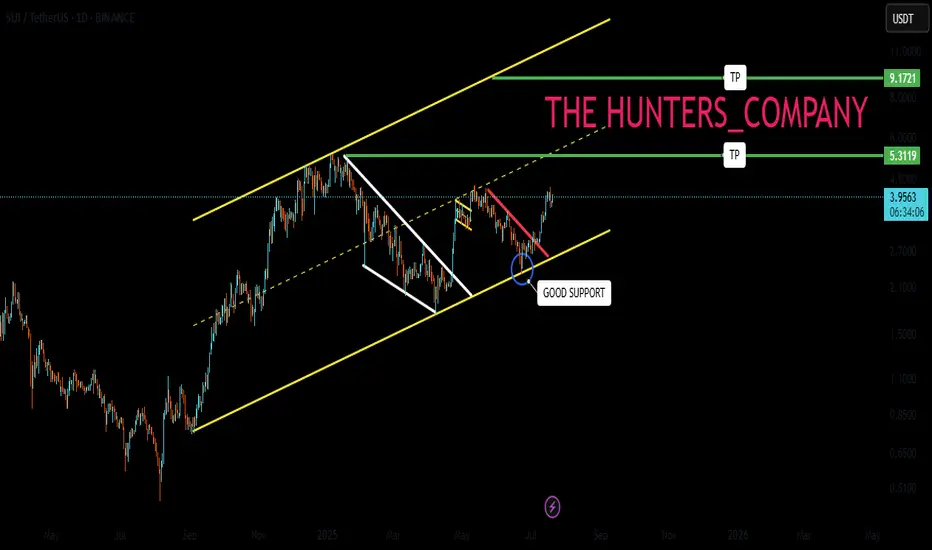
SUI whats the target ?SUI / USDT
SUI is just following my scenario 2 in previous analysis.. click here
What next ? :
With current big price surge we are looking for previous ATH , after that the main resistances are: 7$ and 9$/10$
They are considered very strong resistance but if the price could overcome them we will see SUI flying like never before
Always do risk management
Make your plan and dont FOMO
Best of wishes

SUI/USDT:BUYHello friends
Due to the price correction, we can buy in two designated areas in a stepwise manner. Elite with capital and risk management.
*Trade safely with us*

#SUI/USDT#SUI
The price is moving within a descending channel on the 1-hour frame, adhering well to it, and is heading for a strong breakout and retest.
We are seeing a bounce from the lower boundary of the descending channel, which is support at 1.86.
We have a downtrend on the RSI indicator that is about to be broken and retested, supporting the upward trend.
We are looking for stability above the 100 Moving Average.
Entry price: 1.90
First target: 1.99
Second target: 2.10
Third target: 2.19

SUI: Toward All-Time Low?SUI broke the support at $1.97 and tested it once again from below with yesterday's brief countermovement. It should now proceed downward so that the turquoise corrective wave 2 can be properly completed. Subsequently, the turquoise impulse wave 3 should provide new upward momentum, racing toward new all-time highs. The resistance at $5.36 should only be a milestone.

SUI is expected to have a 50% pump ahead (1D)SUI, after completing the 3D pattern at its price peak, has entered a corrective phase.
It is now approaching a high-potential zone, which is the origin of a strong move with significant buy orders. We are looking for buy/long positions in the demand zone.
The target could be the supply zone.
A daily candle closing below the invalidation level will invalidate our bullish outlook.
Do not enter the position without capital management and stop setting
Comment if you have any questions
thank you

SUI/USDT:BUY LIMITHello friends
Due to the heavy price drop, it can be seen that the buyers have supported the price well at the specified support and by hitting higher ceilings and floors, they are giving us a sign that they have good strength. Now we can buy in steps with capital and risk management and move to the specified targets.
Don't forget to save profit on each target.
*Trade safely with us*

SUI Rebounds from Key Demand Zone – Bullish Continuation Ahead?SUI has recently bounced from a key supply and demand zone between the 0.618 ($2.36) and 0.786 ($1.52) Fibonacci retracement levels, showing strong buyer interest in this range. This zone also coincides with a previous resistance line that has now flipped into support, adding further confluence to this area as a significant level for trend continuation.
After pulling back from its recent high around $5.44, SUI respected the 0.618 Fib level and has begun to recover, currently trading around $2.71. If momentum continues, the next resistance levels lie at the 0.5 ($2.95) and 0.382 ($3.54) Fib levels, followed by a potential move back toward the $4.26 zone.
