#SUI #SUIUSD #SUIUSDT #Analysis #Eddy#SUI #SUIUSD #SUIUSDT #Analysis #Eddy
As the chart shows, the coin has a choch & an intact, high-potential daily order block inside weekly order block that needs to be mitigation.
I have identified the important supply and demand zones of the higher timeframe for you.
This analysis is based on a combination of different styles, including the volume style with the ict style.
Based on your strategy and style, get the necessary confirmations for this analysis to enter the trade.
Don't forget about risk and capital management.
The responsibility for the transaction is yours and I have no responsibility for your failure to comply with your risk and capital management.
💬 Note: Important liquidity is marked on the chart. Be careful of liquidity hunting. In my opinion, the important entry point for buying spot and long futures is at 2.1693$, and it will most likely be a sniper entry. The first target from the specified point will be $5.5 and the second target will be $8.
Be successful and profitable.
SUIUSD

SUI Structure Complete – Time for Pain or Profit?Yello Paradisers, have you noticed how calm #SUIUSDT has been lately? Feels like nothing’s happening... but that's exactly how the market sets the trap before it strikes. The recent price action has lulled many into a false sense of comfort, trading tightly in a sideways structure after a strong impulsive leg. But behind that calm surface, a bigger move is loading — and only those who can read the structure properly will be prepared for it.
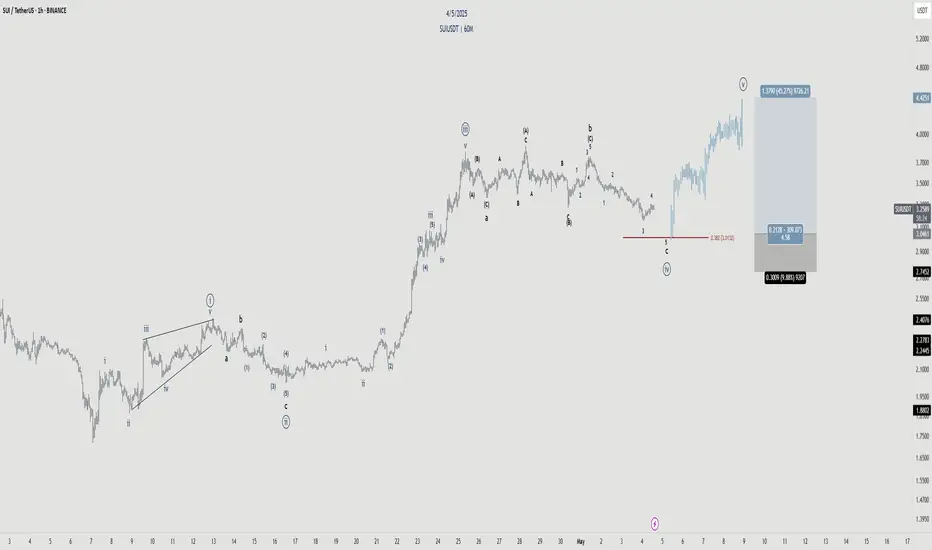
💎#SUI has now completed its 5-wave Elliott impulse, finishing with a classic Ending Diagonal in the fifth wave, which very often signals the final push before a correction. Given the current price action, we are likely in the early formation of an ABC corrective structure, most probably a Zigzag or Flat formation. This transition is crucial — many traders misinterpret this as the start of a new trend and get trapped. But as professionals, we know that this is not the time to rush into positions. This early corrective phase often includes fakeouts and liquidity grabs, punishing both longs and shorts before clarity returns.
💎SUI has been trading with high volatility compression, coming off a significant bullish breakout that began around early April. The rally initiated with a textbook Leading Diagonal, moved into a sharp Wave 3 impulsive expansion, and finally started to slow down into what looked like exhaustion through Wave 5. During this phase, price carved out a Contracting Triangle (Falling Wedge), providing a resting phase before the final fifth wave. But right after the Ending Diagonal was completed, momentum has stalled, and now we're entering a very tricky part of the market cycle — the corrective phase.
💎Zooming out, the entire structure has unfolded in a methodically clean and technically sound manner. Wave 1 kicked off the move with a Leading Diagonal, signaling the early stages of bullish initiation. This was followed by a shallow Wave 2 retracement, which is typical of fast, trending markets. Wave 3 then expanded with strong bullish momentum, confirming the impulse. After that, Wave 4 transitioned into a Contracting Triangle (Falling Wedge) — a classic consolidation pause before the final push. Finally, Wave 5 wrapped up the sequence with an Ending Diagonal, a clear sign of momentum exhaustion. This full five-wave development marks a textbook impulsive structure, and strongly suggests that we are now entering a critical transition phase, where the market moves from trending into correction. These are often the most deceptive parts of the cycle — known for shakeouts, liquidity traps, and emotional whiplash for those who act too soon.
💎Looking ahead, the next probable strong move depends on how price reacts around the key S/R level at $3.006. If this zone holds and the correction stays controlled above it, we can prepare for a powerful continuation leg back toward the $4.20 resistance, and potentially challenge the major resistance at $4.80–$5.00. However, if the correction unfolds deeper, a full retest of the $2.40–$2.00 range is absolutely on the table. This zone aligns with macro demand levels and could act as a reload zone for the next major impulse. But only once the correction completes.
💎One of the main hurdles SUI now faces is breaking cleanly above $4.20 — this is the near-term barrier where supply pressure remains strong. Beyond that, $4.75–$5.00 is a macro resistance zone that needs significant volume and structure to crack. Until then, any sharp move upward could just be part of a larger fakeout inside the corrective pattern.
💎On the downside, our key invalidation level sits just below $3.00. A 12H candle close below $3.006 would confirm that the support zone is lost and shift our bias into a much deeper retracement phase. This would invalidate any early bullish setups and bring the $2.40–$2.00 zone in play, with liquidity likely waiting beneath that structure.
This is the point where the weak hands get shaken out and smart money reloads. If you're aiming for long-term success, wait for high-probability setups and protect your capital. Strive for consistency, not quick profits. Treat the market as a businessman, not as a gambler.
MyCryptoParadise
iFeel the success🌴

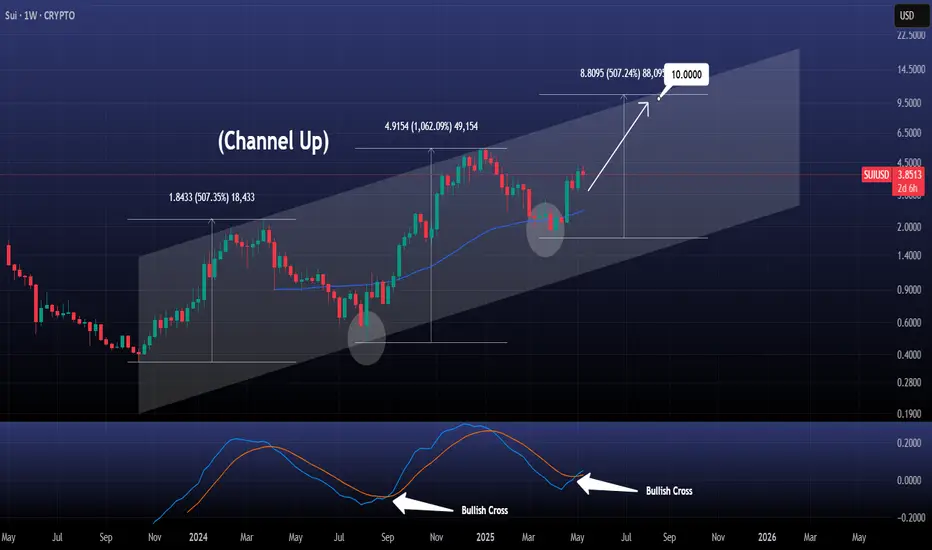
SUIUSD Massive Bullish Cross was just completed!SUI just made a Bullish Cross on the 1W timeframe, its 2nd ever.
The first one was on September 2nd 2024, 4 weeks after the price bottomed on the long term Channel Up and rebounded.
The latest Cross was also formed 4 weeks after the April 7th 2025 bottom and even though we don't expect a similar +1062% rise, we do expect the growth that the first Bullish Leg had (+507.35%).
Target $10.000 right at the top of the Channel Up.
Follow us, like the idea and leave a comment below!!
SUI - Incoming wave 5Wave structure is very defined.
Currently looking for the completion of this corrective sequence of Wave 4 before we bounce at the key level 38.2%.
Targeting the high.
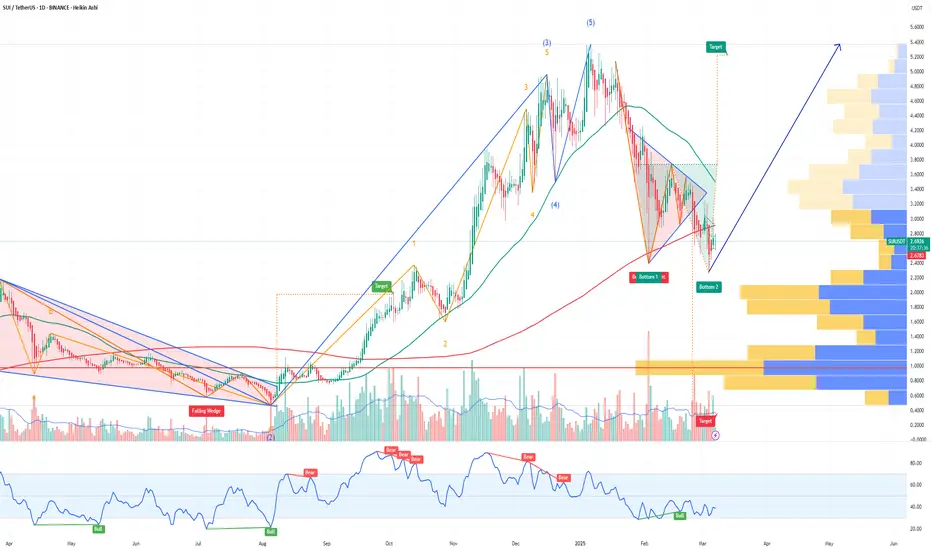
SUIUSDT; Heikin Ashi trade ideaBYBIT:SUIUSDT
Simple explanation on the chart. For any additional info's, you can let me know in the comments.
Thank you

Market in Crab Mode, but $SUI Still within Trend – Bidding at $2Bidding CRYPTOCAP:SUI under $2.1.
Although the market looks weak right now, this seems like a simple retrace into a good area. If it manages to hold the weekly trend, I don't see any problem with placing bids in this zone.
I believe BTC will need to create a new yearly low around the 75-76k range for my bids to trigger. For now, I'm fine with waiting.
Still think March will be mostly sideways or down. BINANCE:SUIUSDT

SUI Ready to Explode? Here’s What Happens NextYello, Paradisers! Is #SUI preparing for a fresh 52-week high? With a powerful pattern breakout and a golden cross in play, this could be the beginning of something big.
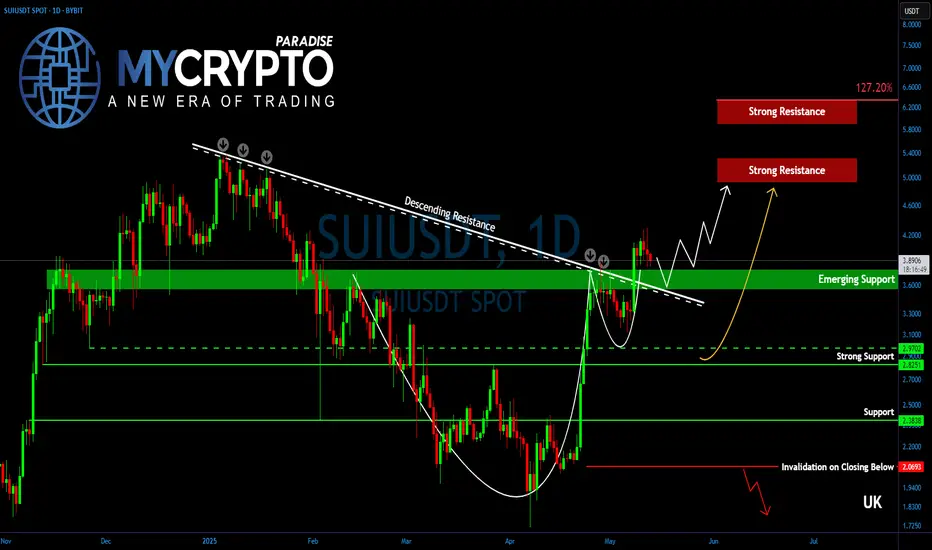
💎#SUIUSDT remains one of the strongest-performing altcoins in the current market cycle. The chart structure is now showing a cup and handle formation, paired with a clean breakout above a long-term descending trendline resistance—a combination that typically precedes strong bullish momentum.
💎At this stage, SUI is solidifying a newly-formed support zone between $3.80 and $3.60. If this support continues to hold, bulls are likely to drive price higher toward the $4.20 target, followed by a push into the $5.00 to $5.30 zone. This range marks the first major resistance cluster, as well as the previous all-time high region, and may trigger aggressive short-term profit-taking.
💎However, if bullish momentum remains intact, SUI could continue its rally toward the 127.20% Fibonacci extension level at $6.30. This is where caution becomes essential, as it represents a major technical target where price could stall or reverse.
💎Adding fuel to the fire, SUI has also confirmed a Golden Cross formation on the daily timeframe, with the EMA-50 crossing above the EMA-200. This is a powerful trend reversal signal that often acts as a driving force behind prolonged bullish movements.
Paradisers, strive for consistency, not quick profits. Treat the market as a businessman, not as a gambler.
MyCryptoParadise
iFeel the success🌴
Sui broke above the wedge & is already over halfway 2 the targetSUUSD has had a very notable pump on this uptrend which hopefully will end up being the beginning of confirming a real sustained uptrend in the alt market. *not financial advice*

SUIUSD: Enormous rally started, targeting $10Sui just turned overbought on its 1D technical outlook (RSI = 70.835, MACD = 0.285, ADX = 33.014) but doesn't seem to even take a breather here as it rebounded on its 1D MA200, establishing it as its new long term Support. The underlying pattern of this Bull Cycle is a Channel Up and technically the market has started its new bullish wave. A +500% rise from the bottom (which was accomplished on both prior bullish waves) suggests a long term TP = $10.000.
See how our prior idea has worked out:
## If you like our free content follow our profile to get more daily ideas. ##
## Comments and likes are greatly appreciated. ##

#SUI/USDT#SUI
The price is moving within a descending channel on the 1-hour frame and is expected to break and continue upward.
We have a trend to stabilize above the 100 moving average once again.
We have a downtrend on the RSI indicator that supports the upward move with a breakout.
We have a support area at the lower limit of the channel at 3.82, which acts as strong support from which the price can rebound.
Entry price: 3.90
First target: 4.10
Second target: 4.32
Third target: 4.52

#SUI/USDT#SUI
The price is moving within a descending channel on the 1-hour frame and is expected to break and continue upward.
We have a trend to stabilize above the 100 moving average once again.
We have a downtrend on the RSI indicator that supports the upward move with a breakout.
We have a support area at the lower boundary of the channel at 3.35, which acts as strong support from which the price can rebound.
Entry price: 3.43
First target: 3.62
Second target: 3.80
Third target: 4.00

SUI Going to 4.80?Hi everyone
Here is my weekly analysis on SUI, it appears we are heading to 4.80-5.20 levels before we see another correction, lets see how we go
Kris/Mindbloome Exchange
Trade Smarter Live Better

SUI - A closer lookIn my previous SUI analysis, I currently have us in an impulse structure leading into the 5th wave.
Zoomed out, it seems we're still in a corrective structure. Looking to short at the TP of the long.

SUI Looks Bearish (2H)From the point where we placed the red arrow on the chart, it appears that the correction in SUI has begun.
An expansionary wave structure is visible, which could potentially push SUI toward the green zone.
Targets are marked on the chart. As long as the supply zone holds, the price may move toward the targets and the green box.
A 4-hour candle closing above the invalidation level will invalidate this analysis.
For risk management, please don't forget stop loss and capital management
When we reach the first target, save some profit and then change the stop to entry
Comment if you have any questions
Thank You

SUIUSD is consolidating ahead of massive Leg. Can it hit $9.500?Sui (SUIUSD) has completed Stage 1 of its recovery process following the April 07 bottom. That was a Higher Low on the 2-year Fibonacci Channel Up and having already broken above both the 1D MA50 (blue trend-line) and 1D MA200 (orange trend-line), the price is now consolidating.
This is fairly similar to what it did on September 20 2024, which was followed by a strong rise to the 1.0 Fib (previous High) where the price pulled-back to the 1D MA50. That was its final test before the peak forming rally just above the 1.5 Fibonacci extension.
As a result, we expect SUI to hit at least $9.500 on the long-term.
-------------------------------------------------------------------------------
** Please LIKE 👍, FOLLOW ✅, SHARE 🙌 and COMMENT ✍ if you enjoy this idea! Also share your ideas and charts in the comments section below! This is best way to keep it relevant, support us, keep the content here free and allow the idea to reach as many people as possible. **
-------------------------------------------------------------------------------
💸💸💸💸💸💸
👇 👇 👇 👇 👇 👇

Shorting Sui how Far Down Are We Going ? 3.3 -3.0 ? Here is my trade I just entered with stop loss and take profit zones 1 and 2. Let me know what you think
Kris/Mindbloome Exchange
Trade Smarter Live Better

SUI UPDATEHello friends✌
As you can see, after a price drop, buyers were able to break the downtrend and form an ascending channel, which, given the entry of buyers, we can buy in batches with capital and risk management to move towards the specified goals.
*Trade safely with us*

SUIUSDT - Don't wait for pullback!SUI is the star of this season — on the 3-day chart, it just broke out of a falling wedge pattern with a massive green candle.
The price also reacted strongly to the 0.618 Fibonacci level, indicating there’s still plenty of upside potential ahead.
Don’t wait for pullbacks — coins like this rarely give clear entry opportunities, and any correction is usually very shallow.
It’s either you buy now, or regret it later.
Best regards Ceciliones 🎯

SUI/USDT Update - Approaching Channel Resistance! Let’s dive into the 1H chart for SUI/USDT.
Sui is riding a solid rising channel, showing strong bullish momentum!
Price has climbed from $2.25 since 22 April and is now at $3.59, with potential extention to the channel’s resistance at $4.00.
Key support holds at $3.00, with an intermediate level at $3.50.
If we break above $4.00, we could see a big move higher. But if rejected, expect a pullback toward $3.50 or $3.00.
Keep an eye on volume and price action at this resistance!

Trump's World Liberty Financial to add SUI to strategic reserve!CRYPTOCAP:SUI , a leading Layer-1 blockchain, has entered into a significant partnership with World Liberty Financial (WLFI), a decentralized finance (DeFi) platform affiliated with Donald Trump.
This collaboration involves integrating Sui's native token (SUI) into WLFI's "Macro Strategy" reserve, a strategic token fund designed to diversify holdings and support emerging blockchain projects.
The partnership also aims to explore product development opportunities leveraging Sui's technology.
WLFI's Macro Strategy reserve already includes prominent digital assets such as Bitcoin, Ethereum, and tokenized real-world assets like U.S. Treasury-backed tokens.
The addition of SUI reflects WLFI's focus on supporting innovative blockchain projects while expanding decentralized finance access to a broader audience.
The announcement of this partnership coincides with broader developments in the U.S. crypto landscape.
President Trump is expected to unveil details about a proposed "Crypto Strategic Reserve" during the White House Crypto Summit on March 7, 2025.
This reserve is anticipated to focus primarily on Bitcoin while also considering other digital assets
Trump-backed World Liberty Financial plans to add SUI to its strategic reserve.
I think the upside for SUI is Huge from here!
SUI whats the target ?SUI / USDT
SUI is just following my scenario 2 in previous analysis.. click here
What next ? :
With current big price surge we are looking for previous ATH , after that the main resistances are: 7$ and 9$/10$
They are considered very strong resistance but if the price could overcome them we will see SUI flying like never before
Always do risk management
Make your plan and dont FOMO
Best of wishes

SUI has traded back up the the equilibrium zone.As many of us already know, SUI has the ability to make some really big moves very quickly, and it's currently trading at the bottom of the equilibrium zone.
This will be very interesting to watch.
Good luck, and always use a stop-loss!

SUI Is Entering Into Final Stage Of Bull MarketHello, Skyrexians!
On yesterday's crypto pump BINANCE:SUIUSDT was the greatest performer and people started to have an interest in this coin will continue growing or this is just a bull trap. Let's try to understand it.
On the 1W time frame we have unclear, but Elliott wave structure. It looks like wave 4 overlapped with the wave 1. You will tell me that it's impossible. In practice it can happen especially on altcoins. According to the Awesome Oscillator wave 4 is finished which can be also confirmed by our Bullish/Bearish Reversal Bar Indicator . The final wave 5 will reach the green box, to have the more accurate target we need to count waves inside wave 5.
Best regards,
Skyrexio Team
___________________________________________________________
Please, boost this article and subscribe our page if you like analysis!
