SUIUSD Can it go to $12??Sui / SUIUSD hit last week the Pivot Zone that marked the initial historic opening price, the Feb & Marhc 2024 Highs and October 2024 bottom.
So far this week is reacting with a bounce.
If the bullish trend is sustained, which is also the 0.618 Fibonacci and the 1week RSI bottom like July 2024, then we expect at least a +507.35% rise towards the 1.382 Fib extension.
Buy and target $12.000.
Follow us, like the idea and leave a comment below!!
SUIUSD

SUI/USDTHello friends
Due to the recent decline, we have found a good support area for you, if it is reached, you can buy and move to the specified targets.
*Trade safely with us*
SUI/USDT 1H: Bullish Reversal Confirmed – Targeting $2.55?SUI/USDT 1H: Bullish Reversal Confirmed – Targeting $2.55?
🚀 Follow me on TradingView if you respect our charts! 📈 Daily updates!
Market Structure (Confidence Level: 8/10):
Bullish reversal confirmed after breaking $2.20 resistance with strong volume.
RSI shows hidden bullish divergence, supporting continued upside momentum.
Smart Money Analysis:
Major order block formed at $2.05-$2.10, confirming institutional accumulation.
Break of bearish market structure at $2.28, shifting momentum to the upside.
Clear accumulation pattern visible, indicating Smart Money positioning for a move higher.
Trade Setup:
Entry: $2.28 - $2.31 (current retest).
Targets:
T1: $2.45 (Fair Value Gap).
T2: $2.55 (major resistance).
Stop Loss: $2.05 (below recent swing low).
Risk Score:
8/10 – Strong risk-to-reward setup, but market volatility requires tight risk management.
Market Maker Activity:
Currently engineering liquidity build above $2.40, likely before the next leg up.
Volume profile supports bullish continuation, with Smart Money accumulating.
Recommendation:
Long positions remain favorable in the $2.28 - $2.31 range.
Monitor price action near $2.40 for signs of a breakout.
Use tight stops, given recent volatility, to protect against unexpected pullbacks.
🚀 Follow me on TradingView if you respect our charts! 📈 Daily updates!

SUI’s Wild Ride – Finding the Next Long Trade SetupSUI had an incredible 2024, skyrocketing +1060% in just 154 days. The price peaked at the psychological $5 mark, where multiple rejections signaled a momentum shift. By the end of January 2025, the trend turned bearish, leading to a sharp correction.
Trend Shift & Momentum Analysis
I've been working on a new trend identifier indicator that helps spot trends, allowing traders to identify swing trade opportunities and manage their positions effectively. This indicator clearly highlighted the momentum shift, confirming the bearish turn and the sharp price drop that followed.
Key Support Zones & Confluences
Now that the bearish trend is in play, the focus is on identifying a solid long opportunity:
Point of Control (POC) from Previous Trading Range (~$2) – A major psychological level that many traders are watching
Trend-Based Fibonacci Extension (1:1) at $2.0373 – Adding confluence to this critical support area
Fib Speed Fan (0.75 Level) – Aligns with the $2 region, reinforcing support
Anchored VWAP (~$1.885) – From the 2023 lows, acting as an additional support zone
What’s Next for SUI?
The market is in search of a strong support level where bulls can regain control. Let’s see if we find support at the $3 mark. The $2 zone stands out as a prime area for a potential long entry, given the multiple technical confluences. If price reaches this level, we’ll be watching closely for confirmation of a bullish reversal.
Final Thoughts
SUI has had an extraordinary run, but corrections are natural in strong trends. The key now is to see where price stabilises and if the bulls can make a strong comeback. Time will tell how this plays out, but for now, $2 is a level to keep an eye on for a potential long setup.
BTW: I've just launched a FREE TradingView indicator – Multi Timeframe 8x MA Support & Resistance Zones. It helps visualise key support and resistance levels across different timeframes. Check it out and let me know your thoughts!

SUI Weekly Analysis Sui is bullish so long as the green box holds.
Looking for a BOS/CHoCH on the 4HR. Until then we’re holding tight as further downside should be expected.
Stay safe out there my friends!

#SUI/USDT#SUI
The price is moving in a descending channel on the 1-hour frame and is adhering to it well and is heading to break it upwards strongly and retest it
We have a bounce from the lower limit of the descending channel, this support is at a price of 2.36
We have a downtrend on the RSI indicator that is about to break and retest, which supports the rise
We have a trend to stabilize above the Moving Average 100
Entry price 2.44
First target 2.51
Second target 2.64
Third target 2.78

#SUI/USDT#SUI
The price is moving in a descending channel on the 1-hour frame and is adhering to it well and is heading to break it strongly upwards and retest it
We have a bounce from the lower limit of the descending channel, this support is at a price of 2.40
We have a downtrend on the RSI indicator that is about to be broken and retested, which supports the rise
We have a trend to stabilize above the moving average 100
Entry price 2.48
First target 2.59
Second target 2.76
Third target 2.90

SUIUSD: 1W MA50 holding. Excellent long term buy opportunity.SUI is bearish on its 1D technical outlook (RSI = 43.481, MACD = -0.255, ADX = 17.753) as it is on a decline since the early January top. This is technically the bearish wave of the cyclical Channel Up and the Jan top was its HH. This is so far a -58% decline that almost tested the 1W MA50. This is same kind of decline after the previous HH of late March 2024. The July break under the Channel Up was a market overreaction but now since we are in the final year of the Bull Cycle, it is very unlikely to see another one. Quite possibly, as long as the 1W MA50 holds, it is more probable to gradually initiate the 3rd bullish wave of the Channel Up. Aim for a similar +500% rise, TP = 12.000.
## If you like our free content follow our profile to get more daily ideas. ##
## Comments and likes are greatly appreciated. ##

SUI/USDT UPDATE Hello friends
Given the floor that the price has made, we now see the power of buyers in the price reversal, and given the power of buyers, we can make purchases, of course, in stages and with capital management and move with it to the specified goals.
*Trade safely with us*

SUI looks Bearish (12H)It seems that SUI is completing a large structure.
A diametric pattern appears to be forming at the end of wave G.
By maintaining the red descending trendline, it could drop toward the two specified TP levels marked on the chart.
Note that TP 1 is a strong support level.
A daily candle closing below the invalidation level will invalidate this analysis.
For risk management, please don't forget stop loss and capital management
When we reach the first target, save some profit and then change the stop to entry
Comment if you have any questions
Thank You

SUI LONG IDEA - SUI NETWORKI believe we are due for an altcoin bounce, and SUI might be one of the top performers in the upcoming move. It’s definitely worth keeping an eye on SUI these days.
What happened?
The price bounced from the daily demand zone and started moving up. However, there are plenty of sell orders at the top, leading to a rejection and a slight move lower.
Game Plan:
I expect the price to retrace back to the max discount zone (Fibonacci retracement) and run the 4H liquidity while doing so.
I’ll be looking for long entries after getting LTF confirmations when we run the 4H liquidity (black line inside the green box).
Targets:
TP: $3.57 (Bearish trendline) — rest will be left to run
SL: $2.87 (Below 4H close)

SUI update#SUI is on of my favorite coins this coin has a good potential for a big rise and its always looking for liq in lower or higher prices ! just check this out
you can see that the huge drop took all the liq in lower prices
also you can see that there is a remaining liq around 3$ which is not taken
ans also we have a huge liq on higher prices which can be a sign of attraction to higher prices !

SUIUSDT 8HSUI ~ 8H Analysis
#SUI On the time frame 8H, Selling pressure on this coin seems to have been completed. Buy after successfully penetrating this resistant line with a minimum target of 10%+.

Sui Important level ! We have retraced to BISI near Equilibrium and close to OTE level
This zone is a market maker accumulation zone
Remember this when we are in bullish trend they will hunt Longs !
we can still see lower prices - we can hit previous weekly candle low
Don't be scared of these type of moves
5.6$ soon !

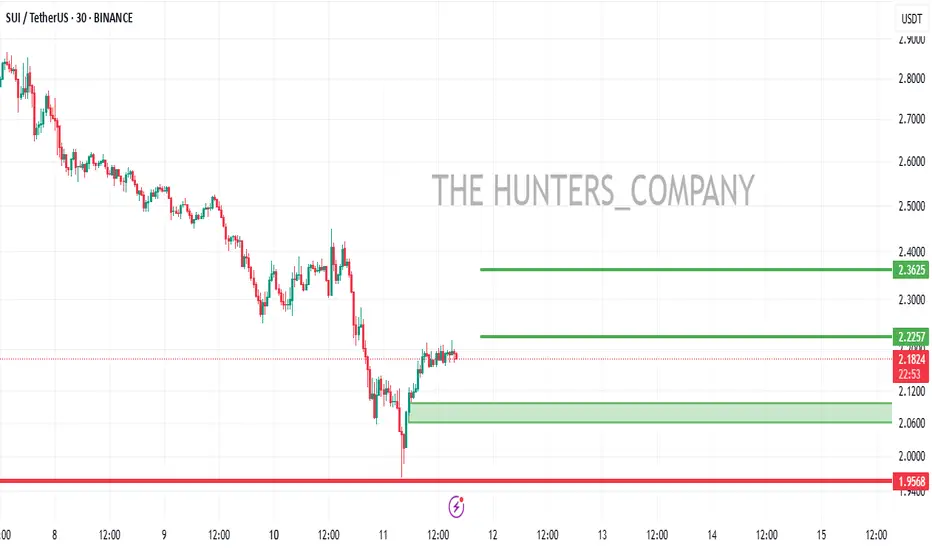
sui buy limithello friends
Considering the fall that we are suffering from the trading ceiling, the 4th step of Fibo is a good point to carry the price and with the support of the price in this area, we can move to the specified targets.
*Trade safely with us*

SUI | ALTS | BULLISH Chart Pattern?A bullish chart pattern is forming on SUI in the daily chart.
It should be noted that this patter is still premature - meaning that it's not yet completed and there is not yet the confirmation that we need to act on it:
Don't miss the most recent update on XRP here:
_________________________
COINBASE:SUIUSD

#SUI/USDT#SUI
The price is moving in a descending channel on the 1-hour frame and is adhering to it well and is heading to break it strongly upwards and retest it
We have a bounce from the lower limit of the descending channel, this support is at a price of 2.70
We have a downtrend on the RSI indicator that is about to break and retest, which supports the rise
We have a trend to stabilize above the Moving Average 100
Entry price 3.196
First target 3.36
Second target 3.56
Third target 3.83

SUI/USDT 1H: Accumulation in POC Zone – Targeting $3.40 Next?SUI/USDT 1H: Accumulation in POC Zone – Targeting $3.40 Next?
🚀 Follow me on TradingView if you respect our charts! 📈 Daily updates!
Current Market Condition:
Price at $3.13, consolidating within the equilibrium zone after rejection from $3.40.
Hidden bullish divergence forming on RSI, indicating accumulation as price makes equal lows while RSI forms higher lows.
Market Makers likely positioning within the Point of Control (POC) zone for a potential move higher.
Strong support at $3.10, aligning with FVG fill zone, reinforcing demand.
Trade Setup:
Confidence Level: 8/10 – Strong setup with favorable risk-to-reward.
Entry Zone: $3.12-$3.15.
Targets:
T1: $3.40 (previous resistance).
T2: $3.60 (premium zone).
Stop Loss: Below $3.05 (key invalidation level).
Risk Score:
8/10 – Smart Money accumulation signals strong upside potential, but confirmation is required.
Market Maker Intent:
Accumulation in progress within the equilibrium zone.
A break above $3.20 will confirm bullish continuation and increase momentum.
Multiple premium zones above suggest potential for extended upside moves.
Recommendation:
Long positions favorable within $3.12-$3.15.
Watch for a break above $3.20 to confirm bullish momentum.
Maintain a tight stop-loss at $3.05 for risk management.
Confidence Level:
8/10 – Strong Smart Money accumulation signals, with confirmation key for continuation.
🚀 Follow me on TradingView if you respect our charts! 📈 Daily updates!

Is SUI Bottoming Out? Bulls Show Immense Strength at Key Levels!Yello, Paradisers! Could this be the moment #SUIUSDT finally locks in a strong bottom? The price has just retested a major breakout level, leaving behind a long lower wick—a clear sign of aggressive buying at lower levels. The question is, are the bulls ready to take full control? Let’s break it down.
💎#SUI is currently sitting on multiple layers of strong protection, reinforcing the possibility of a long-term bottom and reversal. The first key level is at $3.05, where moderate support has formed. Since November 12th, SUI has not closed a single session below the $3.00 mark, proving that bulls are fiercely defending this zone.
💎But that’s not all. An even more critical support region lies between $2.45 and $2.30—this was the major breakout zone that fueled the last explosive rally. This area is further fortified by the 200-day moving average (MA-200), making it an incredibly tough level for sellers to crack. Any bearish move into this zone will likely face serious resistance, forcing sellers to think twice before pressing lower.
💎Meanwhile, bulls are flexing their strength, successfully rejecting a deeper downturn. If this momentum holds, SUI is well-positioned to test the $4.20 - $4.50 resistance zone next. But here’s the real game-changer: a breakout above this level, backed by strong volume, could trigger a major upside move, setting SUI up for a run toward $6.80 - $7.20.
Paradisers, as always, patience and precision are key in this market. This isn’t a time for reckless trades—let the levels guide you, trade strategically, and stay disciplined.
MyCryptoParadise
iFeel the success🌴

SUIUSD starting rally for a $12 Cycle Top.Sui / SUIUSD is reversing this week into green territory and if the 1week candle closes in gains, it will be a strong bullish signal as it would have rebounded just over the 1week MA50.
The pattern is a Channel Up for this Cycle, pushing the price slowly but steadily upwards.
Like the April 8th 2024 pull back, this week's correction almost touched the 0.5 Fibonacci retracement level, posting a symmetric 1week RSI pattern.
As long as the 1week MA50 continues to hold, we expect the new bullish wave of the Channel Up to start.
Since the December 30th high was on the 1.5 Fib extension, we believe the next one, which will most likely be the Cycle's Top, will also be on that level.
Buy and target 12.000.
Follow us, like the idea and leave a comment below!!

SUI/USDT 1H: Bullish Momentum Building – $4.20 in Sight?!SUI/USDT 1H Chart Analysis
🚀 Follow me on TradingView if you respect our charts! 📈 Daily updates!
Current Market Structure:
Price at $3.72 showing strong recovery after testing accumulation zone at $3.50-$3.60.
RSI trending at 65, confirming strong momentum but not yet overbought.
Significant volume spike on breakout above $3.50 resistance, signaling institutional interest.
Smart Money Concepts:
Market Makers accumulated heavily in the $3.50-$3.60 range, shaking out weak hands below.
Currently transitioning to a markup phase, with the next target set at the premium zone ($3.90-$4.00).
Strong bullish structure indicates continued upward movement.
Key Levels:
Entry Zone: $3.70-$3.75
Targets:
T1: $4.00 (psychological resistance)
T2: $4.20 (previous swing high)
T3: $4.50 (extended target)
Stop Loss: Below $3.45 (recent swing low).
Risk Score:
6.5/10 - Favorable risk-reward ratio, but market volatility remains a factor.
Market Maker Intent:
Accumulation phase appears complete near the discount zone. Current price action suggests an upward move targeting liquidity pools near $4.20-$4.50.
Recommendation:
Long positions are favorable within the $3.70-$3.75 range. Monitor for volume confirmation above $3.90 to secure momentum. Maintain tight stops to protect against unexpected pullbacks.
Confidence Level:
8/10 for bullish continuation toward premium zones.
🚀 Follow me on TradingView if you respect our charts! 📈 Daily updates!

sui buyhello friends
Considering the rise we had, now with the failure of trading range, we can enter into a transaction with capital management...
*Trade safely with us*

sui analysis: Safe shopping...hello friends
Considering the good upward trend we had, now that the entry price has been corrected, it is a good time to buy in steps and with capital management.
We have specified for you the steps of buying which are the support areas.
We have specified for you the goals, which are the resistance.
*Trade safely with us*
