SUI/USDT 1H: Bullish Reversal Confirmed – Targeting $2.55?SUI/USDT 1H: Bullish Reversal Confirmed – Targeting $2.55?
🚀 Follow me on TradingView if you respect our charts! 📈 Daily updates!
Market Structure (Confidence Level: 8/10):
Bullish reversal confirmed after breaking $2.20 resistance with strong volume.
RSI shows hidden bullish divergence, supporting continued upside momentum.
Smart Money Analysis:
Major order block formed at $2.05-$2.10, confirming institutional accumulation.
Break of bearish market structure at $2.28, shifting momentum to the upside.
Clear accumulation pattern visible, indicating Smart Money positioning for a move higher.
Trade Setup:
Entry: $2.28 - $2.31 (current retest).
Targets:
T1: $2.45 (Fair Value Gap).
T2: $2.55 (major resistance).
Stop Loss: $2.05 (below recent swing low).
Risk Score:
8/10 – Strong risk-to-reward setup, but market volatility requires tight risk management.
Market Maker Activity:
Currently engineering liquidity build above $2.40, likely before the next leg up.
Volume profile supports bullish continuation, with Smart Money accumulating.
Recommendation:
Long positions remain favorable in the $2.28 - $2.31 range.
Monitor price action near $2.40 for signs of a breakout.
Use tight stops, given recent volatility, to protect against unexpected pullbacks.
🚀 Follow me on TradingView if you respect our charts! 📈 Daily updates!
Suiusdt

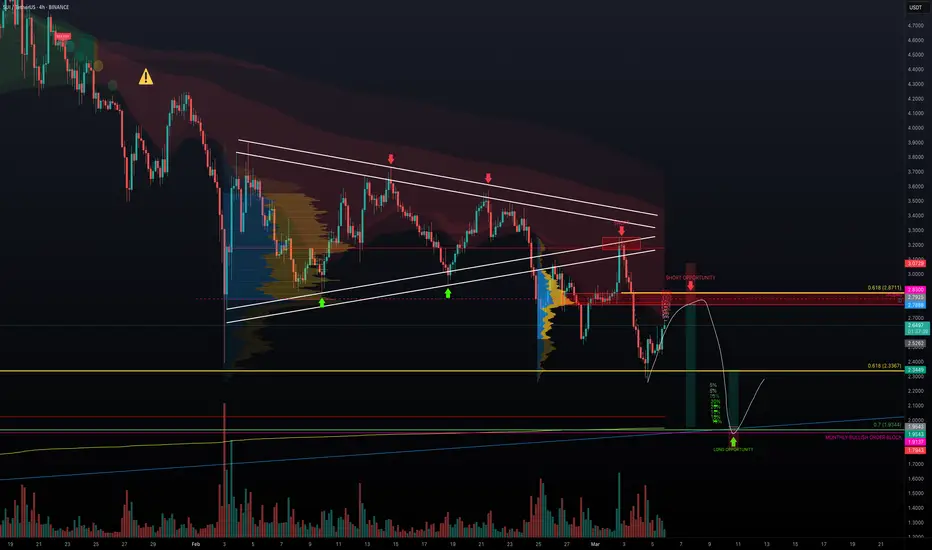
SUI - Short or Long? The Ultimate SUI Trade BlueprintHere’s an update to the analysis I did one month ago on February 10. Since then, SUI has continued to show its bearish tendencies—making lower highs and lower lows. After that dramatic 30% drop from a golden pocket short opportunity, the price started inching up on low volume. This weak rally suggests that while buyers are testing the ceiling, the overall trend remains down. That sets the stage for two possible plays: a short trade if the price reaches the resistance zone, and a long trade if it bounces off a strong support level.
1. Identification of Support and Resistance Zones
Resistance Zone (for the Short Trade):
Daily Resistance: ~2.7888
Point of Control (POC): Around 2.8035
Monthly Open: 2.83
0.618 Fibonacci Retracement: 2.8711
All these levels combine to create a robust resistance area where sellers are likely to step in.
Support Zone (for the Long Trade):
$2 Psychological Level: A key round number that attracts attention.
0.7 Fibonacci Retracement: Derived from the swing low of $0.4625 to the high of $5.3687, this places an important level at 1.9344 (just below $2).
Monthly Bullish Order Block: At 1.9137, indicating buying interest.
Fib Speed Fan (0.786): Points to support near the $2 mark.
POC: 2.0225
Anchored VWAP: Calculated from the deep low at $0.362, which again aligns around $2.
These multiple layers of confluence make the $2 area a strong support zone and an attractive entry point for a long trade.
2. Short Trade Setup
The Plan:
Building a short position gradually using a laddering strategy. With a $15,000 allocation from a $100,000 account, scale in at different levels to keep risk in check.
Scaling In (Entry Levels):
Entry # Entry Price % of Position Amount Invested ($)
1 2.6808 5% $750
2 2.7070 5% $750
3 2.7314 10% $1,500
4 2.7552 10% $1,500
5 2.7755 10% $1,500
6 2.7990 15% $2,250
7 2.8242 20% $3,000
8 2.8485 25% $3,750
Total: Avg. ~2.7924 $15,000
Stop Loss: Set at $3.07, limiting the risk to about $1,506 (roughly 10% of the trade allocation or 1.51% of the account).
Scaling Out (Exit Levels):
Exit Cover Price % of Position Amount Paid to Cover ($)
1 2.7925 5% $750.02
2 2.1715 5% $583.23
3 2.1365 10% $1,147.66
4 2.0981 20% $2,254.07
5 2.0630 20% $2,216.36
6 2.0257 10% $1,088.14
7 1.9930 15% $1,605.87
8 1.9625 15% $1,581.29
Outcome:
Total: Avg. ~2.09 $11,226.65
Net Profit: $15,000 (initial proceeds) – $11,226.65 (cost to cover) = $3,773.35
Profit % on Trade: +25.16%
Risk-to-Reward Ratio (R:R): Approximately 2.51
This laddering approach helps to secure profits at various levels while managing the risk effectively.
3. Long Trade Setup
The $2 support zone is a magnet, backed by multiple confluences. When SUI tests this area and shows signs of a rebound, it sets up a great opportunity to go long.
Key Support Details:
$2 Psychological Level: A well-watched price point.
0.7 Fibonacci Retracement: Places a key level at 1.9344 from the low ($0.4625) to the high ($5.3687).
Monthly Bullish Order Block: At 1.9137, adding to the support.
Fib Speed Fan (0.786): Confirms support near $2.
POC & Anchored VWAP: Both clustering around $2 (POC at 2.0225 and VWAP from a low of $0.362).
Trade Details:
Entry: Buy at $2.00
Target: Sell at $2.337 for an approximate 20%+ gain
Stop Loss: Set just below $1.80 to protect against further downside
Risk-to-Reward Ratio: About 2.44 or better
Wrapping It Up
In this dual-setup strategy, we're well-prepared for different market outcomes:
Short Trade: If SUI rallies into the tightly clustered resistance zone, scale into a short with defined entries, exits, and a stop loss that caps our risk at about 1.51% of the account. Exit ladder aims for an average cover price of around $2.09, netting a neat profit of approximately $3,773 (or +25.16% on the trade).
Long Trade: Conversely, if SUI finds strong footing at the confluence-rich $2 support zone, we can flip to a long position. Entering at $2.00, with a target of $2.337 and a stop loss below $1.80, gives an attractive risk-to-reward ratio of roughly 2.44.
This approach lets us capitalise on both sides of the market. Keep an eye on volume and price action. Happy trading! P.S. If you have any coin requests, feel free to share them in the comments. I will be selecting one or two for the next TA.
FIDAUSDT UPDATEFIDAUSDT is a cryptocurrency trading at $0.1094. Its target price is $0.2400, indicating a potential 100%+ gain. The pattern is a Bullish Falling Wedge, a reversal pattern signaling a trend change. This pattern suggests the downward trend may be ending. A breakout from the wedge could lead to a strong upward move. The Bullish Falling Wedge is a positive signal, indicating a potential price surge. Investors are optimistic about FIDAUSDT's future performance. The current price may be a buying opportunity. Reaching the target price would result in significant returns. FIDAUSDT is poised for a potential breakout and substantial gains.

OMUSDT UPDATEOMUSDT is a cryptocurrency trading at $6.2800. Its target price is $8.0000, indicating a potential 25%+ gain. The pattern is a Bullish Falling Wedge, a reversal pattern signaling a trend change. This pattern suggests the downward trend may be ending. A breakout from the wedge could lead to a strong upward move. The Bullish Falling Wedge is a positive signal, indicating a potential price surge. Investors are optimistic about OMUSDT's future performance. The current price may be a buying opportunity. Reaching the target price would result in significant returns. OMUSDT is poised for a potential breakout and substantial gains.

SUI Weekly Analysis Sui is bullish so long as the green box holds.
Looking for a BOS/CHoCH on the 4HR. Until then we’re holding tight as further downside should be expected.
Stay safe out there my friends!


#SUI/USDT#SUI
The price is moving in a descending channel on the 1-hour frame and is adhering to it well and is heading to break it upwards strongly and retest it
We have a bounce from the lower limit of the descending channel, this support is at a price of 2.36
We have a downtrend on the RSI indicator that is about to break and retest, which supports the rise
We have a trend to stabilize above the Moving Average 100
Entry price 2.44
First target 2.51
Second target 2.64
Third target 2.78

#SUI/USDT#SUI
The price is moving in a descending channel on the 1-hour frame and is adhering to it well and is heading to break it strongly upwards and retest it
We have a bounce from the lower limit of the descending channel, this support is at a price of 2.40
We have a downtrend on the RSI indicator that is about to be broken and retested, which supports the rise
We have a trend to stabilize above the moving average 100
Entry price 2.48
First target 2.59
Second target 2.76
Third target 2.90

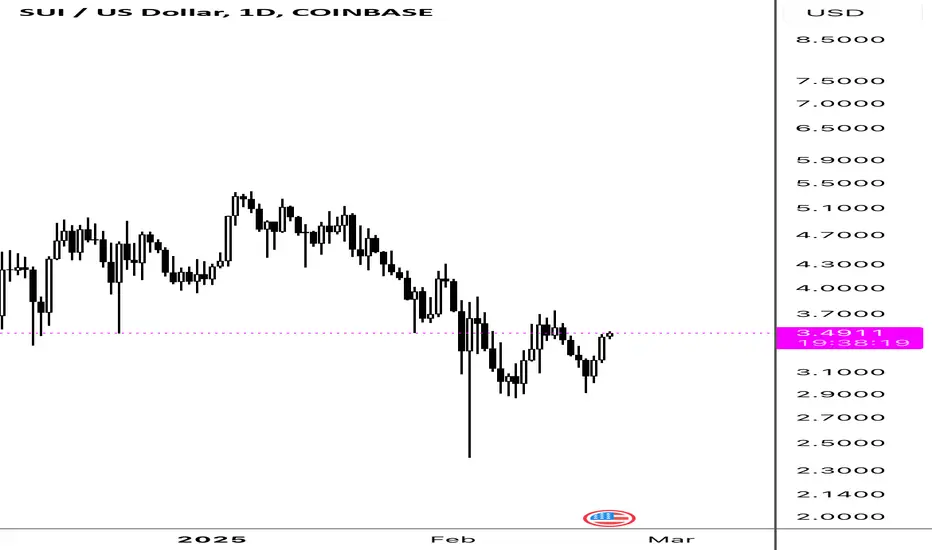
Sui: Mixed Signals With A Hard Chart (Bullish Later)I don't like it when there is too much empty space below the active candles, you what I mean? Below support here on the chart, there is just too much room for prices to move lower. But, when we are looking at a strong project things can be different but I still don't like it.
SUIUSDT. The level that worked as resistance in October 2024 is now working as support, March 2025. This is a good signal.
The action is still weak and there can be lower prices but, I bet there is some bullishness coming from the RSI and this indicator is what we will consider next.
The RSI bottomed 7-Feb. while SUIUSDT hit its lowest price 4-March. So we have a small bullish divergence, an early bullish signal.
The down-wave first bounced perfectly off 0.618 Fib. retracement, on a wick. Now there was a wick below this level but two close above. This is another positive signal but still early and still weak. So it is mixed.
It is possible that SUIUSDT can start to reverse, but the fact is that it is moving lower and there is now volume, yet, to support a bullish wave.
It will recover soon enough near support. It will recover very soon... That's for sure.
Allow for some swings but it won't be too long. The Cryptocurrency market as a whole will grow.
I am betting up.
Namaste.

President Trump's World Liberty Financial partners with SUIPresident Trump's World Liberty Financial partners with SUI to launch a Strategic SUI Reserve a move that saw SUI surged 13% today with a speculated 100% surge in the short term should CRYPTOCAP:SUI break the $4 resistant zone, a 100% surge is inevitable.
The layer-1 blockchain platform designed to support the needs of global adoption by offering a secure, powerful, and scalable development platform had a great start of the year as it broke out surging to $5 early the start of the year.
Sui Price Live Data
The live Sui price today is $2.96 USD with a 24-hour trading volume of $1,481,325,553 USD. We update our SUI to USD price in real-time. Sui is up 18.74% in the last 24 hours, with a live market cap of $9,373,175,223 USD. It has a circulating supply of 3,169,845,047 SUI coins and a max. supply of 10,000,000,000 SUI coins.

SUI/USDT UPDATE Hello friends
Given the floor that the price has made, we now see the power of buyers in the price reversal, and given the power of buyers, we can make purchases, of course, in stages and with capital management and move with it to the specified goals.
*Trade safely with us*

Univers Of Signals | SUI👋 Welcome to Univers Of Signals Channel!
Let's analyze and review one of the most popular coins in the market, sui, and update our previous analysis and find new triggers
🌐 Bitcoin Overview
Before starting today's altcoin analysis, let's look at Bitcoin on the 1-hour timeframe. Since yesterday, Bitcoin experienced a correction, which was necessary for the market, and it pulled back to the 102135 range. The next trigger for a long position will be a breakout above 104714.
Yesterday's correction, coupled with an increase in Bitcoin dominance, caused noticeable declines in some altcoins. This highlights the importance of monitoring BTC pairs in your checklist these days.
📊 Weekly Timeframe
In the weekly time frame, it is one of the coins that is in good condition, it is really in the market and is still fluctuating on the high support levels.
After hitting 5.24, we made a new ceiling or ATH, and after that, due to recent market news, we experienced some drops, and this has also caused the price correction of this coin.
For re-buying, if we make a good support candle at this level 2.4, it will be a good trigger and the main trend will start again after we break 5.24. Also, after breaking 1.77, we can temporarily exit this coin and cash out!
📈 Daily Timeframe
In the daily time frame, it has been in relatively good conditions compared to other coins in the market and has experienced fewer declines and still has a lot of support to lose!
After breaking the 1.0333 level, which was our trigger spot, we made our purchase and experienced a move after its failure with the entry of momentum and recorded a new ceiling with this event!
Along with this trend, we can draw our Fibonacci levels, which are currently involved in the important level of 0.382, and after it rises and breaks the ceiling of 5.24, we can experience a powerful move!
If this level is broken, we can also hit the support levels of 1.7702 and 1.3859 and we need to form a structure to buy now, but after breaking the trend line and the 3.65 trigger, it can be a good point! For selling, I will continue to hold for now!
📝 Final Thoughts
Stay calm, trade wisely, and let's capture the market's best opportunities!
This analysis reflects our opinions and is not financial advice.
Share your thoughts in the comments, and don’t forget to share this analysis with your friends! ❤️

SUI looks Bearish (12H)It seems that SUI is completing a large structure.
A diametric pattern appears to be forming at the end of wave G.
By maintaining the red descending trendline, it could drop toward the two specified TP levels marked on the chart.
Note that TP 1 is a strong support level.
A daily candle closing below the invalidation level will invalidate this analysis.
For risk management, please don't forget stop loss and capital management
When we reach the first target, save some profit and then change the stop to entry
Comment if you have any questions
Thank You

TradeCityPro | SUIUSDT Is the best time to buy ?👋 Welcome to TradeCityPro Channel!
Let's analyze and review one of the most popular coins in the market, sui, and update our previous analysis and find new triggers
🌐 Bitcoin Overview
Before starting today's altcoin analysis, let's look at Bitcoin on the 1-hour timeframe. Since yesterday, Bitcoin experienced a correction, which was necessary for the market, and it pulled back to the 102135 range. The next trigger for a long position will be a breakout above 104714.
Yesterday's correction, coupled with an increase in Bitcoin dominance, caused noticeable declines in some altcoins. This highlights the importance of monitoring BTC pairs in your checklist these days.
📊 Weekly Timeframe
In the weekly time frame, it is one of the coins that is in good condition, it is really in the market and is still fluctuating on the high support levels.
After hitting 5.24, we made a new ceiling or ATH, and after that, due to recent market news, we experienced some drops, and this has also caused the price correction of this coin.
For re-buying, if we make a good support candle at this level 2.4, it will be a good trigger and the main trend will start again after we break 5.24. Also, after breaking 1.77, we can temporarily exit this coin and cash out!
📈 Daily Timeframe
In the daily time frame, it has been in relatively good conditions compared to other coins in the market and has experienced fewer declines and still has a lot of support to lose!
After breaking the 1.0333 level, which was our trigger spot, we made our purchase and experienced a move after its failure with the entry of momentum and recorded a new ceiling with this event!
Along with this trend, we can draw our Fibonacci levels, which are currently involved in the important level of 0.382, and after it rises and breaks the ceiling of 5.24, we can experience a powerful move!
If this level is broken, we can also hit the support levels of 1.7702 and 1.3859 and we need to form a structure to buy now, but after breaking the trend line and the 3.65 trigger, it can be a good point! For selling, I will continue to hold for now!
📝 Final Thoughts
Stay calm, trade wisely, and let's capture the market's best opportunities!
This analysis reflects our opinions and is not financial advice.
Share your thoughts in the comments, and don’t forget to share this analysis with your friends! ❤️

COTIUSDT UPDATECOTIUSDT is a cryptocurrency trading at $0.08793. Its target price is $0.15000, indicating a potential 80%+ gain. The pattern is a Bullish Falling Wedge, a reversal pattern signaling a trend change. This pattern suggests the downward trend may be ending. A breakout from the wedge could lead to a strong upward move. The Bullish Falling Wedge is a positive signal, indicating a potential price surge. Investors are optimistic about COTIUSDT's future performance. The current price may be a buying opportunity. Reaching the target price would result in significant returns. COTIUSDT is poised for a potential breakout and substantial gains.

SUI Perp LongYou can literally long COINBASE:SUIUSD with leverage and just become rich with $100.
Stop playing. Start max longing.
Fairly easy.
Profit targets: $10 // $20
$SUI - Long Trade IdeaCRYPTOCAP:SUI filled its down-wick completely
Longing here at cmp, dca if it dips a bit at 2.50
Stop below 2.45
Targets:
tp1 - $2.70
tp2 - $3
tp3 - $3.20

STXUSDT UPDATESTXUSDT is a cryptocurrency trading at $0.900. Its target price is $1.600, indicating a potential 90%+ gain. The pattern is a Bullish Falling Wedge, a reversal pattern signaling a trend change. This pattern suggests the downward trend may be ending. A breakout from the wedge could lead to a strong upward move. The Bullish Falling Wedge is a positive signal, indicating a potential price surge. Investors are optimistic about STXUSDT's future performance. The current price may be a buying opportunity. Reaching the target price would result in significant returns. STXUSDT is poised for a potential breakout and substantial gains.

OPUSDT UPDATEOPUSDT is a cryptocurrency trading at $2.000. However, the target price is unusually lower at $0.600, which seems incorrect. Typically, a target price is higher than the current price. Assuming the target price is actually higher, the potential gain would be significant. The pattern is a Bullish Falling Wedge, a reversal pattern signaling a trend change. This pattern suggests the downward trend may be ending. A breakout from the wedge could lead to a strong upward move. The Bullish Falling Wedge is a positive signal, indicating a potential price surge. Investors are optimistic about OPUSDT's future performance. The current price may be a buying opportunity. Reaching the corrected target price would result in significant returns.

SUI LONG IDEA - SUI NETWORKI believe we are due for an altcoin bounce, and SUI might be one of the top performers in the upcoming move. It’s definitely worth keeping an eye on SUI these days.
What happened?
The price bounced from the daily demand zone and started moving up. However, there are plenty of sell orders at the top, leading to a rejection and a slight move lower.
Game Plan:
I expect the price to retrace back to the max discount zone (Fibonacci retracement) and run the 4H liquidity while doing so.
I’ll be looking for long entries after getting LTF confirmations when we run the 4H liquidity (black line inside the green box).
Targets:
TP: $3.57 (Bearish trendline) — rest will be left to run
SL: $2.87 (Below 4H close)

TFUELUSDT UPDATETFUELUSDT is a cryptocurrency trading at $0.05370. Its target price is $0.09000, indicating a potential 50%+ gain. The pattern is a Bullish Falling Wedge, a reversal pattern signaling a trend change. This pattern suggests the downward trend may be ending. A breakout from the wedge could lead to a strong upward move. The Bullish Falling Wedge is a positive signal, indicating a potential price surge. Investors are optimistic about TFUELUSDT's future performance. The current price may be a buying opportunity. Reaching the target price would result in significant returns. TFUELUSDT is poised for a potential breakout and substantial gains.

OGNUSDT UPDATEOGNUSDT is a cryptocurrency trading at $0.0835. Its target price is $0.1200, indicating a potential 50%+ gain. The pattern is a Bullish Falling Wedge, a reversal pattern signaling a trend change. This pattern suggests the downward trend may be ending. A breakout from the wedge could lead to a strong upward move. The Bullish Falling Wedge is a positive signal, indicating a potential price surge. Investors are optimistic about OGNUSDT's future performance. The current price may be a buying opportunity. Reaching the target price would result in significant returns. OGNUSDT is poised for a potential breakout and substantial gains.

SEIUSDT UPDATESEIUSDT is a cryptocurrency trading at $0.2740. Its target price is $0.4500, indicating a potential 60%+ gain. The pattern is a Bullish Falling Wedge, a reversal pattern signaling a trend change. This pattern suggests the downward trend may be ending. A breakout from the wedge could lead to a strong upward move. The Bullish Falling Wedge is a positive signal, indicating a potential price surge. Investors are optimistic about SEIUSDT's future performance. The current price may be a buying opportunity. Reaching the target price would result in significant returns. SEIUSDT is poised for a potential breakout and substantial gains.
