$SUI Gearing Up to Break Triple Resistance?CRYPTOCAP:SUI is consolidating under resistance which often leads to a breakthrough but can take some time.
Price is sat above the daily pivot after breaking the downward trend resistance, but still under the daily 200 EMA and High Volume Node resistance. A pop above $3.09 swing high would be a bullish signal to long towards a first target of $4.2 High Volume Node.
Analysis is invalidated with a move below $2.7, leaving heavy resistance still ahead.
Safe trading
Suiusdt

$SUI is showing strength again. It's bouncing from a strong support zone and respecting the upward trendline, signs that buyers are stepping in.
If it reclaims the $3 level, we could see a solid move toward $5.78.
Looks like the Bulls are warming up.
DYOR, NFA.
#SUI #Suiusdt

Sui update hello friends👋
✅️Considering the drop we had, now the price has reached an important and good support and the price has been supported by the buyers and the downward trend line has broken and the ceiling has been raised. Considering this, it was possible to enter into the transaction with capital and risk management and move to the specified goals with it.
🔥Join us for more signals🔥
*Trade safely with us*

SEI LIMIT FOR BUYHello friends
Due to the price drop, we can buy on the drop within the specified limits and move with it to the specified targets, of course with capital and risk management.
*Trade safely with us*

SUI SIGNAL...Hello friends
As you can see, buyers entered the price correction and a reversal pattern is being built...
Due to the buying pressure and the entry of buyers, we can buy within the specified ranges and move towards the set targets, of course with capital and risk management.
*Trade safely with us*

Will suffering be broken today?Hello friends
Given the good price rise, you can see that the price has entered a range, which indicates that it is gathering strength for its next move.
Now we can buy in steps with risk and capital management and move with it to the specified targets.
*Trade safely with us*
SCRUSDT UPDATE
Pattern: Falling Wedge Breakout
Current Price: \$0.268
Target Price: \$0.398
Target % Gain: 50.1%
Technical Analysis: SCR has broken out of a falling wedge pattern on the 12H chart with a clean close above resistance. The breakout is backed by bullish candles and increasing volume, suggesting a potential 50% move upward.
Time Frame: 12H

SUIUSDT Forming Falling WedgeSUIUSDT is currently showing a very strong bullish technical setup as it forms a classic falling wedge pattern, which is widely known in crypto trading for its high probability of signaling a reversal to the upside. The pattern, combined with increasing volume, is suggesting that buyers are stepping in to absorb the remaining supply. With an expecting gain projection of 90% to 100%+, this crypto pair is gaining a lot of attention from traders looking for high-reward opportunities in the altcoin market.
SUI is an emerging project that has been gaining momentum thanks to its innovative technology and scalable blockchain infrastructure. The community around SUI continues to grow, fueled by new partnerships, ecosystem development, and increased investor confidence. This fundamental growth aligns well with the technical breakout setup, making the current price action even more interesting for swing traders and long-term holders alike.
The support zone that has formed around the base of the wedge pattern appears to be holding firmly, providing a solid foundation for a potential rally. If SUIUSDT manages to confirm its breakout and attract further buying volume, traders could see a strong move toward the next resistance levels. Monitoring on-chain activity, sentiment, and overall market conditions will be key to navigating this move efficiently.
✅ Show your support by hitting the like button and
✅ Leaving a comment below! (What is You opinion about this Coin)
Your feedback and engagement keep me inspired to share more insightful market analysis with you!

#SUI Ready to Grow up?#SUI
The price is moving within a descending channel on the 1-hour frame and is expected to break and continue upward.
We have a trend to stabilize above the 100 moving average once again.
We have a downtrend on the RSI indicator that supports the upward break.
We have a support area at the lower boundary of the channel at 2.83, acting as strong support from which the price can rebound.
We have a major support area in green that pushed the price higher at 2.75.
Entry price: 2.87.
First target: 2.95.
Second target: 3.04.
Third target: 3.14.
To manage risk, don't forget stop loss and capital management.
When you reach the first target, save some profits and then change your stop order to an entry order.
For inquiries, please comment.
Thank you.

Skeptic | SUI Breakdown: Precision Triggers for Spot & FuturesWelcome, traders, its Skeptic! 😎 Ready to unlock SUI’s next big move? I’m delivering a pro-level breakdown of SUI, the #12 crypto with a $10.4B market cap.This Analysis dives into recent performance, ecosystem growth, and technical triggers for spot and futures trading, all rooted in cycle-based strategies. Trade with no FOMO, no hype, just reason , Let’s conquer SUI! 🚖
Recent Performance & Key Events
SUI , trading at $ 2.98 with a $ 10.4 billion market cap, ranks as the # 12 cryptocurrency globally. A Layer-1 blockchain using the Move programming language, it boasts parallel transaction processing with over 160,000 TPS. In July 2025, SUI showed strong momentum, surging 10% in 24 hours and 12% weekly after bottoming in the $2.30–$2.40 range. However, a 44 million token unlock ($122M) on July 1 introduces potential selling pressure. 📊
Technical & Market Position
SUI’s Total Value Locked ( TVL ) reached $ 2.1 billion in early 2025, ranking it the 8th largest blockchain by TVL. Its DeFi ecosystem is exploding, with stablecoin volume jumping from $ 400M to $ 1.2B . Bitcoin integration and a Microsoft partnership bolster institutional adoption, signaling strong fundamentals despite volatility.
Technical Analysis
Daily Timeframe
The Daily (HWC) is in an uptrend, holding above the upward trendline (marked in blue). The major trend remains bullish unless this trendline breaks. However, the MWC is bearish, with declining volume during recent price rises suggesting a secondary corrective trend rather than a primary bullish trend. As Mark Andrew Lim notes in The Handbook of Technical Analysis, rising prices need increasing volume to confirm trader conviction and bullish momentum. Low volume indicates trend weakness, typical of corrective moves.
Spot Trigger (Long): Break of the downward corrective trendline with consolidation above resistance at $ 3.0408 . The last series breaking this trendline saw 85 % growth, but don’t rush in. Confirm with:
Falling BTC.D (Bitcoin dominance).
Total 3 long triggers (market-wide altcoin signals).
SUI/BTC uptrend, with an initial trigger on breaking its downward trendline and a primary trigger at 0.00003998 resistance.
Key Insight: Volume confirmation is critical. Without a volume surge on breakout, the risk of fakeouts is high.
4-Hour Timeframe (Futures Triggers)
On the 4-hour chart, if price reacts again at resistance $ 3.0890 , you can go long on a breakout, confirmed by RSI entering oversold. If it rejects sharply, the next long trigger is a break of $3.1606. For shorts, a break below support at $2.6593 is a strong trigger, especially with volume confirmation.
Pro Tip: Volume is king for all triggers. Without a volume spike on breakout, fakeout risk is high. Always apply capital management—1%–2% risk per trade to stay safe.
Final Vibe Check
This SUI Analysis equips you with precise triggers for spot ($3.0408) and futures ($3.0890/$3.1606 long, $2.6593 short) trading, leveraging cycle-based strategies. Want more cycle setups or another pair? Drop it in the comments! If this analysis sharpened your edge, hit that boost—it fuels my mission! 😊 Stay disciplined, fam! ✌️
💬 Let’s Talk!
Which SUI trigger are you eyeing? Share your thoughts in the comments, and let’s crush it together!

$SUI Breakout Alert, Is the Move Just Getting Started?CRYPTOCAP:SUI , after accumulating for a while in LTF, broke through, it looks good here.
Long at CMP, add more up to $2.84 with a stop loss of $2.69.
I will be posting more potential trade setups soon.
Stay tuned and follow for more.
DYOR, NFA.

SUi SUi Fui Fui - thats how shinchan saysOkay so shinchan says it gonna move up, loss and profits are yours lolol

SUI/USDT Short Setup (2025-07-25)SUI/USDT Short setup for day traders.
Please enter with confirmation in 5M time frame.
⚠️ This Analysis will be updated ...
👤 Sadegh Ahmadi: GPTradersHub
📅 2025.Jul.2
⚠️(DYOR)
❤️ If you apperciate my work , Please like and comment , It Keeps me motivated to do better

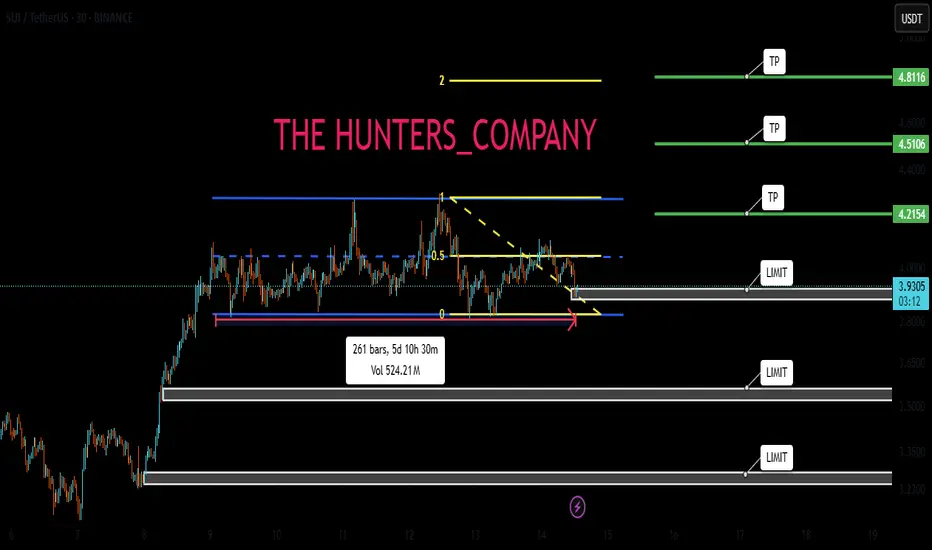
SUI Wave 3 of 3 Started?SUI appears to have completed a local wave (2) at the .618 Fibonacci retracement and a larger degree wave 2 at the alt-coin golden pocket between .618-.782
Triple resistance looms ahead of the daily 200EMA, major resistance High Volume Node and descending resistance trend line.
A breakthrough and close above will be a bullish sign with an initial target of the December swing high range $4.48
Analysis is invalidated below the $2.5 swing low, locking in ABC correction instead.
The bullish case is in jeopardy below $2.29 swing low.
Safe trading

sui usdt tradeBased on the time analysis and the blocks created, I believe the target shown in the image is the next price target.
Sui: Bullish Potential w Leverage, Between 4-8X (PP: 720%-1440%)Sui looks great right now. This is a pair that I am approaching with leverage considering only a relatively small range, a 180% target. When multiplied by your number of leverage you can get an idea of the total profits potential. For example, 8X would be equal to 1440% while 4X gives 720%.
Technical analysis
How do we know the correction is over? We don't. We never do, but we always make an educated guess.
The higher low found support at 0.786 Fib. retracement relative to the initial breakout. Support is always found at one of these fib. levels with the 0.786 being the lowest on a bullish bias. When prices go as low as 0.786 a resumption of the bullish move is high probability. This can always be supported by additional signals of course.
Additional signals
Bitcoin is strongly bullish above $106,000 on a daily basis. The altcoins market tends to grow when Bitcoin consolidates at high prices.
The altcoins that moved first all remain bullish rather than producing a major crash. This means that the bullish cycle is on or else those that move strongly revert as soon as resistance is found. When a pair finds resistance and after a few days continues to challenge it, this is super bullish. This is what I am seeing on the pairs that I am tracking, and we are only concerned with the pairs we track because there are thousands of trading pairs and everything is always possible. Opportunities are endless.
Drawings vs numbers
The drawings and technical analysis are for learning and entertainment. The numbers, chart setup, entry and timing are the opportunity.
You can use one, you can use both. Whatever you do, is up to you.
Please keep in mind that there is always risk involved, especially when using leverage.
Do your own research and planning. Accept your mistakes, learn from these mistakes and success is guaranteed. When life hits you hard, stand up and try again. These are only lessons that will help us improve our game.
Challenges build resilience and character. Bring them all...
I am ready for battle, I am ready for profits, I am ready for success.
Thank you for reading.
Namaste.

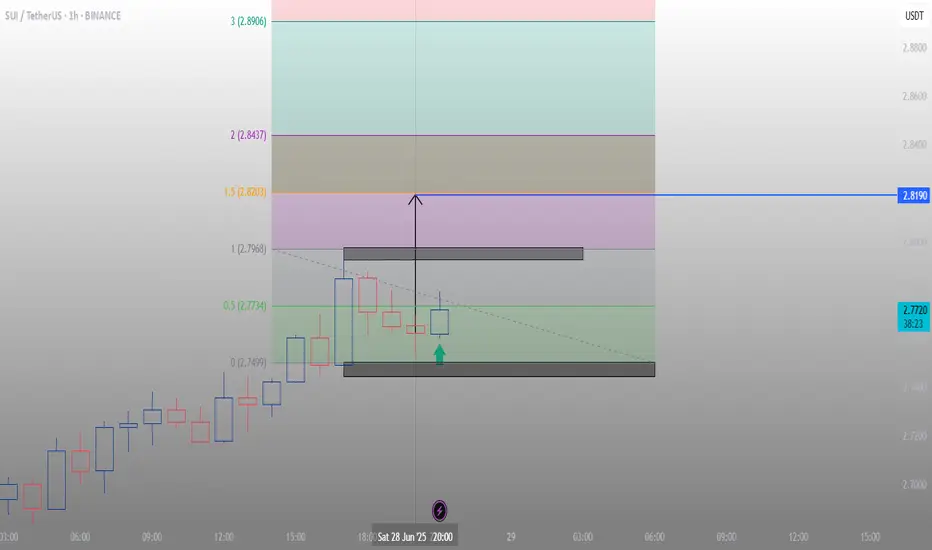
SUI Wave 2 Complete?CRYPTOCAP:SUI appears to have completed a wave 2 pullback at the 'alt-coin' golden pocket Fibonacci retracement 0.786.
Price tested the S2 daily pivot as support, which adds confluence to the .786 Fib. A bullish engulfing candle followed, negating the previous 3 days price action but price still has to overcome resistance.
A sustained breakout above the descending orange trend line and major resistance will be a queue to go long.
Analysis is invalidated below $2.28.
Safe trading

SUI - SUI thats how air soundsSo i told how you air sounds, about SUI? It looks like it will take top liqudity and then form the force within what it shall happen!

SUI - Only way is up.BINANCE:SUIUSDT (1W CHART) Technical Analysis Update
SUI is currently trading at $2.77and showing overall bullish sentiment
Price has touches the trending support and managed to bounce back from the support, this is a good sign. I see a good opportunity for long trade here with a decent stoploss.
Entry level: $ 2.77
Stop Loss Level: $ 1.77
TakeProfit 1: $ 3.6997
TakeProfit 2: $ 4.2126
TakeProfit 3: $ 5.7785
TakeProfit 4: $ 9.5494
TakeProfit 5: $ 14.1762
Max Leverage: 5x
Position Size: 1% of capital
Remember to set your stop loss.
Follow our TradingView account for more technical analysis updates. | Like, share, and comment your thoughts.
Cheers
GreenCrypto

SUI Collapse Incoming? Bearish Pattern You Can’t IgnoreYello, Paradisers! Is #SUI about to enter a bearish spell? We’ve seen this setup many times before, and the warning signs are stacking up fast. If you're not already positioned or protecting capital, now’s the time to pay attention.
💎SUIUSDT has started losing momentum just as a classic head and shoulders pattern has completed at the top, a formation often associated with trend reversals. This bearish structure is further validated by the presence of bearish divergence on momentum indicators, hinting at exhaustion from buyers and growing strength among sellers.
💎#SUIUSDT's neckline support at $3.60 has been breached, and since then, price has been sliding gradually. Right now, its on a path toward the $3.00 level, a moderate support area where some initial profit-taking may occur. However, according to the structure's full pattern target, the move is likely not over just yet.
💎Given the weakening market dynamics and lack of bullish follow-through, an extended dip cannot be ruled out. If sellers manage to overwhelm the $2.65 floor, the next potential landing zone would be around $2.30, a high-confluence level with a strong historical order block. This is a zone where a more meaningful bounce or even a longer-term reversal could initiate, but only if market sentiment finds footing.
💎On the other side, bulls face an uphill battle. They must reclaim the $3.65 to $3.80 resistance range, a zone that has consistently rejected upward attempts over the past several days. A breakout above this range would be the first sign of renewed bullish intent and could help ease the selling pressure.
Paradisers, strive for consistency, not quick profits. Treat the market as a businessman, not as a gambler.
MyCryptoParadise
iFeel the success🌴

$SUI follow up for June 2025CRYPTOCAP:SUI has tapped my support zone around $2.85, which is currently holding well.
That said, the broader trend remains corrective, and it's likely only a matter of time before this support gives way.
If that happens, we could see a drop into my green buy zone — sitting just below a major order block. A break there might trigger heavy liquidations and a sharp move to the next support level.
I don't expect a deeper crash, as bulls are showing strong activity to defend this area.
If you set buy orders around this zone, a solid bounce could offer attractive profits.
As always, DYOR.
This is a follow up for this idea from May 2025

SUI landslide incomingSUI has lost support and has fallen below $3.55, and then failed to regain any ground above it repeatedly. The expectation is that it will hit the March 27 high of $2.82 and then possibly fall further.

SUI Long Swing Setup – Confluence of Support and Fibonacci LevelSUI has pulled back into a key confluence zone, aligning with both the 61.8% Fibonacci retracement and horizontal support. We’re now eyeing the $2.70–$2.80 area for a potential long entry.
📌 Trade Setup:
• Entry Zone: $2.70 – $2.80
• Take Profit Targets:
o 🥇 $3.40 – $3.60
o 🥈 $4.00 – $4.20
• Stop Loss: Daily close below $2.65
