#SUI (SHORT) entry range(2.0844- 2.2500) T.(1.1421) SL(2.3300)I will take this risk to short BINANCE:SUIUSDT from this price (2.0844), please do your own plan....
BINANCE:SUIUSDT
entry range (2.0844- 2.2500))
Target1 (1.4590) - Target2 (1.1421)
SL (2.3300)
*** I will take this risk , please do your own plans ***
*** No FOMO - No Rush , it is a long journey ***
**** #Manta ,#OMNI, #DYM, #AI, #IO, #XAI , #ACE #NFP #RAD #WLD #ORDI #BLUR #SUI #Voxel #AEVO #VITE #APE #RDNT #FLUX #NMR #VANRY #TRB #HBAR #DGB #XEC #ERN #ALT #IO #ACA #HIVE #ASTR #ARDR #PIXEL #LTO #AERGO #SCRT #ATA #HOOK #FLOW #KSM #HFT #MINA #DATA #SC #JOE #RDNT #IQ #CFX #BICO #CTSI #KMD #FXS #DEGO #FORTH # AST #PORTAL #CYBER #CLV #RIF ENJ #ZIL #APT #MAV #ZRX ****
Suiusdt

SUI at Risk: Bearish Momentum and Key Levels to Watch!Yello, Paradisers! Is SUI heading for another leg down, or will it surprise us with a breakout? Here's our take.
💎SUI is showing strong bearish momentum right now as it faces a key supply area. One of the main signals confirming this is the bearish divergence on the RSI indicator, which often indicates a potential price drop. If SUI gets rejected again (as it did previously), there’s a good chance it will revisit the 1.7180 demand zone, possibly giving us a short-term rebound before continuing its downward journey toward the 1.6 support level.
💎This 1.6 area is crucial because a break below this zone would validate a double-top pattern, suggesting a significant bearish move. Should this happen, we could see SUI targeting the Bullish OB at the 1.24 level.
💎However, if SUI breaks out above its All-Time High (ATH) at 2.18 and closes the day above it, this will invalidate the bearish setup. Such a breakout would signal a bullish continuation, and we’d expect prices to push higher. In that case, it would be wise to close any short positions on SUI, as the trend could shift significantly.
Discipline, patience, and strategic positioning are key here.
MyCryptoParadise
iFeel the success🌴

#SUI/USDT#SUI
The price is moving in an ascending channel on the 1-hour frame upwards and is expected to continue.
We have a trend to stabilize above the 100 moving average again.
We have an upward trend on the RSI indicator that supports the rise by breaking it upwards.
We have a support area at the lower limit of the channel at a price of 1.70.
Entry price 1.75.
First target 1.87.
Second target 1.94.
Third target 2.00.

SUI done? or...If you find this information inspiring/helpful, please consider a boost and follow! Any questions or comments, please leave a comment!
Finally have a bit of a break of the HL.
IF it is ready for a Wave 4.
I would really like to see a move down to 1.45 and react before a move back to 2$, to load a long.
Still time to put in a wave B so may not be ready yet.
Trade Safe,
Trade Clarity.

DreamAnalysis | SUI Coin Analysis Key Spot and Futures Triggers📊 Welcome to Today's Analysis!
Today, we're diving into the SUI coin, exploring its potential and sharing key entry and exit triggers for futures trading. Let’s get started!
🚀 Overview of SUI Coin:
The SUI coin operates within the blockchain and DeFi sectors, and it has recently garnered significant hype. This excitement is clearly reflected in its chart, indicating strong market interest.
📈 Daily Timeframe Analysis:
In the daily timeframe, after breaking the trigger at 1.0193, the price has experienced substantial growth and has now reached resistance at 1.8339. Currently, the price is consolidating just below this resistance level.
🔄 Next Steps:
I believe the price will wait for the SMA25 to align with the candles before any momentum enters the market. If it breaks through 1.8339, we could consider both long futures positions and spot purchases.
If momentum doesn’t materialize, the price may correct to the 0.382 Fibonacci level, which coincides with 1.4324, before initiating its next movement. As long as the price maintains higher highs and higher lows in the daily timeframe, I view the trend as bullish and will refrain from selling in the spot market. The most critical support level for SUI is at 0.7562.
🛒 Spot Buying Triggers:
In addition to the 1.8339 trigger, I prefer the more reliable trigger at 2.1325 for spot purchases, while opening a futures position at the first trigger. The RSI entering the overbought zone will provide additional confirmation for both triggers.
⏱️ 4-Hour Timeframe Analysis:
In the 4-hour timeframe, the weakness of the bullish trend is quite evident. After breaking 1.4324, the volume has decreased significantly. Following this, there was a notable rejection at resistance 1.9009, and the price is currently resting after reacting to the 1.6260 range.
⚠️ Short Position Considerations:
Breaking the trigger at 1.9009 is a viable but risky option for a short position. Given the ongoing bullish trend in the daily timeframe, the risk of hitting a stop loss is high. We could consider opening a primary short position after breaking 1.4324. A break below 44.43 in the RSI could confirm the entry of bearish momentum.
🌟 Long Position Opportunities:
For a long position, breaking 1.9009 presents an excellent opportunity. I aim to open a long position after this resistance is broken. The next trigger for a long position is 2.1325, which I believe is more suited for spot trading, as opening a futures position may prove challenging.
🔍 Conclusion:
Stay vigilant with your trading strategies and keep an eye on these key levels as we navigate the market! Happy trading!
⚠️ Disclaimer:
This information is for educational purposes only and does not constitute financial advice. Always conduct your own research and consult a licensed financial advisor before making any investment decisions.

Sui price skyrocketed 140% in September: is ATH possible?Sui (SUI) Price, a Layer 1 blockchain token, has seen a significant uptick in market valuation recently. Despite broader market downturns, the SUI price has surged over the past week. This increase positions SUI holders advantageously as optimism in the altcoin sector rises, potentially setting the stage for a robust October rally.
Following the launch of its mainnet, the Sui Foundation introduced the Sui Bridge. This new feature enhances connectivity between the Ethereum and Sui networks by enabling secure asset transfers. This development is anticipated to draw new users and boost liquidity, further propelling Sui’s growth trajectory.
The SUI price has steadily climbed over the past 24 hours, as shown in the chart. At the time of reporting, the SUI price stands at $1.87, marking a 5% increase for the day.
The coin has encountered a notable barrier at the $2 level. Market conditions could soon favor an increase towards this mark. A rise to $2.18 would equal its peak from six months ago on March 27, 2024. Such a development could lead to a nearly 15% increase from its current level.
The Moving Average Convergence Divergence (MACD) indicates a potential shift in momentum. The MACD line converges towards the signal line, suggesting that a bearish crossover might be imminent. This is underscored by the histogram moving into the red zone, a sign that bears may be gaining strength.
Sui’s impressive price surge, growing TVL, and increased investor confidence signals strong potential for further gains. However, technical indicators suggest caution, as market conditions could shift. A move past $2 may set the stage for new highs

SUI/USDT UptrendSUI/USDT is currently in an uptrend, supported by the ascending trendline and EMAs.
SUI is currently in a consolidation phase above the EMAs (Exponential Moving Averages), which have been acting as strong support. The MACD is showing signs of consolidation. The MACD lines are getting closer, suggesting a possible bullish crossover. The histogram, with bars close to zero, reinforces that the market is in a moment of indecision. It is important to wait for a clear MACD crossover to confirm a new direction.
Support: 1.8125 / 1.7204
Resistance: 1.9341 / 2.0125

SUI Recovery in Play: Targeting $1.44 After Key BreakoutAfter reaching an all-time high (ATH) above $2 at the end of March, SUI entered a correction that pushed the coin below the key $1 level, reaching a low just under $0.50 on August 5th. However, SUI quickly recovered, and by August 8th, the SUI/USDT pair had broken above the falling resistance line of the channel, hitting a high above $1 on August 12th.
Following this move, the coin consolidated below this critical level, forming a clear higher low around the $0.75 zone. Currently, SUI is trading back above $1, sitting just below an important technical resistance. A breakout above this resistance appears imminent, with the first target for further upside being $1.44, representing a potential 40% rise.
Looking further ahead, if the broader crypto market continues to show optimism toward the end of the year, SUI could potentially retest its previous ATH above $2.

Up 46% Since Last Entry. What's next?
🔥📊 SUI Surges 47% Since September - Is $3 Next? 💥
Since my last post on September 19th, SUI has soared by 47%, moving from $1.31 to the current $1.88. We’re now approaching the first major resistance at $2.03, where I'll be considering taking some profits. However, the next big target is at $3.02.
For more details on mid-term targets, be sure to check out my previous chart linked below. As always, October tends to be a historically strong month for the markets, so this momentum could continue.
Stay sharp, and let’s make the most of it!
One Love,
The FXPROFESSOR 💙
Main chart and levels:

SUI breaks out with 132% volume surge: is a bull run ahead?Sui (SUI) is capturing the market’s attention with its recent price movement and increased trading volume. Many traders and analysts are wondering whether this momentum could signal the start of a sustained uptrend.
Therefore, it’s essential to examine key market metrics to understand the full picture.
At press time, SUI was trading at $1.73, reflecting a 2.98% increase over the past 24 hours. This steady rise signals growing confidence among investors.
Furthermore, Sui continues to test important resistance levels, which highlights the bullish sentiment surrounding the token.
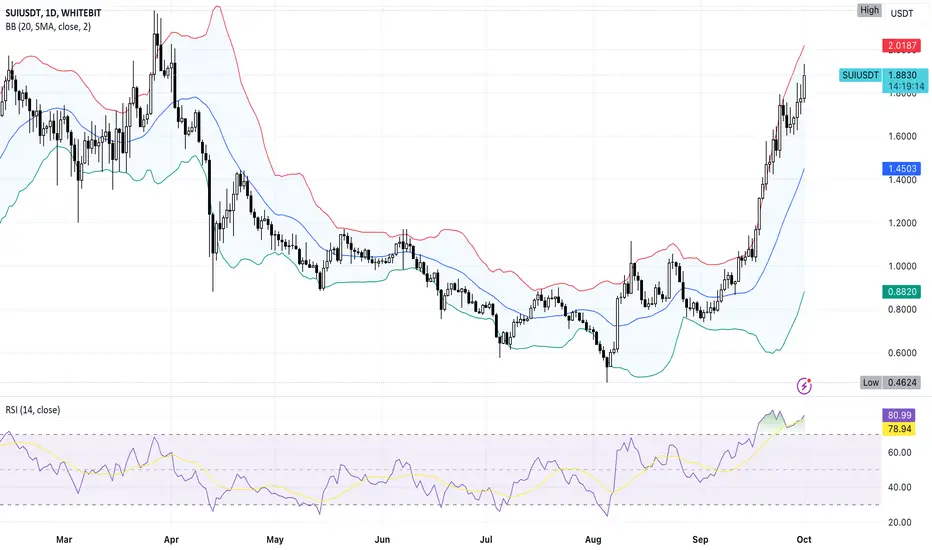
The widening Bollinger bands between $1.40 and $1.97 suggest that volatility is increasing. In addition, the RSI stands at 78.02, deep in overbought territory, indicating robust buying pressure.
However, traders should remain cautious, as overbought conditions sometimes signal a potential short-term pullback.
Moreover, the surge in SUI’s trading volume is undeniable. With a massive 132.55% increase, the volume now sits at $2.71 billion. This significant rise underscores growing interest in the token across both spot and derivatives markets.
Historically, such volume spikes have preceded sharp price movements, and therefore, this increase could propel Sui’s price even higher in the coming days.
Given the current market conditions—rising price, surging volume, and increasing social dominance—SUI appears poised for continued growth.
While short-term pullbacks may occur, the data overwhelmingly supports the likelihood of a new uptrend. However, traders should stay vigilant as markets can shift quickly.
#SUI/USDT#SUI
The price is moving in a descending channel on the 1-hour frame and is sticking to it very well and is about to break upwards
We have a bounce from the lower limit of the channel at 1.690
We have a downtrend on the RSI indicator about to break, which supports the rise
We have a trend to stabilize above the moving average 100
Entry price 1.727
First target 1.800
Second target 1.862
Third target 1.936

SUI: Steady or sleepy?If you find this information inspiring/helpful, please consider a boost and follow! Any questions or comments, please leave a comment!
Followed the count up and hit the target box.
Now
Support Zones:
$1.450: Immediate support level if the price pulls back.
$1.161: A deeper support level, which coincides with significant previous price action.
Elliott Wave Structure: The chart shows a potential completing wave 3, and a potential corrective wave 4 before possibly moving into wave 5, which might bring a new high.
Outlook: The overall trend is bullish but it is getting extended.
Breaking the higher low pattern may be the signal a correction at the larger degree is coming.
Trade Safe.
Trade Clarity.

#SUI (SPOT) entry ( ,82- ,94 ) T. (1.4590) SL (0.7415)
entry range ( ,82- ,94 )
Target (1.4590)
SL .4H close below (0.7415)
#SUI
#SUIUSDT
#SUIUSD
#swingtrade
#shortterminvestment
#ALTCOIN
#Cryptotading
#cryptoinvesting
#investment
##trading
#cryptocurrencytrading
#bitcoininvestments
#Investing_Coins
#Investingcoins
#Crypto_investing
#Cryptoinvesting
**** #Manta ,#OMNI, #DYM, #AI, #IO, #XAI , #ACE #NFP #RAD #WLD #ORDI #BLUR #SUI ****
#bitcoin
#BTC
#BTCUSDT
BINANCE:SUIUSDT

SUI's Impressive Performance
SUI started its upward trend when it broke through a 5.5-month downtrend shortly after its first listing times.
Now, by breaking through another 5-month downtrend between April and August, it has initiated a new uptrend. In just 2 months, it has quadrupled in price, capturing the market's attention.
After breaking the resistance of the blue downtrend, the price retested this level for two weeks and then continued upward. This indicates a healthy price movement.
The next significant resistance level seems to be around $1.86 - $1.95. If SUI can successfully maintain its price above this level, we can expect a positive short-term view.
In case of a potential pullback, we can use the orange uptrend channel as a reference. This is a healthy structure that has been in place since SUI's bottom. I believe it will provide good support during any retracements. It's upper line shows anout $1.4 nowadays.

SUI - Breakout imminent or back to support?Let's talk about SUI; at this moment, it could be the new narrative of smart contracts. It has all the cards on the table to steal the throne from Solana as the new project of the moment. All the factors are in place for this to happen: extremely fast transactions, high trading volume, excellent on-chain volumes, and a constantly growing ecosystem. Aside from fundamental analysis, it has proven to be stronger than its other rivals recently, and the resistance and support levels are very clear. Personally, I would like to buy around $0.4, but if I don't have the opportunity, I will wait for the breakout/retest. In my opinion, it is not the right time to open positions; I am observing for now.

Sui (SUI) scores 11% growth in the last 24 hours: analysisWith a bullish recovery rally gaining momentum, the SUI token price shows an exponential rise. Over the past 24 days, it has increased by 135%, with a streak of massive bullish engulfing candles.
Currently, it is challenging the 78.60% Fibonacci level at $1.74. With a golden crossover in the daily chart, the RSI line is trading high in the overbought zone.
Based on the Fibonacci level, the next target for this rising altcoin stands at $2.00, with the upside potential to the $3.00 resistance level at $1.618 Fibonacci level.

DO NOT MISS SUI RUN NYSE:SUI has finally woke up, for those who missed the breakout, you can hopefully get a pullback in this area to ride the trend towards 2.15 this trade opportunity is a -40% risk for a potential +90%
If you are not comfortable to swing-trade this is not for you, just take go scalp instead of locking money in this trade which may take several weeks. Follow me for more updates!

Sui (SUI): are we seeing 5$ growth?As the bull run in the crypto market gains momentum, the SUI price skyrockets at a breakneck speed. With a streak of bullish candles, the uptrend in SUI is challenging a resistance trendline near the initial price of $1.6785.
Will a new breakout run surpass the 78.60% Fibonacci level to hit the $5 psychological mark in October?
With a rounding bottom reversal in the weekly chart, the SUI price reveals a trend reversal rally. As the altcoin exceeds more than 100% returns in the last three weeks, the uptrend in SUI surpasses the $1.50 psychological mark.
The rounding bottom reversal teases a double bottom pattern with a neckline near $1.67. Further, the all-time high of $2.18 remains a high supply zone, and a breakout above this will boost the bull run.
Currently, the SUI price is trading at $1.55 with an intraday drop of 2.04%, concluding the bullish streak. Trading at just a 30% discount from its all-time high, the bull run shows potential for a new all-time high.
With the bullish trend reversal rally gaining momentum, the SUI price is likely to complete a double-bottom reversal beyond the 78.60% Fibonacci level at $1.7712.
Based on the Fibonacci levels, the uptrend in the SUI price is likely to target the $3 and $5 psychological mark. Further, the bull run history of the crypto market in October bolsters the chances of hitting the target.
On the flip side, the support levels for SUI are present at $1.50 and $1.33.

SUI/USDT Technical Analysis, 154% Potential surge in few weeks.SUI is showing strength as it approaches a critical resistance level. A confirmed breakout could push SUI into a price discovery phase, opening up the potential for significant gains.
Current Price: Around $1.02
Optimal Entry Zone: $0.75 to $1.00
Target: $2.58 (154% potential gain)
Resistance: A breakout above this level could unlock major upside potential
Lower Support: Strong support around $0.50
Two Potential Scenarios:
Scenario 1: A breakout and daily close above $1.10 will trigger a strong buy signal.
Scenario 2: A retest of the lower level between $0.75 to $0.95 offers an opportunity to accumulate.
Strategy:
To maximize gains while minimizing FOMO, consider buying 30% at the current price (CMP) and adding the remaining 70% if either of these scenarios plays out. This way, you’re positioned for profit regardless of the market's direction.
A breakout above this key resistance could see SUI reaching new highs.
This is a setup worth watching, especially for those looking to accumulate on retests.
Please keep it on your radar!
Not financial advice. DYOR!
Want more setups for spot and futures? Follow me and like this post!
Thank you
#PEACE

SUI-eat impulse!?If you find this information inspiring/helpful, please consider a boost and follow! Any questions or comments, please leave a comment!
Testing a larger flipped level here so holding above this level (1.45) would be ideal. For the Elliott wave, it has not yet reached a most likely target for a wave 3, so it is still in ZigZag territory. A push up to that level and I would look back to (1.45) to plays as support for the wave 4.
Trade Safe,
Trade Clarity.

SUI may see a new ATH in the nearest future: analysisIn the last 24 hours, Sui (SUI) has demonstrated a strong upward movement, catching the attention of analysts and traders alike.
Meanwhile, market analysts are increasingly optimistic about SUI’s price movement, with predictions of a new all-time high in sight. One prominent voice, Bluntz Capital, projects that the token could reach a price of $2.60 shortly. According to his analysis, the altcoin recently broke out of a significant 105-day downtrend, experiencing a 237.5% increase in value from $0.40 to $1.35.
Bluntz highlighted that the token’s breakout has been accompanied by rising trading volume, signaling strong market interest and investor confidence. Furthermore, the token has surpassed key resistance levels without significant retracements, reinforcing the view that it could continue its upward trend.
While the bullish sentiment around the token is clear, the token must break through key resistance levels to maintain its upward trajectory. Namely, one of them – $1.44 – has been overcome, meaning that the $2.18 can be the next point for SUI if the momentum is kept.
By contrast, it could face a short-term pullback to the $1.20 level. If the downward pressure continues, the token could revisit the $1.00 mark, a key support area around the 50% Fibonacci retracement level.


Sui's fundamental growth is seeing price surgeThe Sui chain is trying to enter BIG4 category
Since October last year its been clear that the BIG3 are Eth, Sol and BSC. BSC has been losing market share since 2021 but is still dominant to second tier chains.
Out of the second tier chains Sui has been growing. Now competitive with only Avax.. Sui is trying to make its way into becoming apart of the BIG4 if not replace BSC in the BIG3.
Sui has seen a price surge off the back of this
As Sui grows and expands into things like USDC integration.. the price will likely align. We are enter a stage of value investing within crypto which shows the development within the space. Sui is proving itself as one to keep an eye on in that regard.
