BTC.D : READY FOR ALT-SEASONHi Guys, Hope You well
As you can see, the trend is finally breaking and the downtrend is starting again for the growth of the altcoins in the market. I hope you get the best profits from this alt season, which may be the last alt season and the best in this market cycle.
SecondChanceCrypto
⏰ 9/May/26
⛔️DYOR
Suiusdt

SUI all aboard...!!! The SUI train is leaving the station!Looks like retracement wave 4 has finished around $3.12, and we are now in wave 5. Wave 3 can never be the shortest of waves 1, 3, and 5. But wave 5 is often 0.618 or 1.0 times the length of wave 1 or wave 3.
Today, a bullish announcement that U.S. banks can legally custody crypto for clients was made.
I think this is the catalyst that will cause wave 5 to be almost as big as wave 3.
Also BTC at the time of this writing is 99K+ and nearing the psychological milestone of 100k!
The SUI train has left the station!

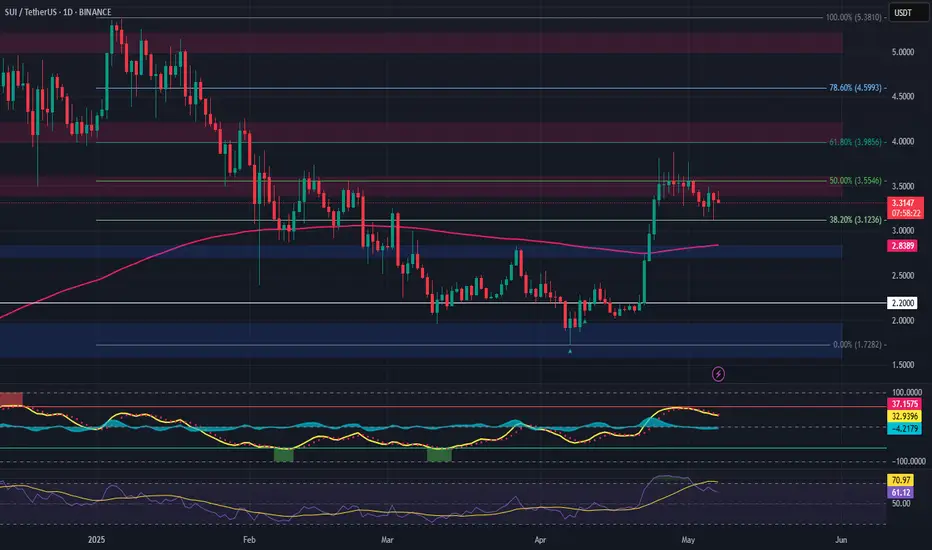
SUI/USDT: From Base Building to BreakoutSUI’s daily chart embodies textbook base‐and‐breakout dynamics. Having bottomed near $1.91, reclaimed key demand at $2.28, and smashed through successive dynamic resistances, the chart now projects a clear path toward prior supply at $4.60 and beyond. That said, every breakout merits healthy skepticism: a retest of the $3.35–3.60 zone—and its ability to hold—will be the acid test of true strength.
Next Steps for the Trader/Investor: monitor volume and price action in the coming sessions, be ready to buy on a clean retest, and manage risk tightly below invalidation levels. If SUI can sustain above $4.00 and flip former resistance into support, we may be witnessing the dawn of its next up-cycle.

Sui: Your Altcoin ChoiceThe action is happening right above 0.786 Fib. retracement level support. Above it, the actual level wasn't hit and this is a signal of strength.
I looked at this chart when the action was happening above 0.618 and mentioned that it could drop further before the start of the next bullish wave. See what happened, as soon as the next support gets challenged, volume goes up. This is significant volume in comparison with the daily average. The highest volume since November 2024.
This volume signal can be easily translated as support found. Support found means that the down-move is no more. The down-move being over invariably leads to change. Change means the market won't be dropping no more. If it was going down, soon, SUIUSDT should start to grow. That's my conclusion based on the data coming from the chart.
Even if prices move a bit lower, the bullish bias still remains. There is an ending diagonal on the chart. This pattern tends to show up before a change of trend. The correction is over. It is only a matter of time before the next bullish wave.
Thanks a lot for your amazing and continued support. It is truly appreciated.
It is not possible to project an accurate ATH for this pair because the chart is too young. Relevant numbers for 2025 are $9.42 and $15.24.
Namaste.

SUI ANALYSIS📊 #SUI Analysis
✅There is a formation of Descending Channel Pattern in daily time frame in #SUI .
Also there is a perfect breakout and retest. Now we can expect a bullish move. If the price successful retest the major support zone then we will see more bullish move
👀Current Price: $3.89
🎯 Target Price : $4.25
⚡️What to do ?
👀Keep an eye on #SUI price action and volume. We can trade according to the chart and make some profits⚡️⚡️
#SUI #Cryptocurrency #Breakout #TechnicalAnalysis #DYOR

$Bitcoin approaching ATHBitcoin approaching ATH 👀
CRYPTOCAP:BTC breaks out of a multi-month descending triangle and flips key resistance into support.
Now pushing toward the $110K zone, a consolidation range is expected just below the all-time high.
Momentum looks strong.
ATH, retest soon?

SUI – Long Trade Setup After Trend ReversalSUI has broken out of its downtrend, hitting all prior upside targets and now pulling back toward a key support area and the 200-day EMA, potentially forming a higher low—an ideal spot for re-entry.
🔹 Entry Zone:
Around $2.80
🎯 Take Profit Targets:
🥇 $3.40 – $3.60
🥈 $4.00 – $4.20
🥉 $5.00 – $5.20
🛑 Stop Loss:
Daily close below $2.20
📌 Strategy Notes:
Look for bullish confirmation (e.g., wick rejections, bullish engulfing candle) near $2.80
Structure remains intact as long as price holds above $2.20
EMA retests often precede strong continuation if trend strength remains
TradeCityPro | SUI: Bullish Push Faces Key Resistance Test👋 Welcome to TradeCity Pro!
In this analysis, I want to review the SUI coin for you. It's one of the DeFi layer-1 projects that was highly hyped in 2024 and has recently gained renewed attention due to some news from the project.
🔍 This project's coin, with the symbol SUI, has reached a market cap of $11.3 billion, ranking it 11th on CoinMarketCap.
📅 Daily Timeframe
As you can see in the daily timeframe, since the last analysis I shared in this channel, the price has rebounded from the support zone I highlighted and, after breaking the trendline, made a bullish leg up to 3.6402.
📊 A significant amount of buying volume has entered the market, and the RSI has entered Overbuy territory. These two factors drove the bullish move, and the 3.6402 resistance is a key level that has temporarily held off further price increases.
✔️ Currently, we’re seeing a few corrective candles that caused the price to reject from this resistance, but it's holding up well and still looks poised to move back toward this level.
🛒 For spot buying, if the price moves back toward this area, you can enter a position on a break of 3.6402. The next trigger is the break of 4.0866, and the main resistance ahead is 5.2689.
🔽 If a correction occurs, support levels are 2.7830 and 2.2495. If price retraces, these can serve either as short targets or long entry zones depending on the price reaction.
📉 Confirmation of trend reversal would come if the price fails to make a higher high above 3.6402 and breaks the current low. After that, we can consider opening a short position.
📝 Final Thoughts
This analysis reflects our opinions and is not financial advice.
Share your thoughts in the comments, and don’t forget to share this analysis with your friends! ❤️

SUI Drip Drip Driping DownSUI is looking more like it's 4th wave is going to go down a bit more before it can bounce up to $4.00. I really was hopeful that May 5th's $3.26 was it's recent retracement bottom... but it looks like we are about to revisit $3.26 and go even lower.
My target range is between $2.80 and $3.08, with my best guess as $2.88 as it will touch a previous high and will settle near the fib golden zone.
At the time I am posting this, the price is hovering around $3.24 and BTC is nearing 94k.
I think the market overall is going to be very nervious on 6 May, the day before the Fed's 7th May meeting.

DEXEUSDT UPDATE
Pattern: Bullish Pennant Pattern
Current Price: $14.835
Target Price: $26.61
Target % Gain: 80.18%
Technical Analysis: DEXE has broken out of a descending triangle pattern on the 1D chart. The breakout is supported by a strong bullish candle and sustained price action above the trendline resistance, indicating momentum toward the target.
Time Frame: 1D
Risk Management Tip: Always use proper risk management.

SUI - A closer lookIn my previous SUI analysis, I currently have us in an impulse structure leading into the 5th wave.
Zoomed out, it seems we're still in a corrective structure. Looking to short at the TP of the long.

$AVAX/USDT Trade Setup - Daily TF$AVAX/USDT Trade Setup – Daily TF
#AVAXUSDT has broken a multi-month downtrend and is retesting a key demand zone, offering a clean long opportunity.
Entry: $19.70–$20.00
Stop Loss: $15.00
Targets: $27 / $35 / $55
Invalidation: Close below $15... DYRO, NFA
Watch for a bullish confirmation before entry.
Swing setup with strong potential if the demand holds.

SUI Looks Bearish (2H)From the point where we placed the red arrow on the chart, it appears that the correction in SUI has begun.
An expansionary wave structure is visible, which could potentially push SUI toward the green zone.
Targets are marked on the chart. As long as the supply zone holds, the price may move toward the targets and the green box.
A 4-hour candle closing above the invalidation level will invalidate this analysis.
For risk management, please don't forget stop loss and capital management
When we reach the first target, save some profit and then change the stop to entry
Comment if you have any questions
Thank You

SCRTUSDT UPDATE
SCRT Technical Setup
Pattern: Falling Wedge Breakout
Current Price: $0.2453
Target Price: $0.59
Target % Gain: 160.55%
Technical Analysis: SCRT has broken out of a falling wedge on the 1D chart, indicating a bullish reversal. The breakout is confirmed with strong green candles and volume build-up.
Time Frame: 1D
Risk Management Tip: Always use proper risk management.

KAVAUSDT UPDATEPattern: Falling Wedge Breakout
Current Price: $0.4567
Target Price: $0.74
Target % Gain: 60.53%
Technical Analysis: KAVA has broken out of a long-term falling wedge on the 1D chart, with strong bullish momentum and price closing above the trendline resistance. This breakout signals potential continuation toward the projected target.
Time Frame: 1D

SUIUSDT Potential DownsidesHey Traders, in today's trading session we are monitoring SUI/USDT for a selling opportunity around 3.40 zone, SUI/USDT is trading in a downtrend and currently is in a correction phase in which it is approaching the trend at 3.40 support and resistance area.
Trade safe, Joe.

LISTAUSDT UPDATELISTAUSDT Technical Setup
Pattern: Falling Wedge Breakout
Current Price: $0.1893
Target Price: $0.30
Target % Gain: 60.04%
Technical Analysis: LISTA has broken out of a falling wedge pattern on the 12H chart with increasing momentum. Price is holding above the breakout trendline, suggesting bullish continuation. A confirmed breakout with volume could push price to the projected target.
Time Frame: 12H
Risk Management Tip: Always use proper risk management.

SUI/USDT Long Entry at 3.507 (10x Leverage) | Strategy in PlayEntered a long position on CRYPTOCAP:SUI at 3.507 with 10x leverage. Current price action is hovering near entry. Watching key levels:
🔹 Target Zone: 3.8760+
🔻 Support Zone: ~3.25 (highlighted for potential SL zone)
🧠 TP (Take Profit) and SL (Stop Loss) will be updated as the move develops.
Keep an eye on price reaction around the support-resistance flip zone.

SUI A&E or pullback firstAs BTC is keeping the line it looks lik it will pump towards 100K. In that level we can see a pull back to cool off the RSI.
SUI is looking strong and made u huge revovery from the $1,70 level from the 7th of april. In teh 4 h Charts we cab see an Bull Flag pattern, wit a deviation of the high in this pattern.
We need to see the recovery of the $3,86 level that must get support in orde to stay bullisch on the short term. Isn't this leven in soon then we can expect more retracement in the price alle the way towards the MA100 around $2,95 or even the MA200 at a level of $2,55.

$DOGS/USDT Breakout alert📈 $DOGS/USDT Breakout Alert
DOGS just broke out of its long-term descending wedge — a bullish signal!
- Trendline cracked
- Support held
- Reversal brewing?
One to watch. DYOR!

SUI sell pressure incoming can it hold the line?SUI unlocks could cause dilution-sell pressure; however, if the SUI bulls are strong enough, they may absorb the unlock. Momentum is overbought and could come down, which is a good recipe to buy the dip.
Full TA: Link in the BIO

MAGICUSDT UPDATE
MAGIC Technical Setup
Pattern: Symmetrical Triangle Breakout
Current Price: $0.2253
Target Price: $0.290,
Target % Gain: 30.06%
Technical Analysis: MAGIC has broken out of a symmetrical triangle on the 4H chart with a strong green candle and volume spike, signaling bullish momentum and a potential 30% upside move.
Time Frame: 4H
Risk Management Tip: Always use proper risk management.

SUI/USDT 1H: Markup Phase – Long Setup Above $3.60SUI/USDT 1H: Markup Phase – Long Setup Above $3.60
🚀 Follow me on TradingView if you respect our charts! 📈 Daily updates!
Current Market Conditions (Confidence Level: 8/10):
Price at $3.60, showing strong bullish momentum following recent accumulation phase.
Hidden bullish divergence on RSI confirms internal strength and supports upward continuation.
Smart Money accumulation completed, premium zone established at $3.80.
Trade Setup (Long Bias):
Entry: $3.60 – $3.62 zone.
Targets:
T1: $3.80
T2: $3.90
T3: $4.00
Stop Loss: $3.40 (below Fair Value Gap support).
Risk Score:
8/10 – Clear breakout structure supports bullish thesis, minor risk due to proximity to premium resistance zones.
Key Observations:
Strong support confirmed at $3.40 FVG level.
Volume profile indicates heavy accumulation below $3.60, now transitioning to expansion.
Distribution phase expected above $3.90 if targets are reached.
Market Makers likely preparing to offload positions near $4.00 zone.
Recommendation:
Long positions favored within $3.60 – $3.62 entry range with tight stop loss at $3.40.
Scale partial profits at $3.80 and $3.90 to secure gains, leaving runners towards $4.00.
Monitor price action closely near $3.80 for possible early rejection or continuation signals.
🚀 Follow me on TradingView if you respect our charts! 📈 Daily updates!
