$PEPESUI Surged 580% to Reclaim the $1Mln Mkt Cap ThresholdThe $PEPESUI coin has surged 580% for the past 8 days to reclaim the $1 Million market cap threshold, enroute to $3 million market cap with an 80% surge as confirmation.
The 4-hour price chart depicts the formation of a cup and handle pattern, a pattern generally seen as a bullish pattern and for a project sitting at just $1.22 Million in market cap this SUI project might just be the catalyst for the 2025 bull run.
With anticipated CEX listings and the unveiling of their NFT's with a minimum supply of 420, $PEPESUI is poised to reclaim the $3 Million market cap and beyond with the growing hype and adoption of the CRYPTOCAP:SUI ecosystem, The blue frog might just outpaced the original CRYPTOCAP:PEPE token but only time shall tell.
As of the time of writing, CRYPTOCAP:PEPE Sui is up 22% trading within a bullish pattern forming the wedge of the cup formed. We might experience a respite before a major leap ahead.
About Pepe on Sui
Pepe on Sui is a meme coin project that leverages the Sui blockchain to create a unique and engaging digital asset. Launched in October 2024, the project combines the viral appeal of the Pepe the Frog meme with the technological advantages of the Sui blockchain. It aims to offer a fun and community-driven experience for its users while providing practical utility within the blockchain ecosystem.
Pepe on Sui Price Data
The Pepe on Sui price today is $0.000000002985 with a 24-hour trading volume of $56,415.76 USD. Pepe on Sui is up 16.61% in the last 24 hours. The current CoinMarketCap ranking is #4189, with a market cap of $0.000000002985. The circulating supply is 420,690,000,000,000 PEPE. supply of 420,690,000,000,000 PEPE coins.
Suiusdt

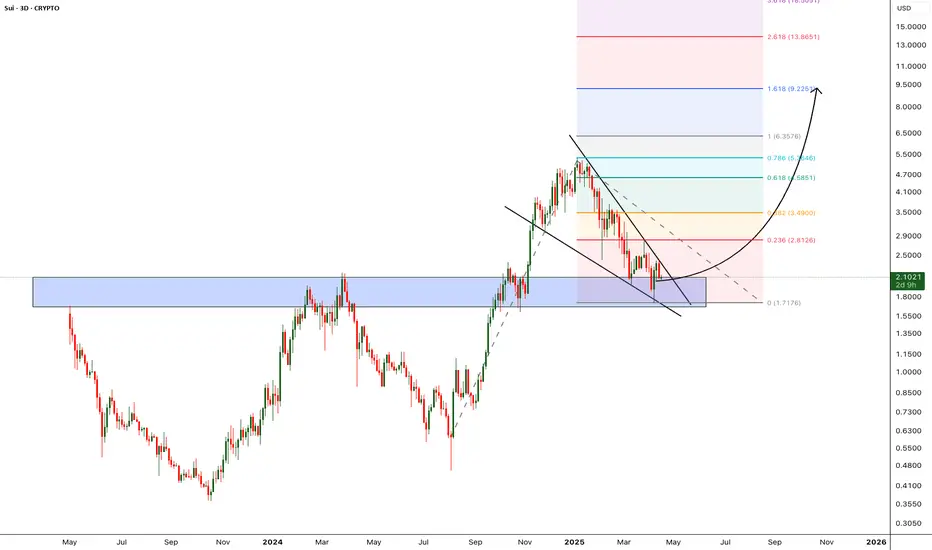
Fibonacci Setup: SUI Targeting 4.40 With 26% Upside RoomHello and greetings to all the crypto enthusiasts, ✌
All previous targets were nailed ✅! Now, let’s dive into a full analysis of the upcoming price potential for SUI 🔍📈.
SUI has demonstrated remarkable growth in recent days and is now nearing a key resistance level. Based on Fibonacci analysis, I anticipate an additional 26% upside potential. My primary price target is set at 4.40, with key support levels clearly identified.📚🙌
🧨 Our team's main opinion is: 🧨
SUI has surged recently, is close to major resistance, and with support mapped by Fibonacci, I’m aiming for a main target of 4.40 — expecting about 26% more upside.📚🎇
Give me some energy !!
✨We invest hours crafting valuable ideas, and your support means everything—feel free to ask questions in the comments! 😊💬
Cheers, Mad Whale. 🐋

Inverted Head and Shoulders Pattern🚨 SUI Forming Bullish Inverted Head and Shoulders Pattern 🚨
SUI appears to be forming a bullish inverted head and shoulders pattern. For confirmation of this bullish pattern, the price needs to break out above the neckline, which is marked in red.
📈 Technical Overview:
Pattern: Bullish Inverted Head and Shoulders
Neckline: Red resistance level
Confirmation: A breakout above the red neckline will confirm the bullish pattern.
🎯 Potential Move: Bullish continuation upon confirmation of the breakout.

SUI/USDT.P Short Setup — Ride the Wave to Profits!Trade Details:
Entry: 3.56 - 3.6 USDT
Stop-Loss: 3.6935 USDT
Take-Profit Levels:
TP1: 3.4215 USDT
TP2: 3.2700 USDT
TP3: 3.0640 USDT
With clear targets set and a tight risk management strategy, this setup offers a great opportunity to ride the wave of the market’s next move.
Patience and discipline are key. Stay focused, follow your plan, and let's make this trade count!

Sui Coin is Falling My custom indicator named SignalsWalaJin generated signal that sui coin will fall. It told "Becho means sell. You can see its falling.
Note this is not a buy sell trade call use stop loss.

#SUIUSDT: Will Bulls Continue The Move Upwards of $8?The price of BINANCE:SUIUSDT has been bullish since completing its accumulation phase and is currently in the distribution phase. It has shown a strong change of character, with a steady move. However, a short-term correction is expected to fill the gap that the price has left behind.
In a bullish scenario, prices often continue their upward trend without making corrections, and this could be the case with this crypto pair as well. At the moment, we recommend monitoring the price momentum and entering trades according to your trading plan.
We have set three targets based on your bias, but please note that these are not a confirmation of buy or sell. They are simply our overview of the trade and are limited to the knowledge and experience of our traders.
Wishing you good luck and safe trading!
Thank you for your unwavering support! 😊
If you’d like to contribute, here are a few ways you can help us:
- Like our ideas
- Comment on our ideas
- Share our ideas
Team Setupsfx_
❤️🚀

SUIUSDT - Don't wait for pullback!SUI is the star of this season — on the 3-day chart, it just broke out of a falling wedge pattern with a massive green candle.
The price also reacted strongly to the 0.618 Fibonacci level, indicating there’s still plenty of upside potential ahead.
Don’t wait for pullbacks — coins like this rarely give clear entry opportunities, and any correction is usually very shallow.
It’s either you buy now, or regret it later.
Best regards Ceciliones 🎯

$SPELL/USDT Breakout Alert!🚀 $SPELL/USDT Breakout Alert!
SPELL has broken out of a symmetrical triangle on the 4h chart, confirming a strong bullish move!
• Entry: CMP
• TP: 0.0008612
• SL: 0.0005143 for risk management.
Momentum looks after consolidation — eyes on continuation if volume stays strong!
DYOR, NFA

SUI/USDT Update - Approaching Channel Resistance! Let’s dive into the 1H chart for SUI/USDT.
Sui is riding a solid rising channel, showing strong bullish momentum!
Price has climbed from $2.25 since 22 April and is now at $3.59, with potential extention to the channel’s resistance at $4.00.
Key support holds at $3.00, with an intermediate level at $3.50.
If we break above $4.00, we could see a big move higher. But if rejected, expect a pullback toward $3.50 or $3.00.
Keep an eye on volume and price action at this resistance!

Trump's World Liberty Financial to add SUI to strategic reserve!CRYPTOCAP:SUI , a leading Layer-1 blockchain, has entered into a significant partnership with World Liberty Financial (WLFI), a decentralized finance (DeFi) platform affiliated with Donald Trump.
This collaboration involves integrating Sui's native token (SUI) into WLFI's "Macro Strategy" reserve, a strategic token fund designed to diversify holdings and support emerging blockchain projects.
The partnership also aims to explore product development opportunities leveraging Sui's technology.
WLFI's Macro Strategy reserve already includes prominent digital assets such as Bitcoin, Ethereum, and tokenized real-world assets like U.S. Treasury-backed tokens.
The addition of SUI reflects WLFI's focus on supporting innovative blockchain projects while expanding decentralized finance access to a broader audience.
The announcement of this partnership coincides with broader developments in the U.S. crypto landscape.
President Trump is expected to unveil details about a proposed "Crypto Strategic Reserve" during the White House Crypto Summit on March 7, 2025.
This reserve is anticipated to focus primarily on Bitcoin while also considering other digital assets
Trump-backed World Liberty Financial plans to add SUI to its strategic reserve.
I think the upside for SUI is Huge from here!
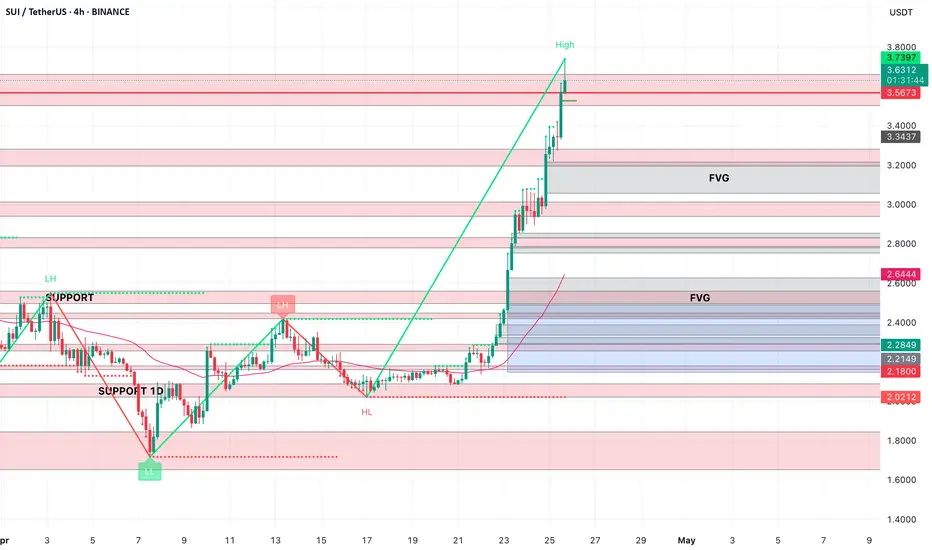
SUI AnalysisSUI/USDT - 4-Hour Chart Analysis: Potential Bullish Continuation
This analysis focuses on the 4-hour chart of SUI/USDT on Binance. Key observations include:
Current Price: SUI is trading at $3.6423, up 1.95% from the previous close.
Recent High: The recent high is $3.7397.
Support Levels: Key support levels are identified at $2.12 and $1.80. There's also a support zone labeled "SUPPORT 1D."
Fair Value Gap (FVG): There are two Fair Value Gaps (FVG) marked on the chart, one above the current price and one below, which could act as potential areas of interest.
Potential Bullish Trend: The chart suggests a potential continuation of the bullish trend, with the price moving upwards from the support levels.
Disclaimer: This is not financial advice. Please do your own research before making any trading decisions.
SUI whats the target ?SUI / USDT
SUI is just following my scenario 2 in previous analysis.. click here
What next ? :
With current big price surge we are looking for previous ATH , after that the main resistances are: 7$ and 9$/10$
They are considered very strong resistance but if the price could overcome them we will see SUI flying like never before
Always do risk management
Make your plan and dont FOMO
Best of wishes

sui on long term bullish patternaccording to sui chart it shows bullish now and it will face to golden ratio resistance.

SUI has traded back up the the equilibrium zone.As many of us already know, SUI has the ability to make some really big moves very quickly, and it's currently trading at the bottom of the equilibrium zone.
This will be very interesting to watch.
Good luck, and always use a stop-loss!

$SUI to $4Hey traders,
Here's a quick video breakdown of our short-term trade setup for CRYPTOCAP:SUI — give it a look. Thanks!

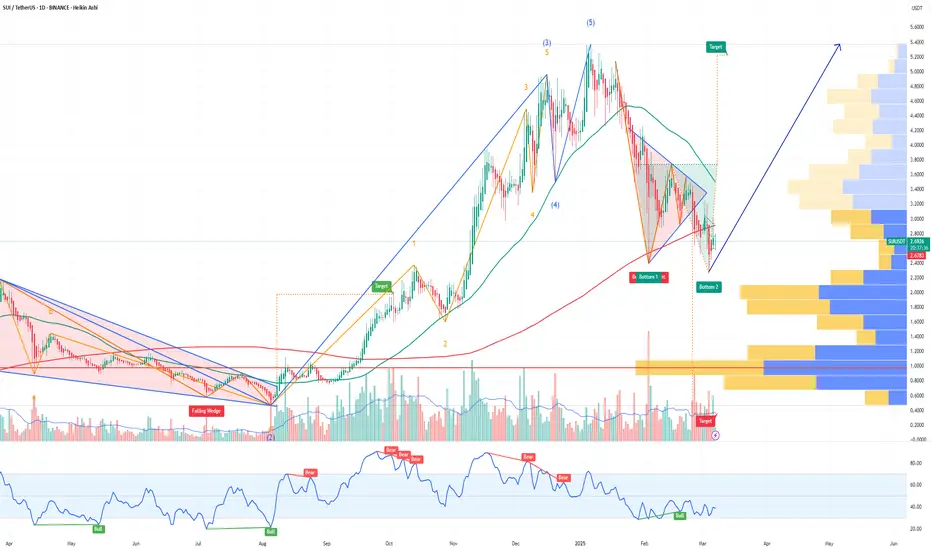
SUI Is Entering Into Final Stage Of Bull MarketHello, Skyrexians!
On yesterday's crypto pump BINANCE:SUIUSDT was the greatest performer and people started to have an interest in this coin will continue growing or this is just a bull trap. Let's try to understand it.
On the 1W time frame we have unclear, but Elliott wave structure. It looks like wave 4 overlapped with the wave 1. You will tell me that it's impossible. In practice it can happen especially on altcoins. According to the Awesome Oscillator wave 4 is finished which can be also confirmed by our Bullish/Bearish Reversal Bar Indicator . The final wave 5 will reach the green box, to have the more accurate target we need to count waves inside wave 5.
Best regards,
Skyrexio Team
___________________________________________________________
Please, boost this article and subscribe our page if you like analysis!

$SUI has nearly completed its correction — get ready!🚀 CRYPTOCAP:SUI has nearly completed its correction — get ready for a potential breakout in 4 weeks!
After an explosive push upward, a massive bearish divergence has formed — but the next leg could be just around the corner.
📊 Key signals:
MACD (1W) is about to flip bullish — a crossover expected in ~4 weeks.
RSI is near its previous bottom, signaling potential for a rebound.
Volume is matching levels seen during the last major rally.
📅 All signs point to May 19, 2025.
This could be the turning point.
CRYPTOCAP:SUI is in my buy zone at the moment (the green rectangle).
I project a new all time high.
📌 Stay sharp. Be prepared.
🧠 DYOR (Do Your Own Research)
#SUI #Altcoins #CryptoSignals #MACD #RSI #CryptoUpdate #May2025 #SUIUSDT #BullishSetup #DYOR

Crypto Bulls Awaken – Is This Just the Beginning?In the past 48 hours, the crypto market has brought joy to traders and investors who managed to buy near the bottom.
(Sorry to the cryptobros still holding floating losses—your time will come too! 😊)
Some of you might be thinking it's too late to ride this bull run. But if you zoom out and look at the bigger picture, there's still plenty of room for the bull to run.
Just switch to a higher timeframe like the weekly or monthly chart, and you'll see the potential upside.
One coin that looks particularly interesting is BINANCE:SUIUSDT .
There's been a pullback from 2.1829 - 1.7997, and it's supported by bullish divergence, suggesting a continuation of the impulsive move with 7.6108 as the first major target.
This bullish scenario remains valid as long as the price holds above 1.7174.
You might be wondering,
" So can I just buy/long BINANCE:SUIUSDT now? "
Not yet.
For a better entry and a more favorable risk-reward ratio, I suggest using the daily chart.
Wait for a pullback, then look for confirmation using candlestick patterns.
(I'll cover those patterns in my next post—stay tuned!)

SUI/USDT:BUYHello friends
Due to the price correction, we can buy in two designated areas in a stepwise manner. Elite with capital and risk management.
*Trade safely with us*

#SUI Long Trade Setup #SUI Trade setup
waiting for breakout of 0.8430 level and make it support then we can do scalp long with easy invalidation below the support

#SUI/USDT#SUI
The price is moving within a descending channel on the 1-hour frame, adhering well to it, and is heading for a strong breakout and retest.
We are seeing a bounce from the lower boundary of the descending channel, which is support at 2.14.
We have a downtrend on the RSI indicator that is about to break and retest, supporting the upward trend.
We are looking for stability above the 100 moving average.
Entry price: 2.20
First target: 2.31
Second target: 2.39
Third target: 2.46

SUI - Double Digit is next - Alt season LeaderCorrection of the SUI is over, currently trading around the previous Support zone. i'm expecting this support to hold and bounce back from the support zone.
Once the price breaks from the falling wedge pattern we can expect the bullish momentum to start and hit new all time high.
Entry: after wedge breakout
Target 1: 2.8
Target 2: 3.49
Target 3: 4.5
Target 4: 5.3
Target 5: 6.3
Target 6: 9.2
SL below 1.68
Cheers
GreenCrypto
Sui Buy IdeaHow do you know a good breakout?
According to Edward and Maggie in their classic charting book, a breakout should around 3% of the candle closing outside the pattern.
And if you can see Sui has broken out of it's 4 months trendline.
I see more bullish moves ahead.
