SUI Trade Setup – Early Reversal PlaySUI has just swept underside liquidity around $1.80, reclaiming key support and showing signs of a potential trend reversal. If it holds this higher low and breaks above $2.40, that would likely confirm a bullish structure shift and open the door for a strong move up.
📍 Entry Zone:
Around $2.25
🎯 Take Profit Targets:
🥇 $2.73
🥈 $3.40
🥉 $4.00
🛑 Stop Loss:
Daily close below $2.00
Suiusdt

$SUI - Scalp Long TradeSUI | 4h
Price is holding $2.30 — I'm starting to scale into longs at current levels.
Looking to add more if it dips into the $2.30–$2.27 range.
Stoploss is set just below $2.20 (vwap).
Targets:
$2.40
$2.50
$2.60

ACEUSDT UPDATEACE/USDT Technical Setup
Pattern: Falling Wedge Breakout
Current Price: $0.635
Target Price: $1.714
Target % Gain: 250.34%
Technical Analysis: ACE has broken out of a long-term falling wedge pattern on the 1D chart with strong bullish momentum. Volume has increased significantly, confirming the breakout with potential for a 250% upside move.
Time Frame: 1D
Risk Management Tip: Always use proper risk management.

Can't BEAR it — SUI breakdownSUI has broken the channel it was in, and looks to be in a bearish trend until it scoops up more liquidity around the $4.00 mark — with possiblilies of hitting even lower depending on market sentiment at the time of the next dip.
NFA.
Please hit the rocket if you like this post.

SUIUSDT | Buyers Are Active but Patience Pays MoreWe're seeing some interest from buyers on SUIUSDT at the current levels, but personally, I wouldn’t rush into a serious position just yet. This kind of price action, especially in this part of the chart, can often be deceptive and cause unnecessary emotional trading.
📌 Wait for the Blue Box
The blue box below represents a much stronger area of interest, where I believe more reliable demand could show up. Entering at these levels without proper confirmation or structure could expose you to unnecessary risk.
🎯 Let the Market Come to You
Instead of trying to guess every move, the better strategy is to let the market present the trade to you at a level that has historically shown strength. That’s where you get the best entries, with minimized risk and higher reward.
💬 Follow the Smart Side of Trading
Every level I share is built on deep observation, backed by consistency and clarity. If you're following me, you're not just copying boxes, you're following a structured mindset and a refined strategy that keeps delivering results when others are guessing. Stay sharp and keep your edge.
📌I keep my charts clean and simple because I believe clarity leads to better decisions.
📌My approach is built on years of experience and a solid track record. I don’t claim to know it all but I’m confident in my ability to spot high-probability setups.
📌If you would like to learn how to use the heatmap, cumulative volume delta and volume footprint techniques that I use below to determine very accurate demand regions, you can send me a private message. I help anyone who wants it completely free of charge.
🔑I have a long list of my proven technique below:
🎯 ZENUSDT.P: Patience & Profitability | %230 Reaction from the Sniper Entry
🐶 DOGEUSDT.P: Next Move
🎨 RENDERUSDT.P: Opportunity of the Month
💎 ETHUSDT.P: Where to Retrace
🟢 BNBUSDT.P: Potential Surge
📊 BTC Dominance: Reaction Zone
🌊 WAVESUSDT.P: Demand Zone Potential
🟣 UNIUSDT.P: Long-Term Trade
🔵 XRPUSDT.P: Entry Zones
🔗 LINKUSDT.P: Follow The River
📈 BTCUSDT.P: Two Key Demand Zones
🟩 POLUSDT: Bullish Momentum
🌟 PENDLEUSDT.P: Where Opportunity Meets Precision
🔥 BTCUSDT.P: Liquidation of Highly Leveraged Longs
🌊 SOLUSDT.P: SOL's Dip - Your Opportunity
🐸 1000PEPEUSDT.P: Prime Bounce Zone Unlocked
🚀 ETHUSDT.P: Set to Explode - Don't Miss This Game Changer
🤖 IQUSDT: Smart Plan
⚡️ PONDUSDT: A Trade Not Taken Is Better Than a Losing One
💼 STMXUSDT: 2 Buying Areas
🐢 TURBOUSDT: Buy Zones and Buyer Presence
🌍 ICPUSDT.P: Massive Upside Potential | Check the Trade Update For Seeing Results
🟠 IDEXUSDT: Spot Buy Area | %26 Profit if You Trade with MSB
📌 USUALUSDT: Buyers Are Active + %70 Profit in Total
🌟 FORTHUSDT: Sniper Entry +%26 Reaction
🐳 QKCUSDT: Sniper Entry +%57 Reaction
📊 BTC.D: Retest of Key Area Highly Likely
📊 XNOUSDT %80 Reaction with a Simple Blue Box!
📊 BELUSDT Amazing %120 Reaction!
I stopped adding to the list because it's kinda tiring to add 5-10 charts in every move but you can check my profile and see that it goes on..

Phemex Analysis #74: Pro Tips to Trade SUISUI ( PHEMEX:SUIUSDT.P ) is experiencing a challenging start to 2025, with its price declining 68% from its all-time high of $5.37 on January 6th. However, a potential bullish reversal signal is emerging, as the recent drop to $1.71 coincides with a Relative Strength Index (RSI) divergence, where the price makes lower lows while the RSI makes higher lows. This divergence suggests that the downward momentum may be weakening, and a trend reversal could be imminent. Let's explore the possible scenarios for SUI to guide our trades.
Possible Scenarios
Based on the current technical setup, here are several potential scenarios for SUI's price action:
1. Bullish Reversal and Breakout
The RSI divergence suggests a potential bullish reversal. If SUI breaks above key resistance levels with strong volume, it could confirm this reversal and lead to a significant upward move.
Pro Tips:
Monitor key resistance levels, such as $2.42 and $2.83.
A break above the $2.42 resistance level (or $2.83 for further confirmation), accompanied by increasing volume, would be a key signal.
Consider entering a long position on the breakout, with a stop-loss order placed below the breakout point or a recent swing low.
Potential profit targets for short-term profits are $3.56 and $4.25.
2. Consolidation and Range Trading
SUI's price may consolidate within a range as the market digests the recent decline and the potential for a reversal. This consolidation period could offer range-bound trading opportunities.
Pro Tips:
Identify support and resistance levels that define this range, such as the $1.71 support and $2.83 resistance.
Within this range, consider buying near the $1.71 support and selling near the $2.83 resistance.
It's important to set stop-loss orders outside the range to manage the risk of a potential breakout or breakdown.
3. Failed Reversal and Further Decline
While the RSI divergence is a bullish signal, there's a risk that the reversal fails, and the price continues to decline. This could happen if broader market sentiment turns bearish or if new negative information about SUI emerges.
Pro Tips:
Monitor key support levels, such as $2.0 and $1.71. A break below these levels with high volume could signal further decline.
If the price fails to break above $2.83 and starts to decline with strong volume, consider exiting long positions.
In a bearish scenario, shorting opportunities may arise on a break below significant support, but this should be done with caution and a tight stop-loss.
Conclusion
SUI presents a complex trading situation. The RSI divergence offers a potential bullish reversal, but the preceding sharp decline and overall market conditions create uncertainty. Traders should carefully monitor price action, volume, and key support and resistance levels. By considering the scenarios outlined above and employing sound risk management practices, traders can position themselves to potentially profit from SUI's price movements, whether it reverses upward, consolidates, or declines further.
Pro Tips:
Elevate Your Trading Game with Phemex. Experience unparalleled flexibility with features like multiple watchlists, basket orders, and real-time adjustments to strategy orders. Our USDT-based scaled orders give you precise control over your risk, while iceberg orders provide stealthy execution.
Disclaimer: This is NOT financial or investment advice. Please conduct your own research (DYOR). Phemex is not responsible, directly or indirectly, for any damage or loss incurred or claimed to be caused by or in association with the use of or reliance on any content, goods, or services mentioned in this article.

SUIUSDT 1DSUI ~ 1D Analysis
#SUI If you lose the opportunity for Coin CRYPTOCAP:AVAX 2021, don't lose Coin #Sui 2025. This coin will follow #Avax success in 2021

DEGOUSDT UPDATEDEGO/USDT Technical Setup
Pattern: Falling Wedge Breakout
Current Price: $1.808
Target Price: $3.70
Target % Gain: 115.05%
Technical Analysis: DEGO broke out of a falling wedge on the 1D chart, showing bullish momentum with a clean candle close above resistance and follow-through volume. Chart suggests potential continuation toward the measured target.
Time Frame: 1D
Risk Management Tip: Always use proper risk management.

MDTUSDT UPDATEMDT/USDT Technical Setup
Pattern: Falling Wedge Breakout
Current Price: $0.02544
Target Price: $0.0586
Target % Gain: 150.48%
Technical Analysis: MDT has broken out of a falling wedge on the 1D chart with a strong bullish candle and an 11.82% daily gain, confirming momentum. Breakout volume and candle close above resistance support further upside.
Time Frame: 1D
Risk Management Tip: Always use proper risk management.

Trading opportunity for SUIUSDTBased on technical factors there is a Sell position in :
📊 SUIUSDT
🔴 Sell Now
🪫Stop loss 2.8700
🔋Target 1.1100
📏 R/R 2
💸RISK : 1%
We hope it is profitable for you ❤️
Please support our activity with your likes👍 and comments📝

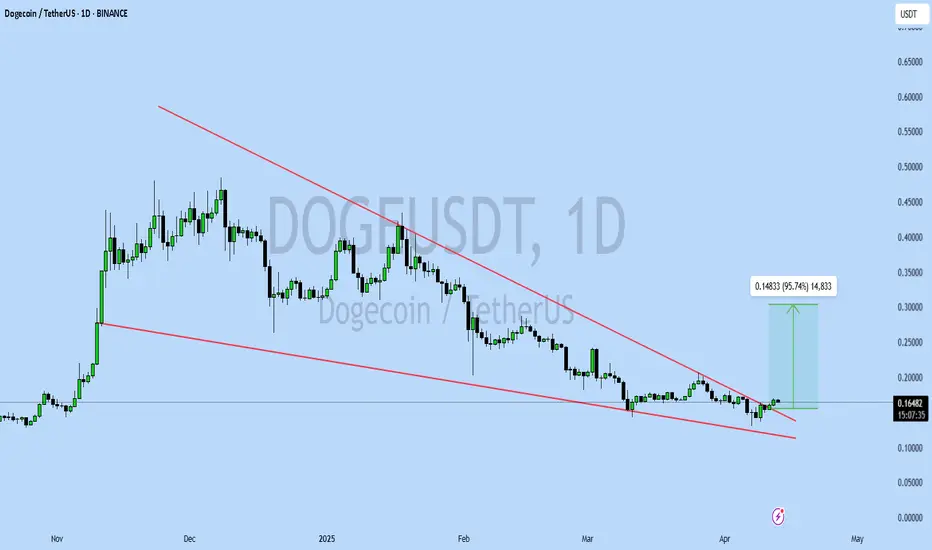
DOGEUSDT UPDATEDOGEUSDT is a cryptocurrency trading at $0.16485, with a target price of $0.30000. This represents a potential gain of over 90%. The technical pattern observed is a Bullish Falling Wedge, indicating a possible trend reversal. This pattern suggests that the downward trend may be coming to an end. A breakout from the wedge could lead to a significant upward movement in price. The Bullish Falling Wedge is a positive indicator, signaling a potential price surge. Investors are showing optimism about DOGEUSDT's future performance. The current price may present a buying opportunity. Reaching the target price would result in substantial returns for investors. DOGEUSDT is positioned for a potential breakout and significant gains.
SEIUSDT UPDATESEIUSDT is a cryptocurrency trading at $0.1700, with a target price of $0.4500. This represents a potential gain of over 200%. The technical pattern observed is a Bullish Falling Wedge, indicating a possible trend reversal. This pattern suggests that the downward trend may be coming to an end. A breakout from the wedge could lead to a significant upward movement in price. The Bullish Falling Wedge is a positive indicator, signaling a potential price surge. Investors are showing optimism about SEIUSDT's future performance. The current price may present a buying opportunity. Reaching the target price would result in substantial returns for investors. SEIUSDT is positioned for a potential breakout and significant gains.

SUI Long Spot Trade Setup – Oversold Bounce PotentialSUI has dropped into a key support zone ($1.60 – $1.96) after an extended selloff. The price is showing oversold conditions, making this a potentially high-reward setup if a bounce confirms from this zone.
📌 Trade Setup:
Entry Zone: $1.60 – $1.96
Take Profit Targets:
🥇 $2.50 – $2.90
🥈 $3.25 – $3.60
Stop Loss: Just below $1.50

TradeCityPro | SUI: Analyzing the Shift from Hype to Stability👋 Welcome to TradeCity Pro!
In this analysis, I will review the SUI coin. This project gained significant hype in 2024 and experienced a substantial upward movement.
🔍 However, in the past few months, after reaching a price ceiling of 5.2689, it entered a corrective phase, and it can be said that its hype has completely dissipated and no longer carries much excitement.
📅 Daily Time Frame
As you can observe in the daily time frame, the price had a strong upward trend and, after breaking and pulling back to the 1.8392 area, it undertook the next upward leg up to 5.2689. During this movement, a severe divergence occurred in the RSI, which influenced the market when it was activated by breaking 50.
✔️ The upward movement accompanied by a trendline, was broken after being rejected from the 5.2689 area. The trigger for this trendline was the 4.0866 area, which was activated and confirmed the trend change after a pullback to this trigger and the break of the 3.6402 support.
🔽 Currently, after the break of 3.6402, a bearish trendline has formed, and the price has reacted to this area several times. Meanwhile, the price has also reacted to a significant support area around 1.8392. This area, actually a range between 1.6462 and 1.8392, is one of SUI's most crucial supports and could prevent further price drops.
✨ For the coin to become bullish again, the main trigger we have is breaking the bearish trendline, and I believe for buying in the spot market, the primary trigger will be breaking this trendline. There is also a significant resistance at 2.7830, which is the main trigger for breaking the trendline.
📈 If the price makes a lower high and low and breaks the support area it currently holds, the trendline trigger will shift to 2.2495, allowing us to enter earlier. A break of 50 in the RSI will also be a suitable trigger for entering a bullish momentum.
🛒 Alternatively, if you trade reactively, the price's reaction to this support area and breaking short-term resistances in lower time frames could be suitable for risky spot buying.
📊 Currently, the market volume has been more favorable to sellers, with volume increasing during price drops and decreasing during corrections, indicating the strength of the bearish trend. However, after the price reached the support area and reacted to it, we've seen two strong bullish candles with significant volume, which could be the first signs of a trend change.
📉 For the price to turn bearish and start the next bearish leg, as mentioned, breaking the support area and the 1.6462 trigger would be suitable, and in this case, the price could start the next bearish leg.
📝 Final Thoughts
This analysis reflects our opinions and is not financial advice.
Share your thoughts in the comments, and don’t forget to share this analysis with your friends! ❤️

TAOUSDT UPDATETAOUSDT is a cryptocurrency trading at $231.9, with a target price of $360.0. This represents a potential gain of over 60%. The technical pattern observed is a Bullish Falling Wedge, indicating a possible trend reversal. This pattern suggests that the downward trend may be coming to an end. A breakout from the wedge could lead to a significant upward movement in price. The Bullish Falling Wedge is a positive indicator, signaling a potential price surge. Investors are showing optimism about TAOUSDT's future performance. The current price may present a buying opportunity. Reaching the target price would result in substantial returns for investors. TAOUSDT is positioned for a potential breakout and significant gains.

Possible SUI BreakoutI believe Bitcoin and altcoins will have a reversal in the upcoming weeks.
I'm eyeing on SUI, the daily shows a potential breakout from it's support levels.
The Stochastics/RSI shows a bullish divergence.

SUI Rebuy Setup (12H)After forming a 3D pattern at the top, wave E of a higher-degree pattern has completed.
A new leg has formed from the point marked by the red arrow on the chart.
It seems that wave E will end in the green zone, followed by a strong upward reversal.
Truthfully, there are other support levels above our marked zone, but we have identified the most important one. If the price reaches this level, we can take a safe buy on SUI.
This project is one of the strongest in crypto, but we always manage risk.
For risk management, please don't forget stop loss and capital management
When we reach the first target, save some profit and then change the stop to entry
Comment if you have any questions
Thank You

#SUI/USDT#SUI
The price is moving within a descending channel on the 1-hour frame, adhering well to it, and is heading for a strong breakout and retest.
We are seeing a bounce from the lower boundary of the descending channel, which is support at 1.86.
We have a downtrend on the RSI indicator that is about to be broken and retested, supporting the upward trend.
We are looking for stability above the 100 Moving Average.
Entry price: 1.90
First target: 1.99
Second target: 2.10
Third target: 2.19

ALTCOINS | ALT Season | Buy Zones PART 2💥 SUI / BINANCE:SUIUSDT
SUI ideal buying points, weighing heavier towards the lower zone:
💥 SHIBA / BINANCE:SHIBUSDT
SHIB ideal buying zone is approaching, but ideally the lower zone is the better buy:
💥 DOT / BINANCE:DOTUSDT
Dot worries me for the reason that it has retraced nearly all the way to 2021 prices. Therefore I'll keep trades small, with modest TP zones.
BUY zone for a swing, not accumulation:
💥 PEPE / BINANCE:PEPEUSDT
PEPE buy zone seems far away, but considering how hard alts can drop in only a few days, I'd be ready with the orders, hanging heavier towards the lower zone:
💥 BINANCE / BINANCE:BNBUSDT
BINANCE shows promising swings. Ideal BUY zones include:
For the next cycle, in other words long term target, I'd watch the 1.618 at least:
This would make it an accumulation buy.
________________

SUI is expected to have a 50% pump ahead (1D)SUI, after completing the 3D pattern at its price peak, has entered a corrective phase.
It is now approaching a high-potential zone, which is the origin of a strong move with significant buy orders. We are looking for buy/long positions in the demand zone.
The target could be the supply zone.
A daily candle closing below the invalidation level will invalidate our bullish outlook.
Do not enter the position without capital management and stop setting
Comment if you have any questions
thank you

SUI Long Spot Trade Setup – Support Zone EntrySUI is retracing into a key support level around $2.00, providing a potential high-reward swing setup if buyers defend this zone.
📌 Trade Details:
Entry: ~$2.00
Take Profit Targets:
🥇 $2.50 – $2.90
🥈 $3.25 – $3.60
Stop Loss: Just below $1.60

Will SUI break $2 support and drop 20% to $1.80?Hello and greetings to all the crypto enthusiasts, ✌
let’s dive into a full analysis of the upcoming price potential for SUI 🔍📈.
SUI is currently trading within a downward channel, signaling a potential continuation of its bearish trend. A decline of at least 20% appears likely, with the primary target set at $1.80, provided that the critical psychological support at $2 is decisively broken. If this key level fails to hold, increased selling pressure could drive the price lower, reinforcing the downtrend.📚🙌
🧨 Our team's main opinion is: 🧨
SUI is stuck in a downtrend, and if it breaks below the key $2 support, we could see at least a 20% drop, with $1.80 as the main target.📚🎇
Give me some energy !!
✨We invest hours crafting valuable ideas, and your support means everything—feel free to ask questions in the comments! 😊💬
Cheers, Mad Whale. 🐋

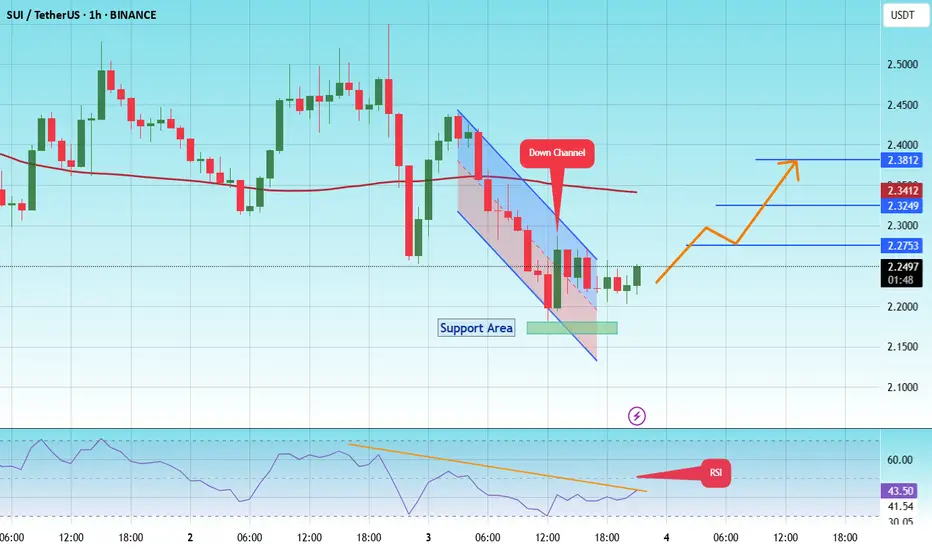
#SUI/USDT#SUI
The price is moving in a descending channel on the 1-hour frame and is expected to continue upward.
We have a trend to stabilize above the 100 moving average once again.
We have a downtrend on the RSI indicator, supporting the upward move with a breakout.
We have a support area at the lower boundary of the channel at 2.17.
Entry price: 2.24
First target: 2.27
Second target: 2.32
Third target: 2.38