SUI Set for a 30% Move? Key Trade Setup InsideSUI/USDT is displaying a strong bullish recovery pattern on the daily chart. The pair has formed a textbook V-shaped reversal, bouncing sharply from the Support Level 2 at $1.7169. The trend has shifted from bearish to bullish, supported by the Auto Trend Line indicator which confirms the uptrend.
🔵 Bullish Structure Highlights
• Price has broken above the intermediate Support Level at $3.1691, converting it into a potential support zone.
• Current price action is hovering around $4.01, with bullish momentum aiming toward the ATH Resistance at $5.38.
• The sharp upward leg is part of a clear V-shaped recovery, suggesting a continuation toward previous highs.
🟢 Trade Setup (Bullish Swing Trade)
Trade Element Level (USD)
Entry Zone $3.73 – $4.01
Stop Loss $3.71
Take Profit $5.38
Risk:Reward ~4.6 R:R (approx.)
📌 Rationale
• The price is approaching a key psychological level and former resistance zone at $5.38, making it a logical profit target.
• A tight stop-loss at $3.71, just below recent consolidation, helps manage downside risk.
• The trend structure supports a bullish continuation pattern, likely driven by breakout traders.
⚠️ Risk Consideration
• If price closes below $3.71, the bullish structure may break down, invalidating the setup.
• Traders should always assess market conditions and manage leverage appropriately.
Suiusdtidea

SUI Scalp Long Setup – Low Leverage | High RR Trade Idea🔹 SUI Scalp Long Setup – Low Leverage | High RR Trade Idea 🚀
🟢 Entry: CMP $4
📉 Leverage: Low (Recommended)
🎯 Targets:
• TP1 – $4.0400
• TP2 – $4.0800
• TP3 – $4.1200
• TP4 – $4.2000
• TP5 – $4.2800
• TP6 – $4.3600
🔻 Stop Loss: 1hr or 2hr candle close below $3.9200
⚠️ Risk & Disclaimer:
This is a short-term scalp trade setup based on current market structure and price action.
• Use strict risk management.
• Trade with capital you can afford to lose.
• Not Financial Advice – Always DYOR (Do Your Own Research).
• Market conditions can change quickly – stay alert.

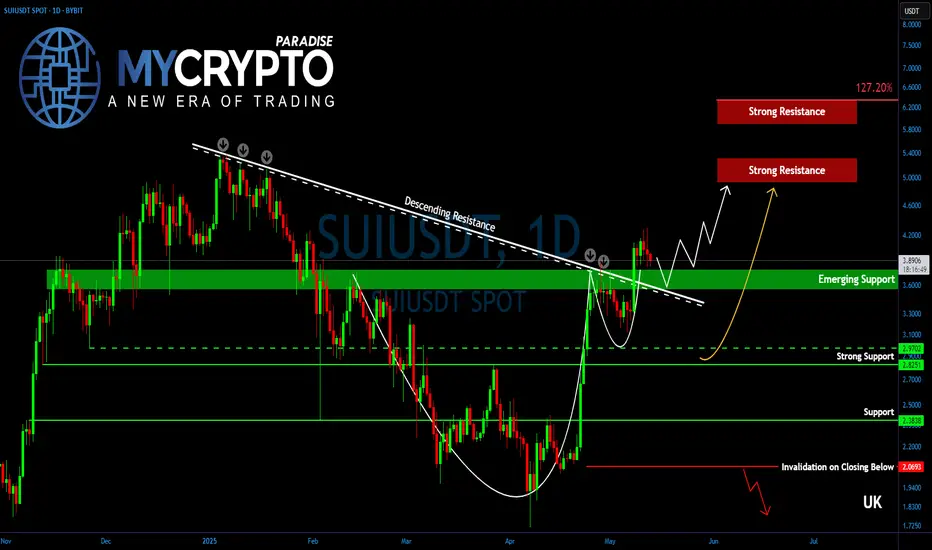
SUI Ready to Explode? Here’s What Happens NextYello, Paradisers! Is #SUI preparing for a fresh 52-week high? With a powerful pattern breakout and a golden cross in play, this could be the beginning of something big.
💎#SUIUSDT remains one of the strongest-performing altcoins in the current market cycle. The chart structure is now showing a cup and handle formation, paired with a clean breakout above a long-term descending trendline resistance—a combination that typically precedes strong bullish momentum.
💎At this stage, SUI is solidifying a newly-formed support zone between $3.80 and $3.60. If this support continues to hold, bulls are likely to drive price higher toward the $4.20 target, followed by a push into the $5.00 to $5.30 zone. This range marks the first major resistance cluster, as well as the previous all-time high region, and may trigger aggressive short-term profit-taking.
💎However, if bullish momentum remains intact, SUI could continue its rally toward the 127.20% Fibonacci extension level at $6.30. This is where caution becomes essential, as it represents a major technical target where price could stall or reverse.
💎Adding fuel to the fire, SUI has also confirmed a Golden Cross formation on the daily timeframe, with the EMA-50 crossing above the EMA-200. This is a powerful trend reversal signal that often acts as a driving force behind prolonged bullish movements.
Paradisers, strive for consistency, not quick profits. Treat the market as a businessman, not as a gambler.
MyCryptoParadise
iFeel the success🌴
SUI/USDT Long Entry at 3.507 (10x Leverage) | Strategy in PlayEntered a long position on CRYPTOCAP:SUI at 3.507 with 10x leverage. Current price action is hovering near entry. Watching key levels:
🔹 Target Zone: 3.8760+
🔻 Support Zone: ~3.25 (highlighted for potential SL zone)
🧠 TP (Take Profit) and SL (Stop Loss) will be updated as the move develops.
Keep an eye on price reaction around the support-resistance flip zone.

#SUIUSDT: Will Bulls Continue The Move Upwards of $8?The price of BINANCE:SUIUSDT has been bullish since completing its accumulation phase and is currently in the distribution phase. It has shown a strong change of character, with a steady move. However, a short-term correction is expected to fill the gap that the price has left behind.
In a bullish scenario, prices often continue their upward trend without making corrections, and this could be the case with this crypto pair as well. At the moment, we recommend monitoring the price momentum and entering trades according to your trading plan.
We have set three targets based on your bias, but please note that these are not a confirmation of buy or sell. They are simply our overview of the trade and are limited to the knowledge and experience of our traders.
Wishing you good luck and safe trading!
Thank you for your unwavering support! 😊
If you’d like to contribute, here are a few ways you can help us:
- Like our ideas
- Comment on our ideas
- Share our ideas
Team Setupsfx_
❤️🚀

SUIUSDT - Don't wait for pullback!SUI is the star of this season — on the 3-day chart, it just broke out of a falling wedge pattern with a massive green candle.
The price also reacted strongly to the 0.618 Fibonacci level, indicating there’s still plenty of upside potential ahead.
Don’t wait for pullbacks — coins like this rarely give clear entry opportunities, and any correction is usually very shallow.
It’s either you buy now, or regret it later.
Best regards Ceciliones 🎯

SUI whats the target ?SUI / USDT
SUI is just following my scenario 2 in previous analysis.. click here
What next ? :
With current big price surge we are looking for previous ATH , after that the main resistances are: 7$ and 9$/10$
They are considered very strong resistance but if the price could overcome them we will see SUI flying like never before
Always do risk management
Make your plan and dont FOMO
Best of wishes

SUI/USDT:BUYHello friends
Due to the price correction, we can buy in two designated areas in a stepwise manner. Elite with capital and risk management.
*Trade safely with us*

SUI Breaks Key Trendline – Bullish Reversal in MotionCRYPTOCAP:SUI has broken above the descending resistance line, confirming a trend reversal after weeks of downward movement. This breakout came after price bounced from a strong support zone, establishing a higher low structure.
The breakout is also supported by a move above the 50 EMA, adding strength to the bullish case.
DYOR, NFA

SUIUSDT 1DSUI ~ 1D Analysis
#SUI If you lose the opportunity for Coin CRYPTOCAP:AVAX 2021, don't lose Coin #Sui 2025. This coin will follow #Avax success in 2021

SUI/USDT:BUY LIMITHello friends
Due to the heavy price drop, it can be seen that the buyers have supported the price well at the specified support and by hitting higher ceilings and floors, they are giving us a sign that they have good strength. Now we can buy in steps with capital and risk management and move to the specified targets.
Don't forget to save profit on each target.
*Trade safely with us*

SuiUsdt Trade setup 12-15% upside ??recent impluse momentum with a formation of HL on 1h could be a sign of trend change
trade entry at2.300 to 2.350 demand zone further up at 2.5 can be the potential pullback area and could then face resistance at 2.65
and considering the down side risk at 2.200 can be the stop loss as it is recent low that bulls will try to defend

#SUI/USDT#SUI
The price is moving within a descending channel on the 1-hour frame and is expected to continue lower.
We have a trend to stabilize below the 100 moving average once again.
We have a downtrend on the RSI indicator, supporting the upward move with a break above it.
We have a resistance area at the upper limit of the channel at 2.55.
Entry price: 2.52
First target: 2.40
Second target: 2.32
Third target: 2.20

SUI/USDT long/buyBy utilizing Fibonacci retracement levels, historical patterns, , we can formulate a hypothesis that the market might follow a similar trajectory if bullish sentiment prevails.

SUI Rebounds from Key Demand Zone – Bullish Continuation Ahead?SUI has recently bounced from a key supply and demand zone between the 0.618 ($2.36) and 0.786 ($1.52) Fibonacci retracement levels, showing strong buyer interest in this range. This zone also coincides with a previous resistance line that has now flipped into support, adding further confluence to this area as a significant level for trend continuation.
After pulling back from its recent high around $5.44, SUI respected the 0.618 Fib level and has begun to recover, currently trading around $2.71. If momentum continues, the next resistance levels lie at the 0.5 ($2.95) and 0.382 ($3.54) Fib levels, followed by a potential move back toward the $4.26 zone.

SUI - Last Growth Ahead Before Bear MarketHello, Skyrexians!
It's time to update BINANCE:SUIUSDT idea. Last time we pointed out that wave 3 has been finished and correction incoming. Now we are seeing this correction. Today we got the indicating that correction is over and we can see the great growth soon.
Let's look at the weekly chart. Here we can see the Elliott waves structure. Wave 3 has been finished at the recent top. Awesome oscillator gives us the hint that bull run will continue, but now that much because we have only wave 5 ahead which has a target $5-7 in the next 3-6 months. The strong confirmation that correction is over is the green dot on the Bullish/Bearish Reversal Bar Indicator below the alligator's lines.
Best regards,
Skyrexio Team
___________________________________________________________
Please, boost this article and subscribe our page if you like analysis!

SUIUSDT 5DSUI ~ 5D Analysis
#SUI Buy and hold, coin blue chip that might be included in the Top 10 Marketcap list.
Target $10 ++

Breaking: $SUI Dips 8% Today Down to $2.28Sui the layer 2 layer-blockchain platform designed to support the needs of global adoption by offering a secure, powerful, and scalable development platform, leveraging a novel object-centric data model and the secure Move programming language to address inefficiencies prevalent in existing blockchain architectures has dip 8% today amidst a broader market condition.
As of the time of writing, CRYPTOCAP:SUI is down 4.2% trading below key Moving Averages (MA) with the Relative Strength Index (RSI) currently oversold at 39 hinting at a move breaking below the support point to the 1-month low axis.
Sui Price Live Data
The live Sui price today is $2.25 USD with a 24-hour trading volume of $627,615,661 USD. Sui is down 7.77% in the last 24 hours. The current CoinMarketCap ranking is #18, with a live market cap of $7,119,977,067 USD. It has a circulating supply of 3,169,845,047 SUI coins and a max. supply of 10,000,000,000 SUI coins.

SUIUSDT: Breakout + Retest = Lift-Off Soon!BINANCE:SUIUSDT has shown impressive strength, bouncing back with solid volume after hitting a major weekly support level. This bullish reaction suggests a potential move toward higher highs, making it an attractive opportunity for long-term investors. Entering a position in the spot market and holding for the long term could yield significant gains.
On the 4-hour chart, SUI is forming an ascending triangle pattern. After breaking out, it has successfully retraced and is now gearing up for a strong swing move. Traders can consider entering at this level and look to book profits as the price climbs higher. As always, managing risk with a proper stop loss is crucial.
BINANCE:SUIUSDT Currently trading at $2.4
Buy level : Above $2.4
Stop loss : Below $2.15
Target : $3.5
Max leverage 3x
Always keep stop loss
Follow Our Tradingview Account for More Technical Analysis Updates, | Like, Share and Comment Your thoughts

SUI/USDTHello friends
Due to the recent decline, we have found a good support area for you, if it is reached, you can buy and move to the specified targets.
*Trade safely with us*
#SUI/USDT#SUI
The price is moving in a descending channel on the 1-hour frame and is adhering to it well and is heading to break it upwards strongly and retest it
We have a bounce from the lower limit of the descending channel, this support is at a price of 2.36
We have a downtrend on the RSI indicator that is about to break and retest, which supports the rise
We have a trend to stabilize above the Moving Average 100
Entry price 2.44
First target 2.51
Second target 2.64
Third target 2.78

SUI/USDT UPDATE Hello friends
Given the floor that the price has made, we now see the power of buyers in the price reversal, and given the power of buyers, we can make purchases, of course, in stages and with capital management and move with it to the specified goals.
*Trade safely with us*

SUIUSDT 8HSUI ~ 8H Analysis
#SUI On the time frame 8H, Selling pressure on this coin seems to have been completed. Buy after successfully penetrating this resistant line with a minimum target of 10%+.
