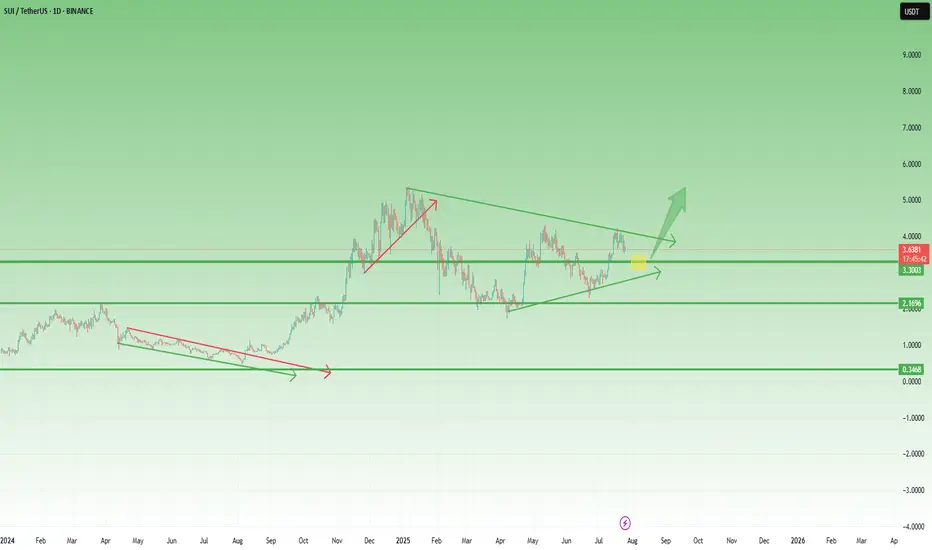
SUI – Preparing for a Breakout? Symmetrical Triangle in PlaySince the beginning of the year, SUI has been consolidating inside a classic symmetrical triangle — marked by higher lows and lower highs, a sign of tightening price action and growing pressure.
This kind of structure doesn’t last forever.
Usually, it ends with a strong breakout — especially if supported by volume.
🔍 What to watch:
- A break above the upper trendline could trigger a strong move, with potential targets in the $5 area and even a new ATH, if altcoins enter a real revival phase.
- On the flip side, $2.80 remains the key support level.
As long as it holds, bulls remain in control of the structure.
📍 My game plan:
I’m watching the $3.25 area as a potential buy zone —a great spot inside the pattern, offering tight risk and strong upside if the breakout comes.
Until then, it’s all about patience.
Pressure is building. The triangle is tightening.
And the market is waiting for a reason to move.
Suiusdtsignal
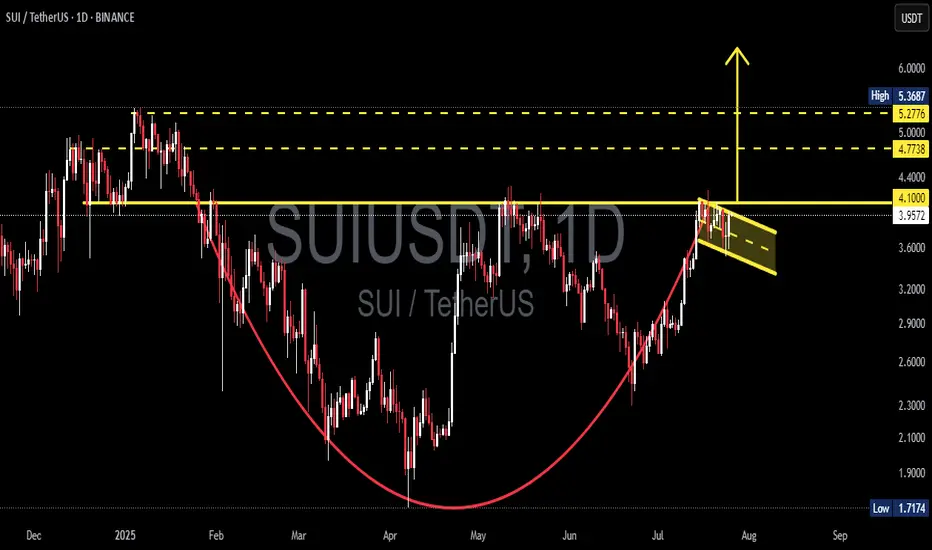
SUI/USDT Massive Cup and Handle Pattern Unfolding Is a Breakout?🧠 Technical Overview:
The daily chart of SUI/USDT showcases a textbook formation of the Cup and Handle pattern — a powerful bullish continuation signal that often precedes explosive upside moves.
The “Cup” took shape between January and July 2025, reflecting a deep rounding bottom. This indicates a long-term accumulation phase where bears gradually lose control.
The “Handle” is currently forming as a downward-sloping consolidation channel, often known as a bullish flag, which is typically the final pause before a breakout.
🔍 Key Technical Levels:
Current Price: $3.9661
Support Zone: $3.96
Major Resistance Levels to Watch:
$4.10 (handle resistance & breakout trigger)
$4.40 (local structural high)
$4.77 (previous high & fib extension zone)
$5.00 (psychological level)
$5.36 (measured move target from cup breakout)
---
🟢 Bullish Scenario: Breakout Incoming
If price breaks and closes above the handle resistance around $4.10, backed by increasing volume:
This confirms the Cup and Handle breakout.
Expect a rapid move toward $4.77 – $5.36 in the short to mid term.
The height of the cup projected upward gives a target of approximately +35% gain from breakout point.
🔔 Watch for:
Bullish engulfing candles
Volume spike during breakout
Break of upper trendline from the handle
---
🔴 Bearish Scenario: Breakdown Risk
If the price fails to hold the $3.96 support and breaks down from the handle channel:
Price may retest lower support zones near $3.60 or even $3.20
However, as long as the cup’s base at ~$2.50 holds, the macro bullish structure remains valid.
⚠️ Invalidation: A daily close below $3.60 would invalidate the short-term bullish setup.
---
📊 Pattern Psychology:
The Cup and Handle pattern reflects investor accumulation, shakeout, and renewed confidence. This is often seen in strong uptrending markets — and the current structure suggests that bulls are quietly preparing for a potential breakout.
---
📅 Timing Outlook:
Handle formations typically last between 1–3 weeks. If this timeline holds, a breakout could occur before mid-August 2025.
---
✅ Conclusion:
The technical setup for SUI/USDT is extremely compelling. With a strong Cup and Handle pattern nearing completion, and key resistance just overhead, traders should prepare for potential breakout conditions. A confirmed move above $4.10 could trigger a bullish wave toward $5.00+.
📌 Set alerts. Manage risk. And don’t ignore the volume.
#SUI #SUIUSDT #CryptoBreakout #CupAndHandle #BullishSetup #CryptoChartPatterns #AltcoinAnalysis #TechnicalAnalysis #BreakoutTrade
SUI Collapse Incoming? Bearish Pattern You Can’t IgnoreYello, Paradisers! Is #SUI about to enter a bearish spell? We’ve seen this setup many times before, and the warning signs are stacking up fast. If you're not already positioned or protecting capital, now’s the time to pay attention.
💎SUIUSDT has started losing momentum just as a classic head and shoulders pattern has completed at the top, a formation often associated with trend reversals. This bearish structure is further validated by the presence of bearish divergence on momentum indicators, hinting at exhaustion from buyers and growing strength among sellers.
💎#SUIUSDT's neckline support at $3.60 has been breached, and since then, price has been sliding gradually. Right now, its on a path toward the $3.00 level, a moderate support area where some initial profit-taking may occur. However, according to the structure's full pattern target, the move is likely not over just yet.
💎Given the weakening market dynamics and lack of bullish follow-through, an extended dip cannot be ruled out. If sellers manage to overwhelm the $2.65 floor, the next potential landing zone would be around $2.30, a high-confluence level with a strong historical order block. This is a zone where a more meaningful bounce or even a longer-term reversal could initiate, but only if market sentiment finds footing.
💎On the other side, bulls face an uphill battle. They must reclaim the $3.65 to $3.80 resistance range, a zone that has consistently rejected upward attempts over the past several days. A breakout above this range would be the first sign of renewed bullish intent and could help ease the selling pressure.
Paradisers, strive for consistency, not quick profits. Treat the market as a businessman, not as a gambler.
MyCryptoParadise
iFeel the success🌴

SUIUSDT 1D Analysis SUI ~ 1D Analysis
#SUI Buy gradually from this support block with short term target of at least 15%+, Long term target $11

#SUIUSDT: A Swing Buy In Making, Get Ready For Big MoveThis cryptocurrency pair is currently undergoing consolidation, and we’re observing a shift in price momentum. A substantial volume could enter the market at any moment. Two potential reversal zones exist where significant volume could emerge and potentially push the trading price above $8. We’ve also positioned two take profit targets in conjunction with these zones.
It’s important to remember that trading or investing in financial markets carries significant risks to your capital. We don’t guarantee that the price will move precisely as described.
Prioritise safe trading practices. If you’d like to show your support, you can like, comment, or share our ideas.
Team Setupsfx_

SUI/USDT.P Short Setup — Ride the Wave to Profits!Trade Details:
Entry: 3.56 - 3.6 USDT
Stop-Loss: 3.6935 USDT
Take-Profit Levels:
TP1: 3.4215 USDT
TP2: 3.2700 USDT
TP3: 3.0640 USDT
With clear targets set and a tight risk management strategy, this setup offers a great opportunity to ride the wave of the market’s next move.
Patience and discipline are key. Stay focused, follow your plan, and let's make this trade count!

#SUIUSDT: Will Bulls Continue The Move Upwards of $8?The price of BINANCE:SUIUSDT has been bullish since completing its accumulation phase and is currently in the distribution phase. It has shown a strong change of character, with a steady move. However, a short-term correction is expected to fill the gap that the price has left behind.
In a bullish scenario, prices often continue their upward trend without making corrections, and this could be the case with this crypto pair as well. At the moment, we recommend monitoring the price momentum and entering trades according to your trading plan.
We have set three targets based on your bias, but please note that these are not a confirmation of buy or sell. They are simply our overview of the trade and are limited to the knowledge and experience of our traders.
Wishing you good luck and safe trading!
Thank you for your unwavering support! 😊
If you’d like to contribute, here are a few ways you can help us:
- Like our ideas
- Comment on our ideas
- Share our ideas
Team Setupsfx_
❤️🚀

SUIUSDT 1DSUI ~ 1D Analysis
#SUI If you lose the opportunity for Coin CRYPTOCAP:AVAX 2021, don't lose Coin #Sui 2025. This coin will follow #Avax success in 2021

SUI/USDT long/buyBy utilizing Fibonacci retracement levels, historical patterns, , we can formulate a hypothesis that the market might follow a similar trajectory if bullish sentiment prevails.

SUIUSDT 5DSUI ~ 5D Analysis
#SUI Buy and hold, coin blue chip that might be included in the Top 10 Marketcap list.
Target $10 ++

Breaking: $SUI Dips 8% Today Down to $2.28Sui the layer 2 layer-blockchain platform designed to support the needs of global adoption by offering a secure, powerful, and scalable development platform, leveraging a novel object-centric data model and the secure Move programming language to address inefficiencies prevalent in existing blockchain architectures has dip 8% today amidst a broader market condition.
As of the time of writing, CRYPTOCAP:SUI is down 4.2% trading below key Moving Averages (MA) with the Relative Strength Index (RSI) currently oversold at 39 hinting at a move breaking below the support point to the 1-month low axis.
Sui Price Live Data
The live Sui price today is $2.25 USD with a 24-hour trading volume of $627,615,661 USD. Sui is down 7.77% in the last 24 hours. The current CoinMarketCap ranking is #18, with a live market cap of $7,119,977,067 USD. It has a circulating supply of 3,169,845,047 SUI coins and a max. supply of 10,000,000,000 SUI coins.

SUIUSDT: Breakout + Retest = Lift-Off Soon!BINANCE:SUIUSDT has shown impressive strength, bouncing back with solid volume after hitting a major weekly support level. This bullish reaction suggests a potential move toward higher highs, making it an attractive opportunity for long-term investors. Entering a position in the spot market and holding for the long term could yield significant gains.
On the 4-hour chart, SUI is forming an ascending triangle pattern. After breaking out, it has successfully retraced and is now gearing up for a strong swing move. Traders can consider entering at this level and look to book profits as the price climbs higher. As always, managing risk with a proper stop loss is crucial.
BINANCE:SUIUSDT Currently trading at $2.4
Buy level : Above $2.4
Stop loss : Below $2.15
Target : $3.5
Max leverage 3x
Always keep stop loss
Follow Our Tradingview Account for More Technical Analysis Updates, | Like, Share and Comment Your thoughts

SUIUSDT 8HSUI ~ 8H Analysis
#SUI On the time frame 8H, Selling pressure on this coin seems to have been completed. Buy after successfully penetrating this resistant line with a minimum target of 10%+.

SUIUSDT 1DSUI Update ~ 1D
#SUI The Layer 1 winner in 2025 will be CRYPTOCAP:SUI , This is indisputable. #SUI Will be a new player in the TOP 10 Marketcap #Crypto

#SUIUSDT 1 DAYSUIUSDT Daily Analysis
The SUIUSDT pair is forming a rising wedge pattern on the daily chart, which often indicates a potential bearish reversal. The price is approaching the wedge's support line, and a breakdown below this level would signal increased selling pressure, offering a strong sell opportunity.
Technical Outlook:
Pattern: Rising Wedge
Forecast: Bearish (More Sell Opportunity upon Support Breakdown)
Entry Strategy: Enter a sell position after the price breaks below the wedge's support line and confirms the breakdown with bearish price action, such as a strong close below the support or a retest of the broken level.
Traders should use indicators like RSI or MACD for confirmation of weakening bullish momentum. Proper risk management is critical, with stop-loss orders placed above the wedge and profit targets set at key support zones below.

$SUI Breakout: Bullish Rally in Sight!CRYPTOCAP:SUI Breakout of this symmetrical triangle pattern, confirming bullish momentum!
📈 Entry: Accumulate above $3.80
🎯 Targets:
Midterm: $5.00 (30% upside)
Long-term: $6.25 (60% upside)
🛡️ Stop-loss: $3.45
Available for both spot and futures trading. A confirmed breakout indicates the potential for a strong rally ahead. Use proper risk management!
ABOUT CRYPTOCAP:SUI
CRYPTOCAP:SUI is a next-gen blockchain designed for high-speed transactions and scalability, catering to decentralized applications and new-age financial systems.
About SUI:
Sui is a next-generation blockchain designed for high-speed transactions and scalability, catering to decentralized applications and modern financial systems.
Disclaimer:
This information is for educational purposes only and should not be considered financial advice. Cryptocurrency investments carry significant risk; conduct your own research (DYOR) and consult with a financial advisor before making investment decisions.
#Crypto #Altcoins #SUI
SUI Jumped in TVL and Still Looks Bullish / Targets and PlansBINANCE:SUIUSDT
COINBASE:SUIUSD
Longterm Scenario
📈Which side you pick?
Bull or Bear
SL1 ---> Low-risk status: 3x-4x Leverage
SL2 ---> Mid-risk status: 5x-8x Leverage
(If there is just one SL on the chart, I suggest, low risk status)
👾Note: The setup is active but expect the uncertain phase as well. also movement lines drawn to predict future price reactions are relative and approximate.
🧐The Alternate scenario:
If the price stabilize below the trigger zone, the setup will be canceled.

SUIUSDT**SELL. Don't forget about stop-loss.
Write in the comments all your questions and instruments analysis of which you want to see.
Friends, push the like button, write a comment, and share with your mates - that would be the best THANK YOU.
P.S. I personally will open entry if the price will show it according to my strategy.
Always make your analysis before a trade

SUIUSDT: Restesting ATH Support—Bull Run Resuming Soon!BINANCE:SUIUSDT is currently retesting its all-time high support and is poised to resume its bull run from here. After a healthy consolidation following the ATH breakout, it’s time for take-off! As a strong layer 1 blockchain with a robust community backing it, I’m expecting new ATHs in the near future. Keep an eye on this one!
BINANCE:SUIUSDT Currently trading at $2.14
Buy level: Above $2.1
Stop loss: Below $1.69
TP1: $3
TP2: $4.5
TP3: $6
TP4: $7
Max Leverage 3x
Follow Our Tradingview Account for More Technical Analysis Updates, | Like, Share and Comment Your thoughts

My point of View For SUIDear Follower
I got a multi request to analyze SUI
I see SUI most likely will hit $5.5 easily
I recommend liquidate 50% of your fund at that price then start use a trilling stop under each last new bottom for the rest of the fund
Good luck every one

SUI at Risk: Bearish Momentum and Key Levels to Watch!Yello, Paradisers! Is SUI heading for another leg down, or will it surprise us with a breakout? Here's our take.
💎SUI is showing strong bearish momentum right now as it faces a key supply area. One of the main signals confirming this is the bearish divergence on the RSI indicator, which often indicates a potential price drop. If SUI gets rejected again (as it did previously), there’s a good chance it will revisit the 1.7180 demand zone, possibly giving us a short-term rebound before continuing its downward journey toward the 1.6 support level.
💎This 1.6 area is crucial because a break below this zone would validate a double-top pattern, suggesting a significant bearish move. Should this happen, we could see SUI targeting the Bullish OB at the 1.24 level.
💎However, if SUI breaks out above its All-Time High (ATH) at 2.18 and closes the day above it, this will invalidate the bearish setup. Such a breakout would signal a bullish continuation, and we’d expect prices to push higher. In that case, it would be wise to close any short positions on SUI, as the trend could shift significantly.
Discipline, patience, and strategic positioning are key here.
MyCryptoParadise
iFeel the success🌴

SUI Recovery in Play: Targeting $1.44 After Key BreakoutAfter reaching an all-time high (ATH) above $2 at the end of March, SUI entered a correction that pushed the coin below the key $1 level, reaching a low just under $0.50 on August 5th. However, SUI quickly recovered, and by August 8th, the SUI/USDT pair had broken above the falling resistance line of the channel, hitting a high above $1 on August 12th.
Following this move, the coin consolidated below this critical level, forming a clear higher low around the $0.75 zone. Currently, SUI is trading back above $1, sitting just below an important technical resistance. A breakout above this resistance appears imminent, with the first target for further upside being $1.44, representing a potential 40% rise.
Looking further ahead, if the broader crypto market continues to show optimism toward the end of the year, SUI could potentially retest its previous ATH above $2.

SUI/USDT Technical Analysis, 154% Potential surge in few weeks.SUI is showing strength as it approaches a critical resistance level. A confirmed breakout could push SUI into a price discovery phase, opening up the potential for significant gains.
Current Price: Around $1.02
Optimal Entry Zone: $0.75 to $1.00
Target: $2.58 (154% potential gain)
Resistance: A breakout above this level could unlock major upside potential
Lower Support: Strong support around $0.50
Two Potential Scenarios:
Scenario 1: A breakout and daily close above $1.10 will trigger a strong buy signal.
Scenario 2: A retest of the lower level between $0.75 to $0.95 offers an opportunity to accumulate.
Strategy:
To maximize gains while minimizing FOMO, consider buying 30% at the current price (CMP) and adding the remaining 70% if either of these scenarios plays out. This way, you’re positioned for profit regardless of the market's direction.
A breakout above this key resistance could see SUI reaching new highs.
This is a setup worth watching, especially for those looking to accumulate on retests.
Please keep it on your radar!
Not financial advice. DYOR!
Want more setups for spot and futures? Follow me and like this post!
Thank you
#PEACE
