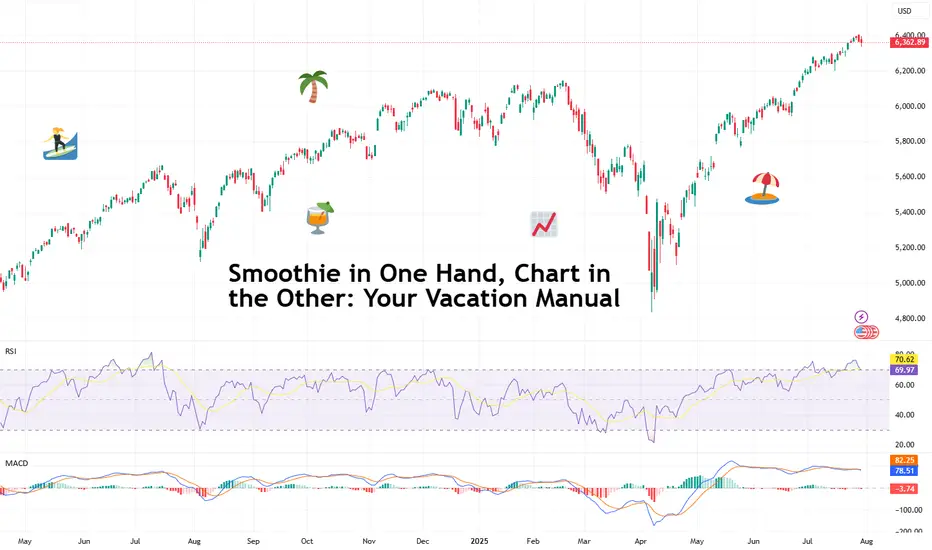
Smoothie in One Hand, Chart in the Other: Your Vacation ManualSome traders bring a beach read. Others bring their TradingView charts.
It’s the heat of the summer and we figured, why not take it easy with a breeze of lightweight lines to pair with your mezcal espresso martini? Let’s talk about how to relax while still watching the markets.
🏄♂️ Market Never Sleeps… But You Should
Vacations are supposed to be about unplugging, but for traders, that’s just code for “I’ll switch to the app instead.”
And we don’t blame you. With all that’s going on — US-EU tariff deal, stocks at record highs, and Ethereum BITSTAMP:ETHUSD outperforming Bitcoin BITSTAMP:BTCUSD in a monster July run — it’s only natural for market participants to be hooked at this time.
But watch for those signs of getting overly attached. Studies show performance suffers when you're overcooked — like your last scalp trade on Powell Day. So yes, that mojito matters. Just don’t place a leveraged position on a pool float.
📅 Timing the Market… and Your Booking
Let’s talk timing. The pros know not to schedule getaways during Nonfarm Payrolls week or FOMC decision day. (Unless your idea of relaxing is explaining yield curves to your kids on a ferry across lake Como.)
Instead, try planning your time off during historically low-volatility periods. Summer often sees volume dry up like your skin without sunscreen. Think August’s fairly dry weeks — when even the algorithms seem to be on holiday. As always, consult with the Economic Calendar to know when these are.
Bonus tip: if you’re flying and you wanna stay wired in, go for premarket or after-hours shifts. Nothing says “seasoned trader” like placing an order while the flight attendant gathers everyone’s attention for the safety demo.
🧴 SPF 50 and the S&P 500: Know Your Risk Exposure
In these scorchers outside, you wouldn’t step out without sunscreen, right? But would you let your positions roast unsupervised?
Use stop losses like you use sunblock: generously and repeatedly. Even better — scale back. Summer’s thin liquidity (and other summer trading traps ) can turn minor market moves into full-on tidal waves. No one wants to explain to their friends why they lost 40% of their portfolio during a snorkeling trip.
Adequate position sizing is your beach umbrella. It doesn’t stop the storm, but it’ll stop the burn.
🧭 Wi-Fi, but Make It Secure
Public Wi-Fi is great for scrolling memes, not executing trades. One accidental login from a beachside café in Mykonos and boom — your brokerage account may become a group project.
Trading from your vacation spot shouldn’t be a flex (no matter how much you want to look cool to the bunch of people around you). Focus on your game, trade in silence, and bask in sunlight and success.
☀️ Pack Light, Trade Lighter
The golden rule? If you’re not at your desk, don’t trade like you are.
Scale back positions, minimize leverage, and don’t try to outperform the market while someone’s kid is throwing a beach ball at your head. This is a maintenance phase, not a moonshot month.
Think: protect capital, avoid drawdowns, maybe sneak in a swing trade between sunscreen applications.
📲 Must-Have Apps for Sand-and-Screen Trading
You’re not bringing a full setup, but your phone can still do the heavy lifting. Load it with TradingView (obviously), your broker, ideally paired with TradingView, and a solid news feed . Bonus points for noise-canceling headphones that can drown out both market panic and crying toddlers.
Set up push notifications smartly — only the alerts you actually need. You don’t want your wrist buzzing every time Nvidia NASDAQ:NVDA moves 0.1%.
Question for the road : What’s your best summer trade… and was it worth checking your phone at dinner to place it?
Summer
Gold XAUUSD Summer Price Action - Trading Psychology☀️ Summer Trading Blues? Here’s How to Stay Sharp Without Burning Out
Summer trading on Gold isn’t for the impulsive or the greedy. Liquidity dries up, sessions lose momentum, and the clean, aggressive price action we love? It goes on vacation too.
But that’s not a bad thing. It’s an opportunity.
This is the season where traders either burn out... or build.
Here’s how to keep your edge sharp while the markets slow down — and why a positive, focused mindset is your biggest asset until volatility returns.
Why Summer PA Feels “Off” on Gold
You’re not imagining it — gold price action does shift in the summer, and here’s why:
🏖️ Bank Holidays & Institutional Slowdowns
• Major global banks take scheduled breaks — including in the US, UK, EU, and Asia.
• Trading desks reduce activity, and high-volume players shift into passive management mode.
• This results in lower volume, fewer impulsive moves, and more algorithmic fakeouts.
📆 Official Holidays + "August Mode"
• US Independence Day (July 4), UK Summer Bank Holiday (late August), and more → NY and London sessions thin out or lack follow-through.
• Most institutional traders go on leave. Some desks run skeleton crews. No joke.
• Unless a major geopolitical catalyst (e.g. war escalation or surprise central bank move) hits the headlines, price will drift or trap.
🏄♂️ Retail Overreach & Emotional Traps & Vacation Time
• Retail traders often “force” trades in quiet markets to stay busy.
• This leads to chasing, overtrading, and emotional fatigue — the exact trap smart traders avoid.
• Most regular traders also go on vacation or scale back — unless they’re mentally obsessed with Gold and can’t let it go.
Bottom line:
Summer PA is slower, trickier, and full of emotional bait. Learn to read the stillness — not fight it.
💡 Your Summer Trading Mindset Kit
Instead of complaining about the range, use this time to train your mindset.
Here’s how:
⚖️ Stay Emotionally Neutral — Even When Price Isn’t
Summer markets bait your emotions: fake breakouts, slow reactions, and dead zones.
To stay in control, build structure around your execution:
✅ Pre-market: Make a clear plan with meaningful zones and set alerts — don’t wing it on hopes and dreams
✅ Post-market: Write down why you stayed out or why your trade was clean — not just wins or losses
Neutrality isn’t passive — it’s disciplined clarity, even when the chart’s doing nothing.
🎯 Focus Over FOMO
Short sessions. Laser focus. Clean execution.
→ Limit distractions
→ Trade only clear, structured setups
→ Respect no-trade days as productive days
Flow isn’t magic — it’s discipline + environment.
🤝 Find the Trading Circle That Matches Your Style — to reinforce your style
Not every group fits you — and not every voice deserves your attention.
Look for people who:
• Respect structure over noise
• Give thoughtful, honest feedback
• Celebrate patience and growth, not screenshots and bragging and 20-30 pips wins
A real trading circle matches your energy and raises your game — not your cortisol.
💭 Reconnect With Your “Why”
If you’re here just to “make money,” summer will test you hard.
Purpose anchors you when price doesn’t. Ask yourself:
• Why do I trade?
• Who am I becoming through this process?
No purpose = burnout.
Purpose = clarity, even in silence.
📈 Discipline Pays When Gold Doesn’t
Forget chasing fireworks in dead markets.
Summer rewards the trader who does less but does it right:
✅ You skipped noise? That’s a win.
✅ You waited for your zone? Pro-level move.
✅ You tracked your behavior? You’re not guessing — you’re evolving.
While others burn out chasing crumbs, you’re stacking discipline — and that’s what you’ll cash in when the real moves return.
Final Words: Quiet Traders Get Loud Later
Summer might be slow. But your growth doesn’t have to be.
While others force trades, smart traders sharpen edge.
You’re not falling behind by sitting out chop — you’re building mastery for when real money moves return.
🗓️ So in September YOU are going to show up: stronger, clearer, and 3x more prepared.
If this lesson helped you today and brought you more clarity:
Drop a 🚀 and follow us✅ for more published ideas.

Looking to take profits on Microsoft that's severely overboughtThis summer most stocks will lose their momentum making it a great time to take profits. We got into NASDAQ:MSFT at an average of $$350-375, it's time to sell at least half to 75% of the stack then buy back around the 0.618 golden fibonacci at $400 after the gap is filled.

Time to take profits on Robinhood, it's extremely overboughtit's just about time for profit taking with summer here. Aiming for around $45-50 prior resistance turns to support, to buy back in at the 0.618 golden fib level as well.

Traeger | COOK | Long at $2.50Traeger NYSE:COOK is in an accumulation zone and approaching a change in the downward trend based on my selected simple moving average. Insiders have shown confidence in future price improvement by buying shares and being awarded options in the low $2s. With a 58M float and anticipated earnings improvement through 2027, this ticker may be poised for a run soon. There is a tiny gap in the daily chart between $2.19 and $2.20 that may get filled before then, but Traeger has a strong brand name and can be found in multiple big box stores. A slowing economy may dampen this move in the near-term, but NYSE:COOK is in a personal buy zone at $2.50.
Target #1 - $4.15
Target #2 - $5.00
Target #3 - $8.50
Target #4 - $19.00 (very long-term...)

(BTC) bitcoin "auto fib retracement - 100"BTC falling beneath the 100 auto fib retracement.
Other cryptocurrency also beneath the red layer of the auto fib retracement include;
AVAX, BADGER, CELO, COIN, CURVE, DASH, EGLD, HFT, KSM, MINA, RAD, SUSHI...and ICP is in the red unlike the other top traded cryptocurrency remaining in green, neutral or blue areas of the auto fib retracement.
Others below the red line include:
IMX, SUPER, AUCTION, PERP, IDEX, NMR, OGN, YFI, BLUR, DYP, STORJ, UMA, AXS, BTRST, SEI, APE, C98, DIA, LDO, METIS, GRT, TIA, MATIC (POLS), XCN and FX.
Still no info from the newly listed tokens/coins of 2024.

(ETH) ethereum "direction"I think Ethereum is headed in the direction of the black neutral zone area as seen in the auto fib retracement indicator. The 50 day and 100 day moving average lines show Ethereum headed towards the neutral zone. Due to the neutral zone being above the price, I think the price of Ethereum is going to gain in price.

BONK (BONK) The price of bonk has reached the curvature of the trending line drawn on the screen to follow the pattern of trade. Looks to be probable that the price of Bonk could increase from here, now.

(BTC) bitcoinCould this be the future of Bitcoin in the next month? Will the price of BTC skyrocket at the end of August? MACD indicator prediction methods used. Bitcoin 2024 Summer Forever,.

(BTC) bitcoinThis is what my latest custom indicator looks like on the bitcoin chart. Not great but there's always room for potential hope. I find hope comes mind a lot with trading mostly because I don't have the money to move markets. Luckily, no one really has the money to move the Bitcoin market, and surely the Ethereum market too. Best two investments in crypto; ETH and BTC. The lines are moving against the trajectory of hope right now. Bitcoin and Ethereum are under the 100 day moving average. Most trending moving average lines are above crypto by now. When I see the bitcoin chart on its own the trend seems doomed. Most of the altcoin patterns have already lost their way to a repeatable price bottom based on before the run up prices in the last few months. Could this mean the chance of Bitcoin falling is less likely due to the knowledge that most altcoins are not in anyway trapped which could lead to the altcoin season,.

(ETH) ethereumindicator look at the Ethereum price.
The green line trend represents a price headed to higher prices when the green line touches down. The green line is touching the 0 horizon. There are many different indicators to determine positive or negative directions. These indicators give a potential positive outlook.
Price of ethereum should retain some surmountable levels considering the hype and logical phase of ETH ETF. Ethereum did not go through a halving like Bitcoin therefore the future price of Ethereum is much more leading or telling based on history one might suppose.

XYO (XYO) "green line--higher low"xyo formed a higher low and sits in a green direction based on the previous lower high. Could things be finally turning around for XYO. Will the dismissal of A.I. fad be wrong and will the trend of A.I. culture continue to surpass all expectations.

TOTAL CRYPTO TICKERThe auto fib retracement and auto fib extension show both indications cryptocurrency ripe to for taking in addition to a complete bottoming out of the price as a whole. Distracted by something, or too busy soaking up the second month of summer? Long orange line represents the time period when the drop happened and the price of cryptocurrency going beyond the 100 day without improving therefore falling. Looks like an opportunistic moment where the fibonacci levels appear as though cryptocurrency is flailing around underneath the resevoir of time and money.

$BTC consolidating for August breakout $70k+After some over performance in early July we set a Bullflag last week around $65k. Don't get shook! This time last year, in 2023, we had a long period of consolidation March-October (in white) before rising above the $30k level. This year, summer of 2024, we're rhyming.
Bearish? CRYPTOCAP:BTC needs to lose the $60k level and hold us below it for at least a week. I think a bullish inverse head & shoulders is more likely but geopolitical risk, and US elections could be the wildcard. I would remain careful with shorts as the trend is upwardly volatile.
Here's the previous idea, explaining the trade:

jasmy (JASMY)There are signs of the leading 50 day and 100 day lines are shifting behind the recent highs along a channel with the price in trend. The indicator is variable and does realign based on other charts I look at but so far it seems this one is sticking firmer than before.

Jasmycoin (JASMY)There is a green long arrow on Jasmy appeared today using DGT Elliott Wave indicator. The price has finally crossed over the pit of despair. The lines kept pushing back and pushing back but now it appears as though Jasmy is rising.

(BTC) BITCOIN "trend angle hypothetical"A hypothetical trend line for Bitcoin where there is a strong potential for the price to continue to gain in price into September based on a modified custom setting of the SAR indicator. You can see the settings of the SAR indicator in the image. There is a lot of standard indicators that point to the price of Bitcoin losing. This is another method and an alternative perspective.

(ETH) ethereumA made up idea here. The lines converge in the middle of july. If the price of Ethereum climbs towards that moment there is a good chance Ethereum crashes. If the price of Ethereum stays neutral or even declines leading to the middle of July there is a good chance the price of Ethereum rises. Mysterious.
The Olympics start at the end of July. . . . . . .

(BTC) Bitcoin "moose antler"Bitcoin looking like a moose out in there in the wild. Looks to be sum while before the solid is underneath the stepline with breaks which would signal a coming difference in price for positive remainders. Bitcoin is of course like no other crypto. The points at which the two lines cross paths means the price is falling or rising in the near future. As you can see the lines are not very close. It's like an advanced variation on bollinger bands without being bollinger bands. custom. The days are numbered, the solstice has arrived and gone--down the creek without a paddle--, and the evenings are only losing sunlight, yet the summer is only just beginning.

Bitcoin Inverse Head And ShoulderHey! I am watching this for Bitcoin.
Should happen over the summer.
Stay profitable out there.

(BTC) bitcoinrank, % rank, median; info dots chart graph volume of buying power, note, graph indicator progress, process; make zone, ideas.

(ETH) ethereumThe curvature of lines that I was looking for at last. Now I can finally get away from this endless searching for the right code. Ethereum graph.

SUI 2.8$ next level ?Now we see the pullback of SUI to 0.5 FIB level and reaction from OB after bullish movement happened. Price is walking in accumulation phase and I want to see liquidity grab and then bullish movement on summer.
