Super TrendA Super Trend is a trend following indicator similar to moving averages. It is plotted on price and the current trend can simply be determined by its placement vis-a-vis price. It is a very simple indicator and is constructed with the help of just two parameters- period and multiplier.
Super Trend calculation;
Formula:
Supertrend Upper Line (RED line) = (High + Low) / 2 + multiplier × ATR.
Supertrend Lower line (Green Line) = ( High + Low) / 2 - Multiplier × ATR.
How to Use Supertrend Indicator ?
To use this Supertrend, you need to follow these steps:
Open the chart of a particular stock you want to trade.
Fix the time interval of 10 minutes for the intraday trading. For that you can use any good charting software.
Insert the supertrend as your indicator. With this you can also set as 10 & 3 and it is possible to insert your own setting as well.
Now start tracking when the signals are in your favor.
You can also follow the arrows for the signals to buy and sell
Supertrend

EURUSD - 1 hour callShort EURUSD as it breaks pivot. Fundamental news expected data - US Inflation data. Market is expected to be volatile , good for trading with cautious SL. All Bulls and Bears point mentioned.

03/09 BTC/USDT PRICE ANALYSIS - ALTUS.FINANCEGreetings TradingView!
Bitcoin has been on a wild ride for the past couple weeks, we have managed to latch on to $49,000 with a level of conviction that perplexes the bears. Its bullish territory and a bulls game at the moment, we hope to see a daily candle close above the $50,000 mark. This will position us right for further upside. If we close below the $50,000 daily resistance level then you can expect us to retest $46,500 once again.
September is looking pretty bullish from the get-go, with many alts taking flight as BTC dominance drops to the low 40 percent mark.
Happy Trading!
ALTUS


ETHEREUM SHORT AND LONG DAY TRADING, 10% PROFIT PER DAYEthereum is in a Ascending channel, If you trade the up-trends and down-trends with 5x leverage while using the indicator 'super trend', along with support and resistance lines, with stop-losses at the nearest swing high or swing low to prevent liquidation, you can make 10-20% or more each day easily. This is a safe and highly profitable strategy.

PMax Explorer Strategy - INDICES & METALS BacktestingThe pair and the time frame you see is the winner in the INDICES & METALS category with profit factor criteria
From 4032 results we have for this strategy :
* 1451 results with Profit Factor > 1
* 270 results with Profit Factor>1 and Sharpe Ratio>0
* 19 results with Profit Factor>1 and Sharpe Ratio>0 and Percent Profitable>50
* Best timeframe : 1m with 18 and 8m with 17 pairs
* Best pair for all categories : OANDA:BTCUSD with 28 / BINANCE:BTCUSDT with 27 timeframes
* My rating for this strategy is : 0.4712%
Check my posts for all instrument categories
1st (FOREX), 2nd(CRYPTOs) and 3rd(INDICES/METALS)
I will split each strategy backtesting in this manner
I'm talking for strategy :
PMax Explorer STRATEGY & SCREENER (by KivancOzbilgic) Oct 10, 2020
I test 29 Forex pairs from FXCM, 51 Crypto Pairs from Binance and 46 CFDs Indices and Metals from OANDA
In total 126 pairs using 32 !!! timeframes
1,2,3,4,5,6,7,8,10,12,15,17,20,24,25,30,45 minutes
1,1-1/2,2,3,4,5,6,7,8,10,12,16,20 hours
1 and 2 Days
In total 4032 results per strategy
I like profit factor and Sharpe ratio as my main guides but also percent profitable does matter
The results of forex were with 1000 contracts, default currency USD and 0.07 USD per order commission
At Cryptos i use 1 contract, default currency USD and no commission because most cryptos are spread based.
At Indices i use the same details as Crypto.
I didn't touch any settings at the strategy for all three ideas (only the backtesting starting day where i maxed out the available data)
I can't post direct links according to house rules, since i love TradingView and i play with their rules.
However my profile links and my signature may help for extensive information.

PMax Explorer Strategy (by KivancOzbilgic) - CRYPTOs BacktestingThe pair and the time frame you see is the winner in the CRYPTO category with profit factor criteria
From 4032 results we have for this strategy :
* 1451 results with Profit Factor > 1
* 270 results with Profit Factor>1 and Sharpe Ratio>0
* 19 results with Profit Factor>1 and Sharpe Ratio>0 and Percent Profitable>50
* Best timeframe : 1m with 18 and 8m with 17 pairs
* Best pair for all categories : OANDA:BTCUSD with 28 / BINANCE:BTCUSDT with 27 timeframes
* My rating for this strategy is : 0.4712%
Check my posts for all instrument categories
1st (FOREX), 2nd(CRYPTOs) and 3rd(INDICES/METALS)
I will split each strategy backtesting in this manner
I'm talking for strategy :
PMax Explorer STRATEGY & SCREENER (by KivancOzbilgic) Oct 10, 2020
I test 29 Forex pairs from FXCM, 51 Crypto Pairs from Binance and 46 CFDs Indices and Metals from OANDA
In total 126 pairs using 32 !!! timeframes
1,2,3,4,5,6,7,8,10,12,15,17,20,24,25,30,45 minutes
1,1-1/2,2,3,4,5,6,7,8,10,12,16,20 hours
1 and 2 Days
In total 4032 results per strategy
I like profit factor and Sharpe ratio as my main guides but also percent profitable does matter
The results of forex were with 1000 contracts, default currency USD and 0.07 USD per order commission
At Cryptos i use 1 contract, default currency USD and no commission because most cryptos are spread based.
At Indices i use the same details as Crypto.
I didn't touch any settings at the strategy for all three ideas (only the backtesting starting day where i maxed out the available data)
I can't post direct links according to house rules, since i love TradingView and i play with their rules.
However my profile links and my signature may help for extensive information.

PMax Explorer Strategy (by KivancOzbilgic) - FOREX BacktestingFrom 4032 results we have for this strategy :
* 1451 results with Profit Factor > 1
* 270 results with Profit Factor>1 and Sharpe Ratio>0
* 19 results with Profit Factor>1 and Sharpe Ratio>0 and Percent Profitable>50
* Best timeframe : 1m with 18 and 8m with 17 pairs
* Best pair for all categories : OANDA:BTCUSD with 28 / BINANCE:BTCUSDT with 27 timeframes
* My rating for this strategy is : 0.4712%
Check my posts for all instrument categories
1st (FOREX), 2nd(CRYPTOs) and 3rd(INDICES/METALS)
I will split each strategy backtesting in this manner
I'm talking for strategy :
PMax Explorer STRATEGY & SCREENER (by KivancOzbilgic) Oct 10, 2020
I test 29 Forex pairs from FXCM, 51 Crypto Pairs from Binance and 46 CFDs Indices and Metals from OANDA
In total 126 pairs using 32 !!! timeframes
1,2,3,4,5,6,7,8,10,12,15,17,20,24,25,30,45 minutes
1,1-1/2,2,3,4,5,6,7,8,10,12,16,20 hours
1 and 2 Days
In total 4032 results per strategy
I like profit factor and Sharpe ratio as my main guides but also percent profitable does matter
The results of forex were with 1000 contracts, default currency USD and 0.07 USD per order commission
At Cryptos i use 1 contract, default currency USD and no commission because most cryptos are spread based.
At Indices i use the same details as Crypto.
I didn't touch any settings at the strategy for all three ideas (only the backtesting starting day where i maxed out the available data)
I can't post direct links according to house rules, since i love TradingView and i play with their rules.
However my profile links and my signature may help for extensive information.

Bitcoin Finding Resistance at 200 EMABitcoin is currently testing RESISTANCE at the YELLOW 200 EMA line. The GREEN SUPER TREND indicator is signaling LONG and the RSI is not yet over bought. If price can BREAK RESISTANCE and SUSTAIN SUPPORT above the YELLOW 200 EMA at around 40k then a retest of resistance around 52k is not out of the question. Until price breaks above the 200 EMA I remain neutral on this trade.
*If you found this information helpful, please consider donating towards my trading future on the CASH APP @ $Darkby

SuperTrend STRATEGY (by KivancOzbilgic) - INDICES/ME BacktestingThe pair and the time frame you see is the winner in the INDICES/METALS category with profit factor criteria
From 4032 results we have for this strategy :
* 1893 results with Profit Factor > 1
* 206 results with Profit Factor>1 and Sharpe Ratio>0
* 2 results with Profit Factor>1 and Sharpe Ratio>0 and Percent Profitable>50
* Best timeframe : 12m with 13 pairs
* Best pair for all categories : OANDA:BTCUSD with 24 / BINANCE:BTCUSDT with 20 timeframes
* My rating for this strategy is : 0.0496%
Check my posts for all instrument categories
1st (FOREX), 2nd(CRYPTOs) and 3rd(INDICES/METALS)
I will split each strategy backtesting in this manner
I'm talking for strategy
SuperTrend STRATEGY (by KivancOzbilgic) Sep 10, 2020
I test 29 Forex pairs from FXCM, 51 Crypto Pairs from Binance and 46 CFDs Indices and Metals from OANDA
In total 126 pairs using 32 !!! timeframes
1,2,3,4,5,6,7,8,10,12,15,17,20,24,25,30,45 minutes
1,1-1/2,2,3,4,5,6,7,8,10,12,16,20 hours
1 and 2 Days
In total 4032 results per strategy
I like profit factor and Sharpe ratio as my main guides but also percent profitable does matter
The results of forex were with 1000 contracts, default currency USD and 0.07 USD per order commission
At Cryptos i use 1 contract, default currency USD and no commission because most cryptos are spread based.
At Indices i use the same details as Crypto.
I didn't touch any settings at the strategy for all three ideas (only the backtesting starting day where i maxed out the available data)
I can't post direct links according to house rules, since i love TradingView and i play with their rules.
However my profile links and my signature may help for extensive information.

KCS Long Bullish 60%KUCOIN:KCSUSDT I see from the Super Trend indicator that it has entered the buy zone, and from the Ichimoku Cloud indicator it looks like it is about to pass the red cloud. My target is resistance above the one I marked.


BTC Bear Flag on 4HBTC is forming a BEAR FLAG where I have highlighted in white. This suggests a move LOWER in price. The trend is BELOW the RED SUPER TREND RESISTANCE LINE and also BELOW the YELLOW 200 MA RESISTANCE LINE. This indicates a BEARISH forecast as long as the trend stays BELOW these RESISTANCE LINES.

SuperTrend 3XThis is a fork of SuperTrend by KivancOzbilgic
There are 3X SuperTrend lines and EMA 200 so you don't have to add them manually.

Bitcoin using Supertrend to guide buy back. TF=2hr1.Sold off to 50% holding (marked roughly by red arrow
and blue cross) waiting for prices
to go south and touch the green superTrend
turning it red
2.THEN wait for further southward movement
of prices till it makes the superTrend into
redHorizontal at which time buy in at
lower prices (undetermined at moment, just eyeball it)
ps: guide to sell was takeProfit indicator TF=1hr
pps: this is my idea that I am using

blind stratsupertrend relaxed long short monitorOpen analysis only, no formal reccommendations, no investment signals.
please be aware that are incomplete analyzes, missing money management strategy like DCA, etc.
The idea is to investigate and evaluate returns beyond bear and high volatility trend through supertrend strategies.
No further details about this blind strategy, publishred as personal monitoring tool.
FM

MU Short Call. First one hit, loading up the gun for second.Mu is on a RUN. Using supertrend and being on par with the 1 month/3month chart...... its only inevitable....we like the stock.

aud usd shorttriple super trend strategy H1
1. Price is below the H1 200 EMA - white line
2. Price is below the H4 200 EMA - blue crosses
3. Stoch RSI near the overbought position - death cross
4. Stop loss position 2 supertrend lines above the entry candle
5. RR: 1:1.5

BTC trying to make Inverse H&S on high TF!nice support on the fib level and also super trend!
ABC correction is the main pattern for BTC right now!


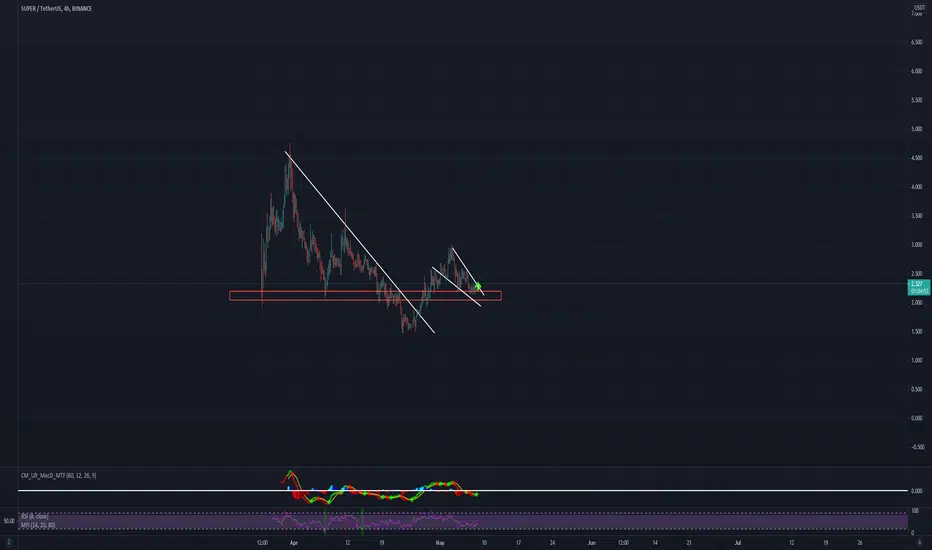
SUPER SUPER look super good for 5-10% scalp. Still in downtrend so not calling for a moon yet. Eventually it may come close to ~5000 resistance. The rest will depend on whether it will get above it or not.
